
12/20/17: Tis the Season, Take 2

SHI 12/20/17: Tis the Season
December 19, 2017
SHI 12/27/17: Sizzling!
December 27, 2017
Sorry about that … apparently, I’ve had a bit too much eggnog.
Oops. I hit the wrong button and sent you a ‘blank’ blog post yesterday. But you already know that. Sorry. 🙂
I have an urgent need to do some (almost) last minute shopping, so I will keep today’s blog short and sweet. Yes, I’m off to the malls to do my part: Consumer spending, here I come!
Welcome to this week’s Steak House Index update.
If you are new to my blog, or you need a refresher on the SHI, or its objective and methodology, I suggest you open and read the original BLOG: https://www.steakhouseindex.com/move-over-big-mac-index-here-comes-the-steak-house-index/
Why You Should Care: The US economy and US dollar are the bedrock of the world’s economy. This has been the case for decades … and will continue to be true for years to come.
Is the US economy expanding or contracting?
According to the IMF (the ‘International Monetary Fund’), the world’s annual GDP is almost $80 trillion today.
At last count, US ‘current dollar’ GDP is about $19.5 trillion — about 25% of the global total. Other than China — a distant second at around $11 trillion — no other country is close.
The objective of the SHI and this blog is simple: To predict US GDP movement ahead of official economic releases — an important objective since BEA (the ‘Bureau of Economic Analysis’) gross domestic product data is outdated the day it’s released.
Historically, ‘personal consumption expenditures,’ or PCE, has been the largest component of US GDP growth — typically about 2/3 of the total. In fact, the majority of all US GDP increases (or declines) usually result from (increases or decreases in) consumer spending. This is clearly an important metric. The Steak House Index focuses right here … on the “consumer spending” metric.
I intend the SHI is to be predictive, anticipating where the economy is going – not where it’s been. Thereby giving us the ability to take action early.
Taking action: Keep up with this weekly BLOG update. Not only will we cover the SHI, but we’ll explore related items of economic importance.
If the SHI index moves appreciably -– either showing massive improvement or significant declines –- indicating growing economic strength or a potential recession, we’ll discuss possible actions at that time.
The BLOG:
I suspect the tax bill will pass and shortly become law — perhaps it already has. As a result, unfortunately, our beloved US is likely to become deeper in debt. But don’t take my word for it. Let’s ask the folks that study this stuff pretty much every single day. Let’s ask the Congressional “Joint Committee on Taxation.” Here’s a chart they published on December 18:
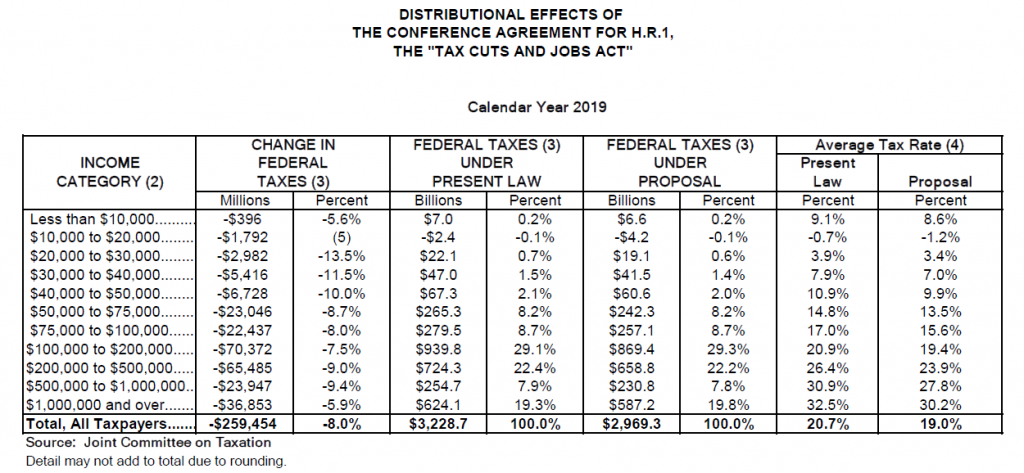
Under the new tax act, Congress itself believes annual tax collections from individuals will decline by almost $260 billion by 2019. Thereby increasing our annual deficit … and our national debt.
Who owns the national debt? Take a look at this graphic, courtesy of Bloomberg:
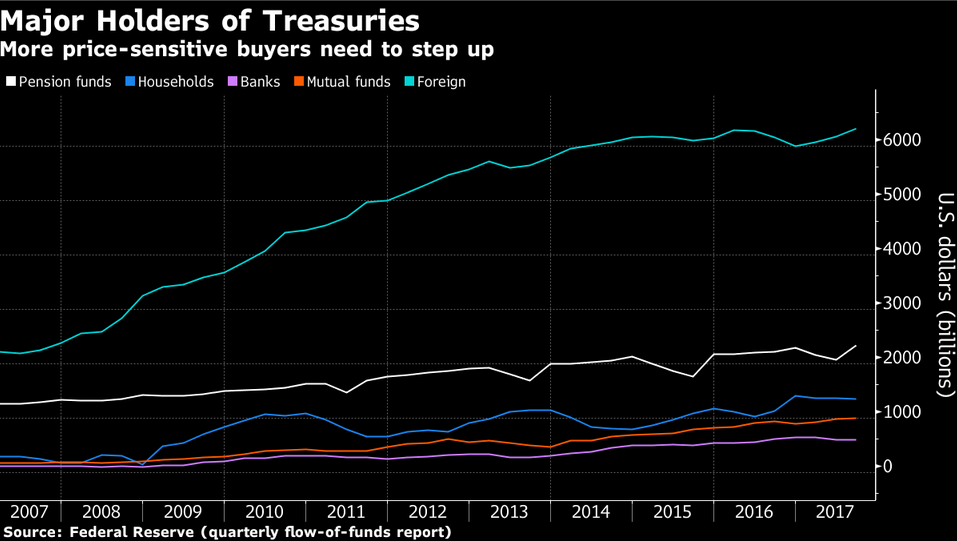
About $6 trillion is owned by foreign governments. China and Japan own the largest amounts.
Now that the FED is no longer reinvesting in new US Treasuries when existing Treasuries pay off, and with annual deficits deficits likely increasing, the Treasury expects to be issuing more debt. How much more? Take a look:
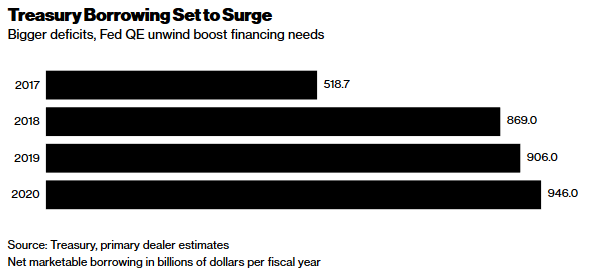
Note: The annual numbers above are in billions of dollars. This week, the 10-year treasury yield has increased by about 10 basis points. I suspect concern over the data in the graph above is one of the likely culprits. With more Treasury supply, but static demand, theory suggests the price will fall. And when Treasury prices fall, yields increase.
The bottom line? Ultra low, long-term rates — at least here in the US — may become a thing of the past. For now. Now, that doesn’t mean long-term rates will soon rise precipitously … simply that the “new normal” range for the 10-year Treasury yield may step up from the 2.0-2.5% range into, say, 2.2 to 2.6 or 2.7%.
What does this mean for you? If you can lock in long-term debt at ultra-low rates, now may be the time to do it. Before it’s too late.
But as this is the Holiday Season … and it’s the time of year to kinder and gentler … I’ll step off my soap box. It’s entirely possible, I’m wrong…and this will all work out well. It’s entirely possible the new tax act and over-seas profit repatriation will spur significant US domestic corporate investment in plant, equipment and employees, boosting employment and productivity, and, ultimately the US GDP. It is definitely possible. So in the spirit of the holidays, I’ll keep my nay-saying to myself, sing a few carols with the neighbors, and keep my fingers crossed.
Because I really do hope our GDP gets up into the 3s and stays there. According the the NY Fed, we’re already there. Take a look at an image of their most recent Nowcast:
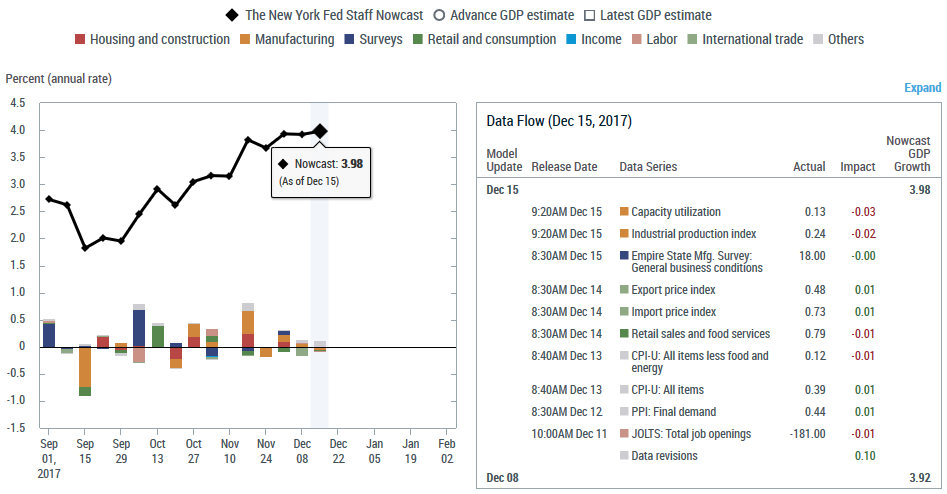
Wow. They feel Q4 GDP growth is trending at almost 4%! The Atlanta FED ‘GDPNow’ reading for December 19th is pretty close: 3.3%.
So maybe the administration is right … maybe the experts in Congress are wrong … and maybe the US GDP is ready to lift off in 2018. Consumers certainly seem cheery: Consumer confidence (@ a 17 year high) and University of Michigan ‘Current Economic Conditions’ survey (115.9 – up 3.6% over last year) certainly all seem to be trending in the right direction, adding fuel to the proverbial fire. So … HO, HO, HO … to all a Merry Christmas and Happy New Year!
Or so we hope, right? 🙂
Let’s see how consumers are spending this week before Christmas. Hmmm….well, if our expensive steakhouses are an accurate barometer, not well. At least, not well when compared to the same week in 2016. Take a look:
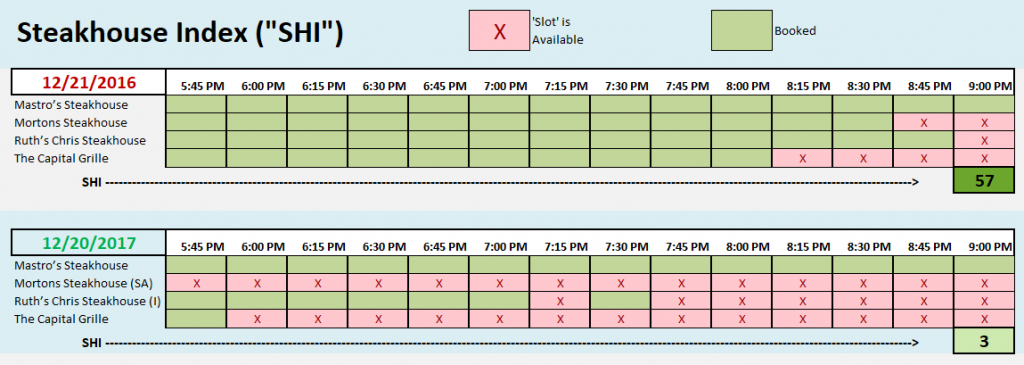
Last year at this time, Mortons was almost fully booked. Steaks were available at only 8:45 or 9:00 pm — far to late for us old folks. 🙂
The others — even The Capital Grille — were also in high demand. But not this year. On this coming Saturday, Lobster Mac & Cheese will once again be selling like hotcakes at Mastros Ocean Club; and, while Ruths’ is doing quite well … our other two laggards, well, are not. Take look at the longer-term trend grid:
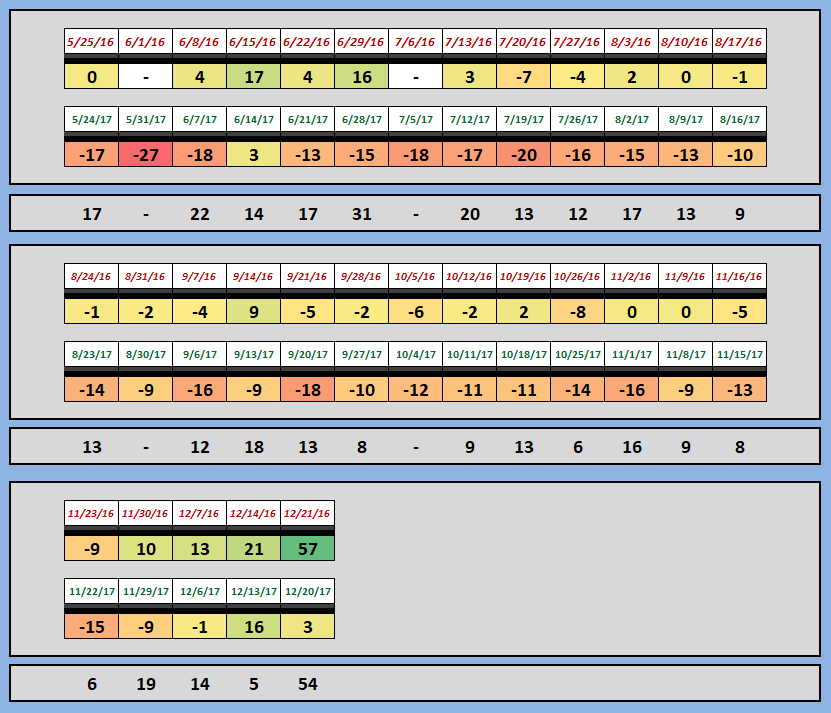
For the first time ever, the gap between 2016 and 2017 is phenomenally wide. I am really surprised. I expected to see a big SHI number this week. With consumer confidence at all time highs, I assumed the consumer would be spending big bucks at their local extravagant eatery. But this does not seem to be the case.
What does this mean? I’m not sure. Perhaps nothing … but I am certainly a bit befuddled. By all other indicators, the US economy appears to be firing on all cylinders. But not according to the SHI. Even more interesting, our continued testing our “national footprint” in the 10 total markets, with the exception of Seattle, the other 9 (including the OC) are not showing strong seasonal demand — even though this is the last weekend before Christmas. Odd.
Again, what does this mean? Simply that the SHI is forecasting a different outcome than the two Nowcasts and the consumer metrics I discussed above. Let’s see what next week brings.
– Terry Liebman


2 Comments
One of the things that I have learned in my very short tenure of investing is that in approaching big events, whether on an individual company basis, or a larger macro level, the markets more often than not tend to behave according to a “buy the rumor, sell the news” attitude.
This is to say that the market will build in the expected outcome of the event to prices, and that upon the passing of the event, they tend to sell off, as pricing has been built in and there are no buyers left over as they all got in before the event in question took place.
The SHI could be suggesting the same. Granted, I tend to think only on how things affect the stock market in particular, not the economy as a whole.
Only time will tell once the tax bill is inevitable passed.
Ty…thanks for commenting. Yes, your characterization is accurate. Often, the market performs right to that script.
This time, however, it may not. But we won’t know for a year or two. Why? Well, it will ultimately depend on the mid-term impact the tax bill has on both corporate earnings GDP growth. Yes, much of the anticipated corporate profit growth, in my opinion, is already priced into the stock market. However, repatriation of overseas capital and the 100% deductibility of capital expendatures may each have a very positive on further corporate earning growth. Whether from stock buy-backs, boosting ROI for remaining shares, or from increased spending and resultant productivity, earnings are likely to grow. On the other hand, if (as I expect) our deficit grows significantly, and national debt climbs rapidly, GDP growth would likely come under pressure. So we have both potential headwinds and tailwinds. As always, time will tell. – Terry