
2017 Forecast: The FUTURE is ….

SHI Update 1/11/17: Trump Takes the White House
January 11, 2017
SHI Update 1/18/17: Steaks on Fire!
January 18, 2017
Predicting the future is difficult. At least if one is expecting accuracy.
Regardless, here are my predictions for 2017. Warning: This paper which I’ve entitled “The New World, Trumponomics and Unintended Consequences” is a long one. If you’re looking for a quick read, read this introduction and skip to the end where you’ll find my “2017 Forecasts.” If you have the time, and are interested in the detail behind the predictions, that information is here too. All right, let’s get this annual rite started…………
ARE YOU READY FOR 2017? Are you sure?
As this year begins, the only thing we know for certain is financial and economic predictability is pretty much out the window. President-Elect Trump has made this patently clear from his campaign claims and Tweets.
Sure, as 2017 begins larger economies around the globe have a traditional mix of strengths, weaknesses, issues, and bear-traps, but we have a unique new variable in our economic soup: Trump and his Republican majority in the House and Senate are re-writing the rules.
“The United States Will now be run like a business.”
“Under budget and ahead of schedule,” Trump assured us – perhaps somewhat metaphorically – back in October, making his case at a new Trump hotel.
Trump’s comments would have made Will Rogers happy. Back in 1923 he commented, “I would love to see Mr. (Henry) Ford in there, really. I don’t know who started the idea that a President must be a Politician instead of a Business man. A Politician can’t run any other kind of business. So there is no reason why he can run the U.S. That’s the biggest single business in the World.“
So, America will be run like a business. Interesting. An $18.5 trillion business. Is it even possible? What would we focus on?
Changing corporate tax law? Individual tax cuts? Trade wars? Infrastructure spending? Walls? Quotas? International relations? Labor productivity? Import tariffs? Corporate profitability? Border taxes? Immigration restrictions? Fiscal stimulus? Creating new manufacturing strengths and jobs? Repatriation? What will or will not be implemented? And when? How might our ‘adversaries’ react? And what might the unintended consequences be?
Or will we see ‘business as usual’ over the next 4 years? Has the campaign simply been hype? A ‘sales pitch?’
Time will tell. At least one strategic objective of the new Trump administration seems clear: An annual GDP growth of over 3%. After a decade at, or near, 2%, the new administration seems focused on a 3+ number. Can it be done?
I remain skeptical. Not because I doubt the administration’s resolve. No, I think they’re intently focused on this objective. But because, “You can’t make a silk purse out of a sow’s ear.” The “Secular Stagnation” theories of Larry Summers and other leading economists remain. Remember: Our aging, retiring American workforce is still aging and retiring; the technology of today is, at best, a zero-sum gain as modern robots displace workers around the globe; and, the economic benefit from years of globalization is clearly under threat as protectionism reigns in all corners of the globe.
The proposed corporate tax law changes will cause massive disruptions in internal commerce.
No, I’m concerned he simply doesn’t have the raw materials to work with. It is likely the proposed corporate tax law changes will have a massively disruptive effect … yet will have little or no long-term impact on the US economy.
But I’m ahead of myself. I’ll get back to predictions shortly…but first let’s look back, and see how I did in 2016.
Did my predictions come true? Let’s take a look:

Grading myself, I’d say my crystal ball worked pretty well!
This year, I will break my forecast into three (3) sections: Economics, Finance, and Housing …following the general categories in my economic and financial BLOG.
Let’s get to it.
Economics:
The Labor Markets: For the first time in many years, US labor markets start the year on solid footing. Sure, challenges remain, such as productivity, U-6 and demographics, but in the macro things are pretty good. We finished 2016 with an ‘official’ unemployment rate of 4.7% Even better, the number I watch closely from Table A-16, the ‘U-6’ metric, has shown meaningful improvement:

The percentages above apply to the ‘civilian labor force’ (CLF). At the end of 2016, that number was about 160 million people. Meaning a decline in U-6 from 9.9% in December of 2015 to 9.2% in December of 2016 tells us about 1.1 million Americans who were previously discouraged, ‘marginally attached,’ or working part-time when they didn’t want to, solved that problem: They now have the job they want. This is good news … however … if we subtract 4.7% (the official rate) from 9.2%, and then multiply the CLF by that percentage, we still have 7.2 million folks looking for a solution.
By the end of 2016, the US had over 26 million folks, aged 65 years or older, not in the civilian labor force … or over 16% of the those who are working.
At the same time, many older Americans are leaving the labor force. By the end of 2016, there were 26.3 million folks 65 or older who were not in the labor force. It should come as no surprise the ‘participation rate’ for this age cohort is consistently only about 23%, year after year. Suggesting, conversely, 77% of these folks are not working – nor do they have any interest in doing so. In other words, they are retired.
But even though the percentage is fairly constant, the size of this cohort is not. In the last 5 years, this group has increased by almost 5 million people. 5 million more people who don’t work…probably receive social security income…probably are Medicare patients…who intend to save much more than they spend.
Rest assured, this is not a social or political commentary. Just an observation. One that has significant import on some of the numbers we’ll discuss below.
So, to summarize:
-
The unemployment rate is low, probably near its ‘natural rate’.
-
The US labor markets, over all, are healing. Albeit slowly, but they are moving in the right direction.
-
At year end, about 146.3 million people were ‘employed’; 26.3 million folks 65+ years of age were not in the labor force. Thus, retired folks, as a percentage of those employed, equaled 16.1% in December.
Inflation and the PCE: When discussing US inflation, the FED uses ‘personal consumption expenditures’ or PCE, produced by the ‘Bureau of Economic Analysis’ (BLS) at the Department of Commerce.
2016 PCE increased 1.4%.
The latest release (on December 22) showed no change (November) over the prior month, and a 1.4% change from one year ago. Excluding food and energy (core), the one year PCE increase was 1.6%.
Here’s is a graphic from that release:
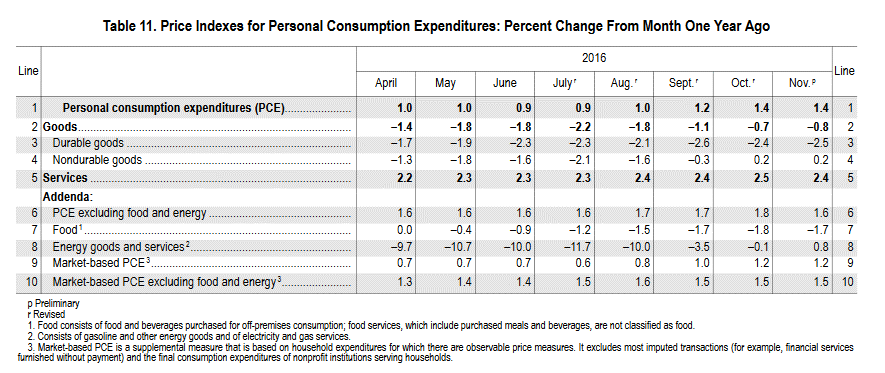
It’s worth noting the core PCE has been consistently 1.6% for quite some time.
Since the election, investors seem to have reset their expectation for US inflation. Mohamad El Erian, the ex-Pimco bond expert, now the chief economic adviser at Allianz, the global insurer, feels US Inflation is held down by “structural forces” but comments the recent pick-up in investor concern about inflation is not a surprise:
“The increase in inflationary expectations makes sense given the tone and content of the initial policy announcements of the President-Elect. This reflects both the expected effects on inflation of higher aggregate demand, as well as the indirect impact from the depreciation of the Euro against the dollar.”
But whether those expectations are borne out will depend on Mr. Trump’s policy announcements being properly implemented when he becomes president, and European countries deciding to pursue similar tax and spending plans to boost growth.”
In other words, like all economists, he’s suggesting “it depends.” Which doesn’t help our forecast one bit. But it does demonstrate potential unintended consequences.
The FED, on the other hand, is happy to make a forecast:

As you can see from the chart above, the FED is forecasting PCE inflation of 1.9% in 2017, with a core PCE of 1.8% (suggesting a faster increase in food or oil prices – oil most likely.)
My 2015 inflation forecast was based on my expectation that both global commodities and wages would show relatively tame increases. I was correct. Notice I said ‘global’ not ‘US’.
Because US inflation, today, is impacted by forces outside our system. For example, suppose I asked you where your Toyota Camry was ‘made.’ What would you say? Japan? Well, you’d be wrong because today a Japanese car, like the Camry, may be made in the US using parts/components manufactured all over the world.
In fact, the Toyota Camry is more ‘Made in America’ than the Ford F-150.
What does “Made in America” mean today? It’s complex. In 2014 the Commerce Department ‘Economics and Statistics Administration’ asked precisely that question. The answer, again, is complex. The concept of ‘value added’ seems to drive the debate:
“Value added considers only the new production completed at each stage of the manufacturing process i.e., the labor and capital applied by each firm to the purchased inputs produced elsewhere. This measure of manufacturing activity is derived in the Economic Census by subtracting the cost of materials, supplies, containers, fuel, purchased electricity, and contract work from the value of shipments (products manufactured plus receipts for services rendered). The result of this calculation is adjusted by the addition of value added by merchandising operations (i.e., the difference between the sales value and the cost of merchandise sold without further manufacture, processing, or assembly) plus the net change in finished goods and work-in-process between the beginning and end of year inventories.”
Clear as mud, right?
Global supply chains today are as complex as DNA strands. For all his animosity toward Mexico and his claim that he will cancel NAFTA his first day in office, Trump may find the action more difficult than the words. Think about supply chain complexity as you consider this paragraph from a recent Economist article:
“America would suffer, too. Its trade with Mexico is worth just 3% of its GDP, but some 5 million American jobs depend on it. The design, manufacture, and servicing of everything from appliances to medical equipment is spread across both borders. Cars made in Mexico are stuffed with parts manufactured in America; some 40% of the value of Mexican exports consists of inputs bought from the United States.”
All of which makes me wonder how the incoming administration plans to define an “import” and an “export.” Should be interesting.
Here’s my point: Regardless of where a component of a finished goods sold in the US is manufactured, the price of that finished good is driven by global inputs, both labor and materials. Thus, ultimately, US inflation is determined by forces both outside and inside our economy. Here’s an interesting read on this topic, if you’re interested:
http://www.esa.doc.gov/Reports/what-made-america
This year, wage inflation is likely to increase. But not by much. Consumer inflation expectations (whether measured by the University of Michigan, the FED, or some other source) remain muted. Thus, wage inflation is likely to be more driven by employer competition for labor than general worker demand for COLA. This fact will keep wage inflation low.
Will US fiscal policy fuel inflation? Is this a good time for infrastructure spending? Everyone driving America’s roads and highways would agree work is needed…but from an economic perspective, this is not a good time. The US is already at, or near, full employment. Again, we’ll have to wait and see what agenda President Trump and the congress decide to push forward.
The US dollar has continued appreciating against other currencies. Here is a 5-year chart:

The dollar index measures the USD relative value against a “basket of foreign currencies” often referred to as a basket of US trade partners’ currencies.
Look at the move up since the middle of 2014. In the past 2 ½ years, the index is up from about 80 to over 101 today – a more than 25% increase.
At the same time, commodities remain cheap, when measured in USD:

Do you see the congruency? At the same time the USD began to appreciate, commodity prices began to fall. In fact, a large portion of commodity price declines – many of which trade in the USD – can be attributed to the dollar appreciation. But not all of it.
In June of 2014, the Bloomberg commodity index was 136 … today it’s 86 – a decline of 58%. So about ½ the decline is currency related, the balance, value declines.
The US economy, compared to most other advanced nations around the globe, is strong. Suggesting the USD will remain strong. Further, it’s possible Trump administration policy changes will add more fuel to this file, lifting the USD to even greater heights against other currencies.
So, to summarize:
-
The inflation rate is low, remaining below 2% today. I expect it to remain there in 2017.
-
While the labor markets are healing, I don’t think we’ll see much additional wage inflation. Of course, a Trump infrastructure bill might derail this forecast.
-
Nor do I believe we’ll see production-driven or commodity- fueled inflation in 2017.
Gross Domestic Product (GDP):
On October 19, 2016, the Financial Times of London published an article entitled, “Why are Bond Yields So Low?” The article discussed global bond yields, not just those in the US – which, of course, spiked just a few weeks later after our Presidential election.
No, this is not an interest rate discussion…it is a GDP commentary. But they are related, correlated and directly linked. For some years now, we have been experiencing a global macroeconomic phenomenon triggered by a demographic shift never before experienced: Older folks living a lot longer than they even did before; in significantly increased numbers; coupled with declining fertility rates in those same developed nations.
Japan led the way. And the US and western Europe are right behind. Developed nation GDPs declined, again, in direct correlation with this phenomenon.
Greece is another example of economic demographics gone awry. Per the Wall Street Journal, from an article entitled “Last Lifelines Crumble for Many Greek Families as New Conflict With Creditors Looms,” published January 13th, “only 3.7 million people have work in a country of 11 million.” Said another way, 7.3 million of the 11 million Greeks do not work.
It takes no great imagination to understand this creates immense economic and financial strain on the country’s finances. This fact is clear from the negative Greek savings rate in the chart below:

Larry Summers and Ben Bernanke call this phenomenon ‘secular stagnation.’
All around the world, older folks save … they don’t spend. Older folks don’t invest…they look for lower-risk or risk free investments that generate spendable cash flow. Older folks are risk averse.
Secular Stagnation?
The FED and other central banks around the world have tried to jump-start their respective economies with massive quantitative easing – monetary stimulus. Acquiring almost $18 trillion of sovereign, mortgage-backed, and high-grade corporate securities – the exact same financial instruments retired folks, pension funds, and insurance companies also wish to acquire.
Which pushed yields down even further. Supply and demand in action.
GDP grow when people invest capital and take risks. But older folks are risk averse. They do neither. As our aging population grow, these demographic conditions will not improve. The macroeconomic conditions which have set a GDP growth ceiling will only get worse.
A few of the economists at the FED have finally commented on these developments.
Late last year, they published a paper entitled, “Understanding the New Normal: The Role of Demographics.” If you’re interested, here’s the URL for this quick read – only 74 pages: https://www.federalreserve.gov/econresdata/feds/2016/files/2016080pap.pdf
Their summary:
“Since the Great Recession, the U.S. economy has experienced low real GDP growth and low real interest rates, including for long maturities. We show that these developments were largely predictable by to observed and projected changes in U.S. population, family composition, life expectancy, and labor market activity. The model accounts for a 1 ¼ {percentage-point decline in both real GDP growth and the equilibrium real interest rate since 1980} essentially all of the permanent declines in those variables according to some estimates. The model also implies that these declines were especially pronounced over the past decade or so because of demographic factors most-directly associated with the post-war baby boom and the passing of the information technology boom. Our results further suggest that real GDP growth and real interest rates will remain low in coming decades, consistent with the U.S. economy having reached a new normal.”
Finally…someone in Washington is paying attention to this stuff!
We’ve heard the Trump Administration’s plans to overcome these structural deficiencies. Might regulation reduction, new business-friendly laws, and infrastructure spending be an economic defibrillator?
Some of these changes might be easy to implement; others, not so much. Those of you who follow Keynesian economics will recall that ‘fiscal stimulus’ is theoretically “debt neutral:” meaning that while the increased government spending which also increases deficits…in theory are soon eliminated due to economic growth and the increased taxation that results. This theory hasn’t always worked perfectly in the real world. And many of the more hawkish Senators (Rand Paul) are unlikely to support such efforts.
But we must face a hard truth: Compared to historic performance, our GDP growth has been low for many years now…and it’s unlikely to change soon. Consider this graphic:

Look at the “Time Period” box. Gone are the days of real annual 3% GDP growth. I wish I could say I’m optimistic the new administration will have the “juice” to bring us back to the heady days high GDP growth. I cannot.
On December 14th, the FED released their last economic commentary for the year. The first paragraph of their press release summarized their thoughts:
“Information received since the Federal Open Market Committee met in November indicates that the labor market has continued to strengthen and that economic activity has been expanding at a moderate pace since mid-year. Job gains have been solid in recent months and the unemployment rate has declined. Household spending has been rising moderately but business fixed investment has remained soft. Inflation has increased since earlier this year but is still below the Committee’s 2 percent longer-run objective, partly reflecting earlier declines in energy prices and in prices of non-energy imports. Market-based measures of inflation compensation have moved up considerably but still are low; most survey-based measures of longer-term inflation expectations are little changed, on balance, in recent months.”
And, of course, after months of speculation and false starts, the FED finally decided they had to move on rates: up ¼%. I agree with their choice. It was time.
In their notes from that December meeting, released on January 4th, they made further comments on the economy and rate-adjustment timing:
“In determining the timing and size of future adjustments to the target range for the federal funds rate, the Committee will assess realized and expected economic conditions relative to its objectives of maximum employment and 2 percent inflation. This assessment will take into account a wide range of information, including measures of labor market conditions, indicators of inflation pressures and inflation expectations, and readings on financial and international developments. In light of the current shortfall of inflation from 2percent, the Committee will carefully monitor actual and expected progress toward its inflation goal. The Committee expects that economic conditions will evolve in a manner that will warrant only gradual increases in the federal funds rate; the federal funds rate is likely to remain, for some time, below levels that are expected to prevail in the longer run. However, the actual path of the federal funds rate will depend on the economic outlook as in-formed by incoming data.”
A large 2017 wild-card is the size of the FEDs balance sheet – and the future changes in that size. Here’s a graphic representation of the balance sheet size changes since before the Great Recession of 2008:
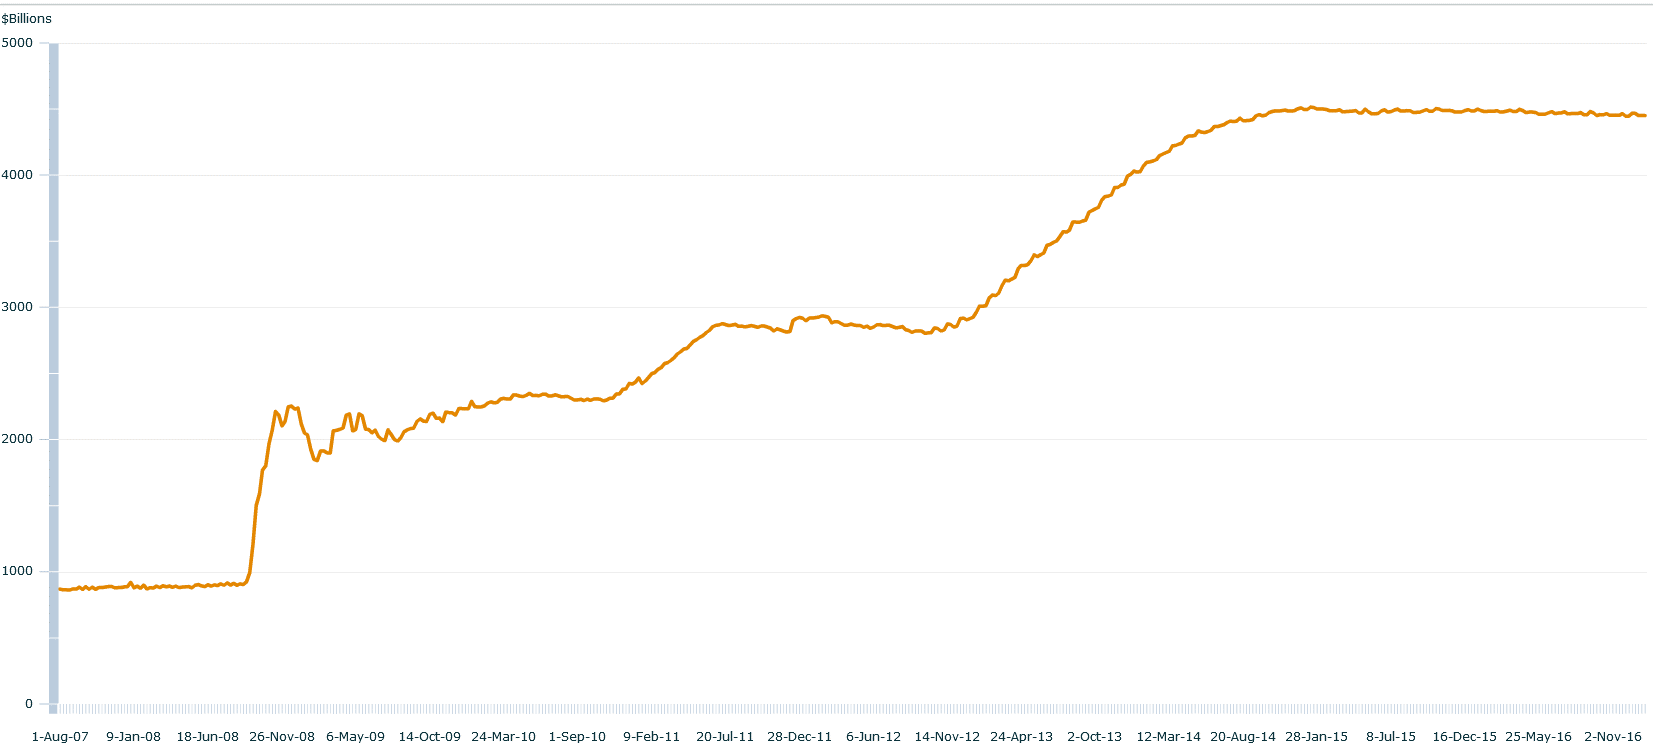
It may be a bit hard to tell from the image above, but since the middle of 2014 the size has been consistent: Right around $4.4 trillion of US Treasuries and mortgage-backed securities. In the January 4th minutes, they commented on the policy of reinvesting any debt pay-downs on the debt they hold on their balance sheet:
“The Committee is maintaining its existing policy of reinvesting principal payments from its holdings of agency debt and agency mortgage-backed securities in agency mortgage-backed securities and of rolling over maturing Treasury securities at auction, and it anticipates doing so until normalization of the level of the federal funds rate is well under way. This policy, by keeping the Committee’s holdings of longer-term securities at sizable levels, should help maintain accommodative financial conditions.”
The FED balance sheet will remain steady at $4.4 trillion.
So, this balance should continue to remain stable in the months and, possibly, years to come.
Financial:
US Tax policy: We’re in uncharted territory here, folks. Pretty much everyone agrees: Our system for taxing corporations is broken. The current law has a higher tax rate (35%) than most other advanced nations, but actual collections are far lower:

Further, the current law incentivizes corporations to leverage to unhealthy levels and move their corporate headquarters, and their tax base, to a foreign country.
Republicans in the House of Representatives, led by Paul Ryan, have proposed a completely new approach to corporate taxation. Remember: This is a concept only. No new bill has been submitted in the House. But all indications suggest change is in the wind.
Here’s the URL link, if you’d like to read the entire proposal: http://taxfoundation.org/blog/details-house-gop-tax-plan
Let’s focus on business taxation for the moment. The GOP’s plan would alter the corporate income tax in five major ways:
-
The tax rate would be lowered to 20 percent.
-
Businesses would no longer depreciate capital investments. Investments would be fully written off in the year, and in the amount, made.
-
Businesses would no longer need to pay tax on overseas profits.
-
Business interest would no longer be deductible.
-
The corporate tax would be “border adjusted.”
“Border adjustability” is the truly uncharted territory. Here’s how the Financial Times described the plan.
“The border tax adjustment would work by denying US companies their current ability to deduct import costs from their taxable income, meaning companies selling imported products would effectively be taxed on the full value of the sale rather than just the profit. Export revenues, meanwhile, would be excluded from company tax bases, giving net exporters the equivalent of a subsidy that would make them big beneficiaries of the change.”
Charles Lane of the Washington Post explains how it works.
“…the <new law> would impose a flat 20 percent tax only on earnings from sales of output consumed within the United States… It gets complicated, but the upshot is that the cost of imported supplies would no longer be deductible from taxable income, while all revenue from exports would be. This would be a huge incentive to import less and export more, significant change indeed for an economy deeply dependent on global supply chains.”
Like I said, uncharted territory. I have no doubt some version of this tax bill will be proposed and approved by Congress and the President. But it won’t end there.
Here are a few potential unintended consequences:
-
The World Trade Organization (WTO) will challenge this new law as “protectionist” and work to counter its effects.
-
Other countries will do the same…in a variety of ways. For example, to battle USD appreciation, they might sell their own country sovereign bonds (increasing supply, thus reducing price, and increasing rate) to strengthen their own currency. Or, they too could reduce corporate tax rates.
-
This approach may create an uneven playing field for US companies that rely on imports for the products they sell.
-
A company that took on debt, fully expecting to deduct this interest no longer can. This makes debt more expensive and capital cheaper. Will US Bank profitability suffer from reduced loan demand?
-
Capital investment would certainly be in vogue again. But what, precisely, is a capital investment? What, specifically, can be deducted? Is a new office building a “capital investment?” A company that took on debt, fully expecting to deduct this interest no longer can. This makes debt more expensive and capital cheaper. Will banks suffer further from reduced debt demand?
-
US companies importing goods from overseas are likely to experience the greatest disruption.
-
-
The US dollar may appreciate significantly against other currencies. Making US exports far more expensive to buy in other (importing) countries around the world; while, at the same time, making imports much cheaper. The potential product and FX disruptions and dislocations from this dynamic are staggering.
Interest Rates: Short and long-term US interest rates are where FED policy, inflation (both actual and expected), and economic demographics are all manifested. And as much as we may think the United States is an economic island, it is not today…nor will it ever be again. Today, the economies of all nations, to some extent, are inter-connected.
Thus, US interest rates must be viewed from both a local and international perspective. Global economists, such as Mohammad El Erian, understand this fact. In a recent interview, when asked if interest rates will “skyrocket” under the Trump administration, he replied “international arbitrage” will limit US interest rate movement – even if the “Trump Effect” is significant.
Said another way, a debt investor from another developed nation seeking a higher yield can buy US treasuries if he or she can ‘hedge’ the currency risk. If that annual hedge cost is less than the yield pick-up from the trade, they will make the trade. The larger the spread between US rates and the rates in their country, the easier it is to make this trade work. This is international arbitrage.
Trump was elected on November 8th. On Friday of the prior week, the 10-year Treasury “TIPS” (inflation protected security) yielded .12%. By December 23rd it had increased to .63%. Today, it’s back down to .41%. (TIPS generate a return that is a combination of current yield plus the actual inflation each year.)
The up move has been attributed to a dramatic change in market expectations – with Trump’s win inflation and strong GDP growth are once again on the table. The recent down-move, I suspect, has more to do with a market reassessment: Change takes time … and cooperation. The new administration must find common ground with the Republican Congress. Can Trump find common ground with Marco Rubio? This should be interesting.
Some changes could happen quickly – Obamacare and tax reform. Others may take much longer. Years possibly.
It is likely PCE inflation will move up this year. Slightly. It is also likely other developed nations will see an inflation lift this year. (We’re already seeing some ‘supply chain’ and producer-cost inflation in some markets.) But I don’t believe this dynamic will overcome the more structural limits here in the US and in other developed nations.
As a result, while I do expect rate fluctuation, I am not expecting a 10-year Treasury rate above 2.50% this year.
Yes, the new administration is a wild-card. One that night completely derail my forecast. J
But this aside, I remain steadfast in my belief that we have already seen the 2017 peak for the 10-year Treasury. For the balance of the year, the 10-year T will fluctuate no higher than 2.50%. And likely much lower.
Oil: Oil is a global commodity. Like many commodities, it is priced in, and trades in, US dollars. Above, we talked about dollar appreciation. Know that USD appreciation equates to oil price depreciation. A meaningful portion of oil price declines, in USD, between the middle of 2014 and beginning of 2016 was USD generated.
Let’s look at some numbers. On June 20, 2014, the ‘futures’ price for a barrel of WTI (Oil) was $107.26. On that same day, the ‘Dollar Spot Index’ (DSI) was 80.37.
Fast forward to March 13, 2015. The DSI had increased to 100.33 – a 25% increase. Oil had declined to $44.84 – a 58% decline. But a big piece of that decline – about a 1/3rd – was caused by foreign exchange (FX).
Which makes the price of oil extremely difficult to forecast. No, we’ll do it anyway, because – hey – that’s why we’re here!
But let’s shift gears to what I consider to be a more exciting topic: American energy independence!
The US “Energy Information Administration,” or EIA for short, believes the US could become an “energy exporter” within the next 3-5 years! Currently, the US has eleven (11) liquid natural gas “Export Terminals” approved and under construction. The largest terminals expect to be completed and operational between 2017 and 2019. In each, natural gas will be processed and liquefied, loaded onto ships, and exported all over the globe. (How cold is LNG? Converting the gas to a liquid requires it to be “super cooled” to a negative 260 degrees!)
One on the coast of Maryland, one in Georgia, and the balance in Texas or Louisiana. (If you’re interested in locations and ownership, here you go: https://www.ferc.gov/industries/gas/indus-act/lng/lng-approved.pdf)
Here’s the bottom line: Tens of billions of dollars are being invested by numerous companies – often in the form of MLPs – in exporting terminals. The EIA is bullish and so am I: The US will become energy independent by 2020!
Housing:
The national homeownership rate is down more than 5 percentage points from the 69.0% peak in 2004, to just 63.5% in the 3rd quarter of 2016. This slide is unprecedented in American history.
Household growth is not the culprit. Since the ‘Great Recession,’ we’ve seen robust growth in the number of renter households. Per the US Census Bureau Housing Vacancy Survey, the number of renter households hit 43.3 million in Q3 of 2016, up 2 million from 2014 and almost 10 million since 2004.
Homeowner households grew in number in 2016.
At the same time, in 2016 the number of homeowner households finally showed a meaningful increase. After slipping to 74.7 million in Q3 of 2015 (down 87,000 from 2014), by one year later (Q3 of 2016), the number increased to 75.3 million – up 561,000 in 2016. This chart reflects the condition 1 year ago:

As you can see from the chart above, after growing significantly in the preceding 20 years, in the last 10 the number of homeowner households has been relatively flat. Until 2016. Homeowner households grew significantly in 2016.
Yes, housing construction is up … but its mostly multi-family development. Total 2016 housing starts were actually slightly lower than in 2015 – as multi-family construction peaked and began to decline. The sector is now approaching saturation, depending on location. In 2017 single family home construction has will trend at about 750,000 to 800,000 units per year, and will continue to be constrained by the inherent system deficiencies resulting in absurdly high developed lot costs.
This prediction is supported by the “price index” chart below, courtesy of the Census Bureau:

Looking at the “Annual” column, we see that after peaking at 104.9 in 2007, new home sale prices were also impacted by the ‘Great Recession.’ The 2016 3rd quarter index reading of 122.3 now surpass that prior high by almost 17%.
All of which might imply either (1) homeownership is “out of vogue” or (2) it’s being priced out of reach. But according to a 2015 Demand Institute survey, this is not the case. In fact, the opposite is true.
The survey found that 83 percent of respondents expected to own homes in the future. Among renters, 52 percent expected to own homes, including 28 percent who anticipated buying a home with their next move, and 24 percent who expected to buy “someday.”
85% of renters 29 and younger plan to buy a home.
Very large numbers of younger renters expect to become homeowners, including 85 percent of those under age 30 and 69 percent of those aged 30–39. Homeownership demand remains strong. Most Americans believe that homeownership is not only desirable but also attainable. 561,000 households made the leap to homeownership in 2016. Clearly our aging ‘millennial’ generation will produce millions of new homeowners in the coming years:

As expected, home prices continued to increase last year. NAR reports that the median price of existing homes rose in Q3 of 2016 to $239,500 – up from the end of 2015 ($220,800) by 8.4%.
The CoreLogic, Case-Shiller, and OFHEO indexes, which are less affected than the median price by the mix of homes sold, show that prices of repeat sales were up above 5% in 2016, and between 5.3–5.7 percent through the end of 2015.
Interestingly, home price recovery has not been consistent across all markets. According the CoreLogic, pockets of mortgage distress remain. Among the 50 largest metro areas, the share of homeowners with ‘negative equity’ was under 2 percent in Austin, Houston, Portland, San Jose, and San Antonio, but over 19 percent in Las Vegas, Miami, Orlando, and Tampa.

And while home prices in all 20 metro areas tracked by Case-Shiller were up last year, the increases vary widely. For the full year of 2015 – the most recent year with complete data – results were mixed:
-
Home values were up less than 3% in Chicago, Cleveland, and Washington, DC.
-
Yet, values were up about 10 percent in Portland, San Francisco, and Seattle.
Prices are now rising across markets that experienced widely different cycles.
In Los Angeles and Las Vegas, where significant house price inflation in the mid-2000s was followed by sharp declines, prices are again rising rapidly. In the case of Denver, home prices rose only moderately in the first decade of the 2000s but have now climbed to a new high. And in Detroit, where price appreciation was modest but the ensuing drop was large, home prices reached an eight-year high last year.
In summary, while the housing recovery has reached much of the country, neighborhoods hit especially hard by the crash and the recession are still struggling to rebound.
2017 Forecasts
2017 PCE ‘Core’ Inflation Rate: The FEDs 2017 ‘median’ forecast is 1.9%, with a ‘range’ of 1.7% to 2.0%. I think they’re a touch high. Oil is – pardon the pun – adding fuel to the fire here. I believe core PCE will increase no more than 1.5% and the actual PCE 1.8%. We will finish the year below the FEDs 2% target.
2017 US GDP: The FEDs 2017 ‘median’ forecast is 2.1%, with a ‘range’ of 1.7% to 2.4%. Perhaps. But 2017 is a tough one to forecast. On one hand, we have numerous growth-limiting foundational dynamics: Demographics…labor participation rate…productivity…all of which hold down our potential growth.
On the other hand, we have the unknowns of the new administration: Tax cuts, fiscal stimulus, “animal spirits”, all of which imply higher GDP growth. Taking the new Treasury Secretary ‘nominee’ at his word, personal tax rate changes will be ‘revenue neutral’ while corporate tax reductions will generate corporate savings. Add in a possible repatriation of over-seas ‘profits’ and we have the potential fuel for a GDP boost. But these are all longer term. Not 2017.
Remember our GDP components: Consumer spending, investment (personal and business), net exports and government spending. I think 2017 will be a very mixed bag with consumer spending will be neutral to weaker, personal investment neutral, business investment strong, net exports weak and government spending neutral.
So, I’m going to forecast a 2017 GDP of 1.9%.
2017 FED & Short Term Rates: This is even a bigger wildcard. Labor market improvement, GDP growth, reflation, all support rate hikes. But absent some near-term activity spike from new administration policies, we still can’t overcome the foundational US dynamics: We are an aging society that saves more and spends less. Time makes this dynamic worse not better.
Don’t forget about the FEDs balance sheet and its $4.4 trillion of Treasuries and MBS. This balance was about $4.4 trillion on January 6, 2016 and $4.4 trillion on January 2, 2015. In other words, it hasn’t changed…and I suspect it will remain unchanged in 2017.
So, yes, they will increase the Federal Funds rate again in 2017 – probably 2 times – but by no more than .50% collectively. The FEDs forecast disagrees with me. Their 2017 fed-funds ‘median’ is 1.4%. I don’t think we’ll finish 2017 higher than 1.0%
The 2017 10-year Treasury: Last year, the 10-year CMT bottoming at 1.37% on July 5th. And then skyrocketed: On December 16th we peaked at 2.60%. Much to my surprise.
Consistent with my PCE and FED balance sheet forecasts, I believe “term premiums” will remain negative (or at worse, zero), keeping the 10-year CMT more correlated with the long-term rates of other high-GDP, developed nations.
My forecast: I feel the 10-year T will once again fall below 2% this year. I predict a 2017 range of between 1.80% and 2.50%. No higher.
2017 US mortgage rates, loan production & Housing Starts:
The NAR and MBA are great sources of data and forecasts. Some of which I agree with … others, less so. For example, the MBA is forecasting a 10-year Treasury between 2.4% and 2.8%. I disagree. And they are forecasting housing starts growing to an annual pace of 1.3 million by year end. Again, I believe they are high. Total 2016 housing starts were slightly lower than in 2015 – as multi-family construction peaked and began to slide. This sector is now over built and will shrink further in 2017. 1 unit homes will probably continue to trend at or near their current annual pace – about 750,000 to 800,000 per year – constrained by the inherent structural deficiencies in the system resulting in absurdly high land costs. Total 2017 total housing starts will not exceed 1.15 million.
The NAR reported the pace of 2016 existing home sales near 5.6 million units per year. I believe this will increase to 5.8 million pace by the year’s end.
The MBA is a slight bit more optimistic than I am. More on the refi side of the ledger than the purchase. Their forecast is $1.1 trillion in purchase money this year. I think they’re a bit low. With a bit more resale activity and another 5% price appreciation year, 2017 will come in at a $1.15 trillion to $1.2 trillion in purchase money loans. Purchase is king! Refinances, on the other hand, I predict will be lower than the MBA forecast. They will be down from 2016: Likely only about $350 billion. In total, a $1.5 trillion mortgage origination year.
“Off the Beaten Path” 2017 wildcard predictions:
-
Yes, Trump will build a wall…well, sort of. And they’re gonna pay for it! Well, maybe later. Truth be told…it will probably be more of a fence. And probably not this year. Sure … he’s gonna build a wall … but let’s face facts: there’s too much else to do in 2017. So maybe not.
-
China, China, China. A puzzle within a conundrum wrapped in an enigma. Now the 2nd largest economy on the planet, it is a major force in global finance. Today they face a number of internal struggles as they become a mature economy: A slowing GDP, an overbuilt housing sector, overpriced housing in core cities, non-performing debt issues, pollution … the list goes on. Alternatively, they’ve done an enviable job with factory and infrastructure construction and job creation. Externally, now they get to deal with our new President Trump. I’m expecting a lot of rhetoric and histrionics … but beyond the “border tax” resulting from new tax policy, I think not much will happen here in 2017. Our economies are simply too intertwined today for either side to push the other over the economic brink.
-
We have to talk about oil again. It’s fun! Interestingly, our US shale is now swing production. When prices fall…production falls…which causes prices to rise which cause production to rise…which causes prices to fall…etc. The Saudi Arabia-led production deal should hold…cheating notwithstanding…and Russia will also agree to output limits. WTI should stay in a trading range between the low 50s and we will finish 2017 at or near $60 a barrel.
-
We will see a military coup in Venezuela. The current government will be violently overthrown and the country will default on their national debt.
-
By the end of 2017, the Euro will cost less than one US dollar.
-
The EU will remain intact and continue to bump along the bottom of the chart, economically speaking, while the “Brexiting” UK will set the outer limits in both inflation (probably exceeding 3%) and GDP growth (probably sub-1%).
-
That said, I believe we will experience a few cliff hangers across the pond: Monte dei Paschi, an Italian bank founded in 1472 will continue to “fail” this year – meaning Italy will prop it up. Greece will finish 2017 as a member of the ECB, but the country’s finances are in tough shape. There will be plenty of drama…but no Greek Tragedy.
Good luck out there!
- Terry Liebman


4 Comments
I?¦m not positive where you are getting your info, however good topic. I needs to spend a while learning much more or understanding more. Thanks for excellent info I used to be on the lookout for this info for my mission.
[…] Back in January I shared my 2017 predictions with the world. Take another look: https://www.steakhouseindex.com/2017-forecast-the-future-is/ […]
Enjoyed every bit of your article.Really looking forward to read more. Really Great.
Thank you for sharing, I always learn something new from your posts.
http://museedesbeauxartsdepau.com/