6.24.20 – Positive Pecuniary Externalities

SHI 6.17.20 – The Beef Index
June 17, 2020
SHI 7.1.20 – Gone Fishing
July 1, 2020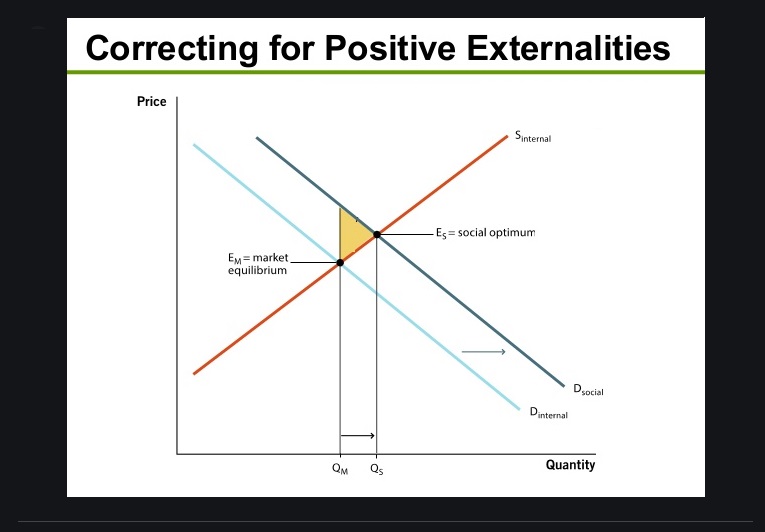
I enjoy reading dense, seemingly opaque, economic papers. Yeah, I know. I’m a bit odd.
Partially because I am intrigued by the topic, and sometimes because I’m tickled by the author’s use of words. Take the title of this week’s blog, for example. “Positive Pecuniary Externalities” is a phrase I clipped from a fascinating University of Chicago paper discussing the impact of the $600 weekly federal unemployment benefit paid under the CARES Act. Like me, I’m sure you’re asking
” What the heck does that mean? “
Well, if you Google the term, you will find this explanation: “A pecuniary externality occurs when the actions of an economic agent cause an increase or decrease in market prices.” Clear as mud, right? Let me try. The ‘economic agent’ here is the federal unemployment stimulus payment. In a nutshell, the author is suggesting the federal $600 ‘income replacement’ payment has beneficial financial results to both the recipients and the economy at large. Duh. But you sure as heck wouldn’t know that from the author’s words. Why can’t they use simple words?
Welcome to this week’s Steak House Index update.
If you are new to my blog, or you need a refresher on the SHI10, or its objective and methodology, I suggest you open and read the original BLOG: https://www.steakhouseindex.com/move-over-big-mac-index-here-comes-the-steak-house-index/
Why You Should Care: The US economy and US dollar are the bedrock of the world’s economy.
But is the US economy expanding or contracting?
Before COVID-19, the world’s annual GDP was about $85 trillion today. No longer. It will shrink thanks to ‘The Great Lockdown.’ I did not coin this phrase — the IMF did. The same folks who track global GDP. Until recently, annual US GDP exceeded $21.7 trillion. Again, no longer. But what has not changed is the fact that together, the U.S., the EU and China still generate about 70% of the global economic output.
The objective of this blog is singular.
It attempts to predict the direction of our GDP ahead of official economic releases. Historically, ‘personal consumption expenditures,’ or PCE, has been the largest component of US GDP growth — typically about 2/3 of all GDP growth. In fact, the majority of all GDP increases (or declines) usually results from (increases or decreases in) consumer spending. Consumer spending is clearly a critical financial metric. In all likelihood, the most important financial metric. The Steak House Index focuses right here … on the “consumer spending” metric. I intend the SHI10 is to be predictive, anticipating where the economy is going – not where it’s been.
Taking action: Keep up with this weekly BLOG update. Not only will we cover the SHI and SHI10, but we’ll explore related items of economic importance.
If the SHI10 index moves appreciably -– either showing massive improvement or significant declines –- indicating growing economic strength or a potential recession, we’ll discuss possible actions at that time.
The BLOG:
Early this morning, I ran past the Carls Jr on Coast Highway in Dana Point, California. I noticed a large poster in the front window advertising, “NOW HIRING — ALL POSITIONS.” How can this be, I thought? There must be hundreds of locals who are looking for work. Less than a week ago, I saw this image on the California EDD site:
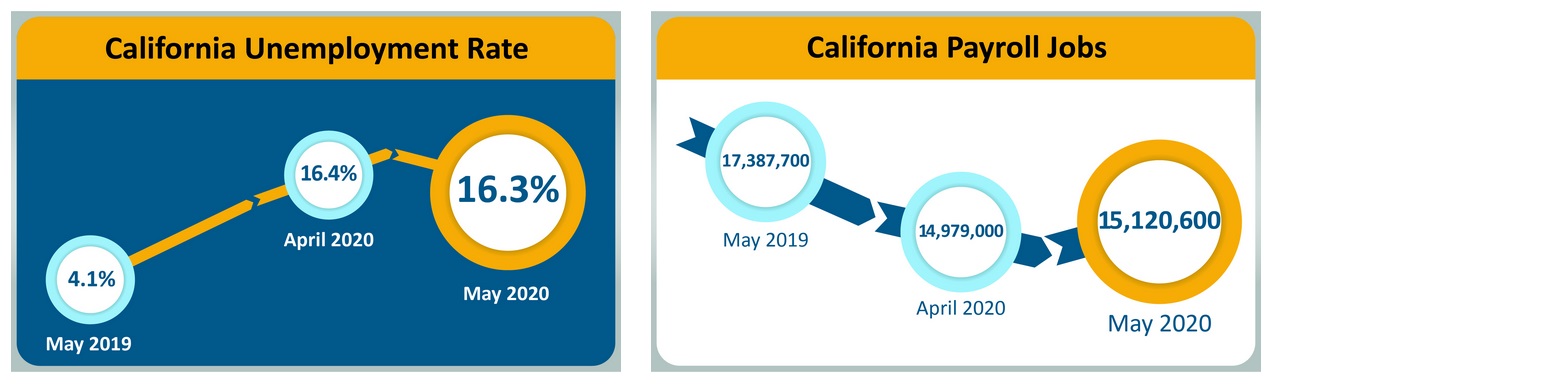
A year ago, the CA unemployment rate was 4.1% … and today it has spiked up to 16.3%. Here in California we have 2,267,100 more people unemployed — 12.2% of the labor force — than we did just one year ago. And yet Carls Jr is having trouble finding workers? How can that be? There must be TONS of workers looking for a job. It makes no sense that they are looking for employees for all positions. Does it?
Yes, it does. We all know almost every industry in the US has been crushed by the pandemic. Millions have lost jobs. But after a rough start, the vast majority of these unemployed folks began to receive both state- and federal-unemployment benefits — a fact supported by the massive surge in the ‘savings rate’ as I reported in last week’s blog.
I’m sure you’ve heard stories about a laid-off restaurant worker or janitor who is making MORE money while unemployed than when they were working. And perhaps, like me, you wondered if that was true … or just more fake news. Well, folks, it looks true…and I suspect this is why Carls Jr might be having trouble finding workers in Dana Point.
Three economists at the Becker Friedman Institute at the University of Chicago wrote a paper a few weeks ago. Entitled, “US Unemployment Insurance Replacement Rates During the Pandemic,” the authors directly addressed this issue. Their findings may surprise you. Because while in the aggregate, for all jobs lost in all work categories as a whole, the state/federal unemployment benefits did replace about 100% of the income lost, not all workers have experienced the same outcome. In fact, some “ex-workers,” laid off from jobs in specific professions, are “earning” quite a bit more than when they were employed:
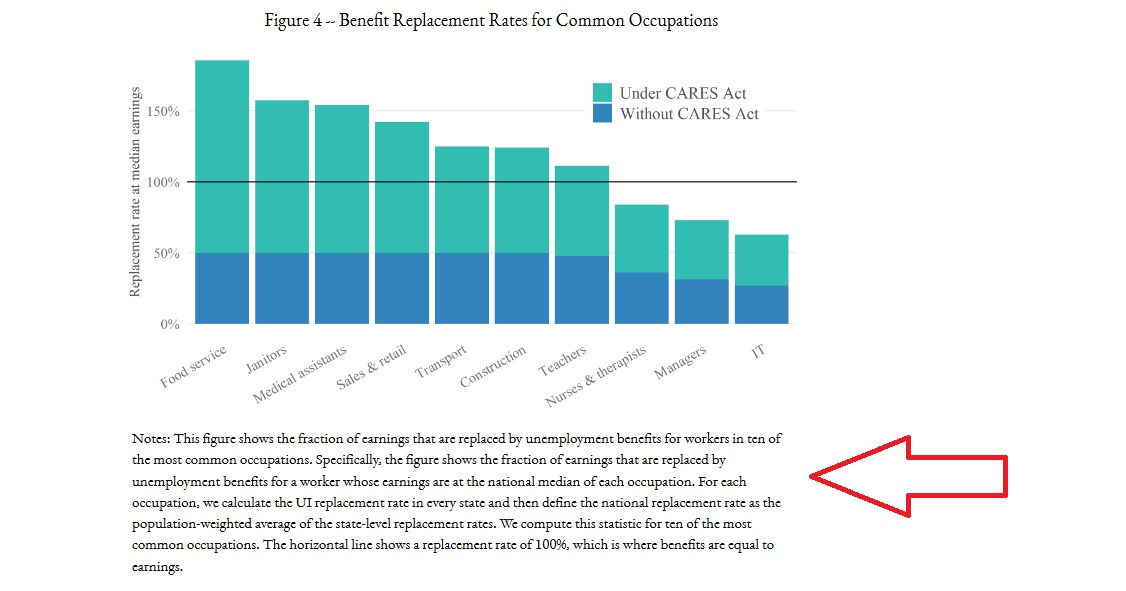
Folks who lost their jobs in ‘Food service’ today are taking home considerably more than when they were employed. The same is true for Janitors, Medical Assistants, people in Sales and Retail … etc. You get the picture. And while the authors’ language is fairly dense “econo-speak” it is worth a look:
“As designed, we find that the ratio of mean benefits to mean earnings in the data under CARES is roughly 100%. However, this masks substantial heterogeneity. We find that 68% of unemployed workers who are eligible for UI will receive benefits which exceed lost earnings. The median replacement rate is 134%, and one out of five eligible unemployed workers will receive benefits at least twice as large as their lost earnings. Thus, the CARES Act actually provides income expansion rather than replacement for most unemployed workers. We also show that there is sizable variation in the effects of the CARES Act across occupations and across states, with important distributional consequences. For example, the median retail worker who is laid-off can collect 142% of their prior wage in UI, while grocery workers are not receiving any automatic pay increases.Janitors working at businesses that remain open do not necessarily receive any hazard pay, while unemployed janitors who worked at businesses that shut down can collect 158% of their prior wage. These conclusions arise because the CARES Act sends a fixed $600 payment to unemployed workers who have very different prior earnings: $600 is a larger percentage of prior earnings for low than for high earners. Since the $600 UI payment was targeted to generate 100% earnings replacement based on mean earnings, this $600 payment tends to imply greater than 100% earnings replacement for those with less than mean earnings. Furthermore, these high replacement rates for below-mean workers are amplified by the fact that the distribution of earnings is skewed: median prior earnings are below mean prior earnings. This means that the typical unemployed worker has below-mean prior earnings and thus above-mean replacement rates. This implies that most workers have replacement rates above 100%.”
According to the authors, 68% of the newly unemployed are taking home more money than when they were employed. On the other hand, when these folks lost their jobs, they probably lost their medical insurance benefits too.
Above we see how the CARES Act supplemental support played across industry types. How do state-by-state differences look?
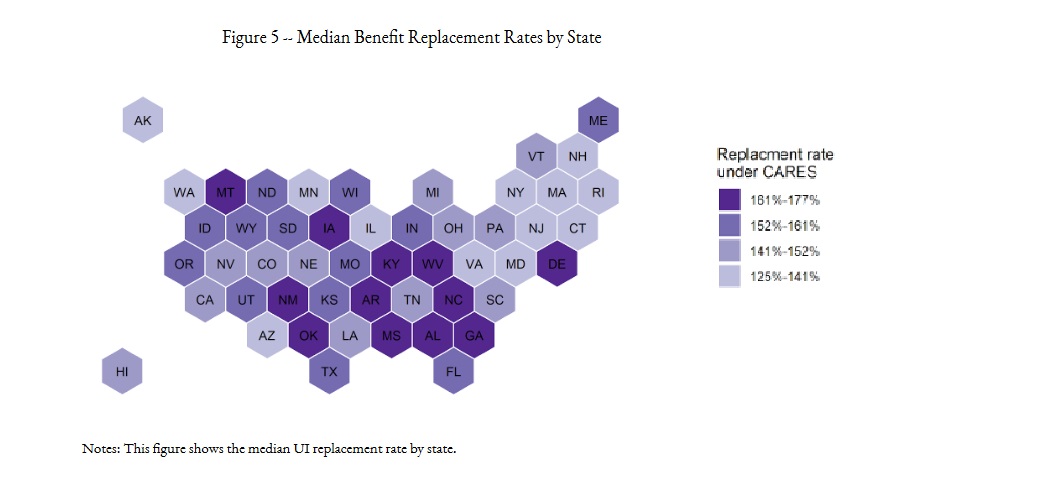
It appears that the newly unemployed in the South received the largest weekly income increase, suggesting, conversely, that most of the lower paying jobs are also in this region. California appears to be in the “141% – 152%” group. Thus, in the aggregate, across the state of California, the newly unemployed are now receiving about 150% of their prior compensation in weekly unemployment benefits.
Which brings us back full circle to the plight of Carls Jr. They need employees. With a state unemployment rate of 16%, you might think finding workers would be easy, but if a qualified ‘Food services’ worker is earning 150% of their wage while staying home and watching Netflix, a new job with a “pay cut” may not look overly attractive. How does Carls Jr. compete with that?
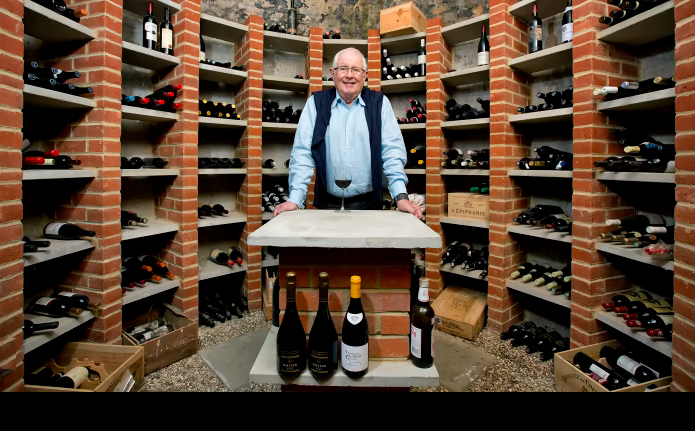
While Carls Jr may not serve high-priced steaks like our friends at Mastros and Ruths Chris, I suspect high-end restaurants may find the similar challenges as they open up their restaurants across California and the US. Which begs the question: Are the SHI restaurants opening? Well, yes and no. For the first time in over 3-months, I “pulled” the SHI10 data. Here’s what I found:
- Two (2) of our forty (40) restaurants have permanently closed.
- Eight (8) are closed for ‘dine-in’ service … but are operating for pick-up and take-out.
- Thirty (30) are open, taking reservations, and operating.
Those that are operating appear quite busy. In fact, comparing pre-COVID reservation demand in the open eateries to demand for this Saturday, we see very little difference:
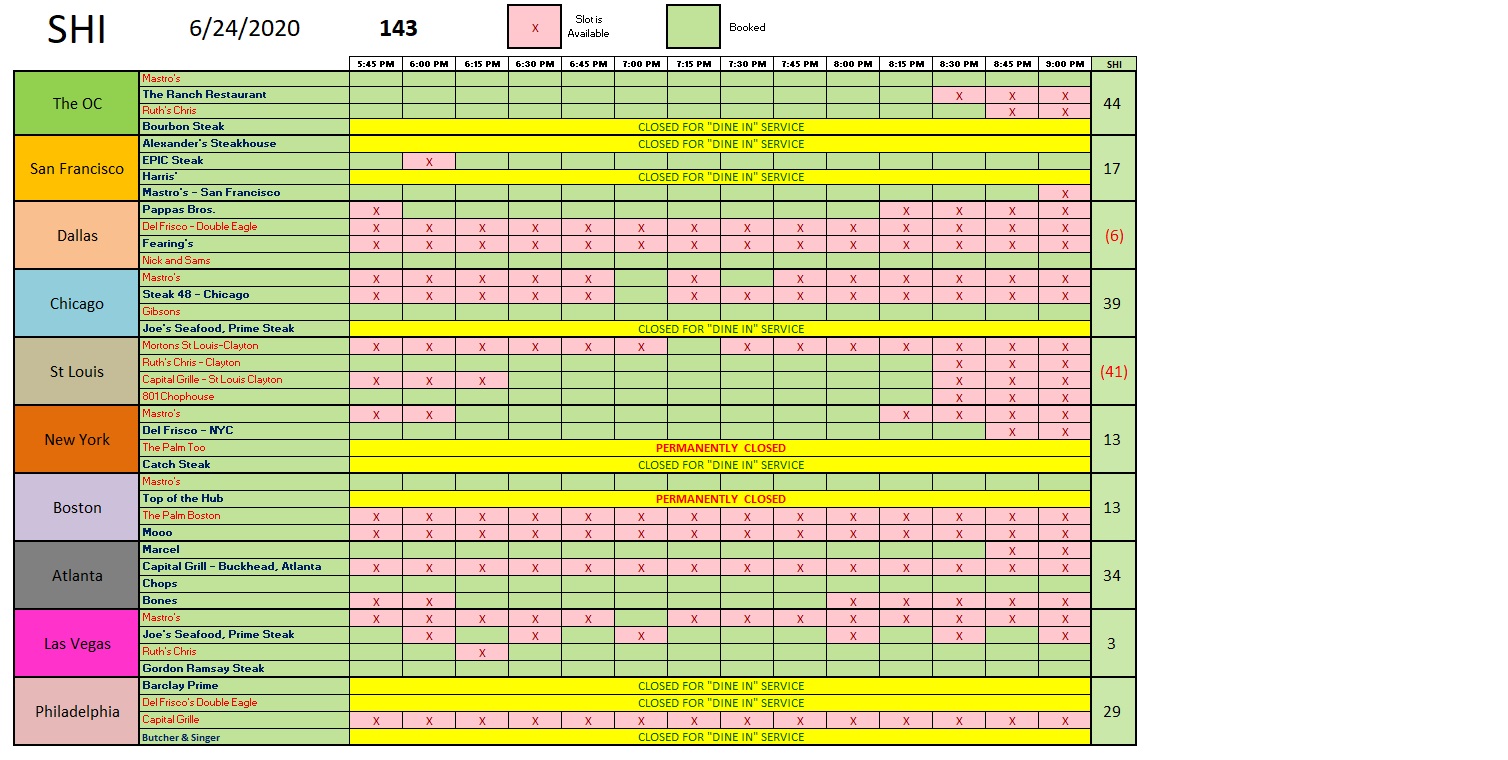
But something is probably different today: Diner density. I suspect most of our SHI10 restaurants have removed tables to permit requisite social distancing. If diner density is about 40 – 50% lower, then a fully booked restaurant today is much different than from 2019. At the top of the chart above, we see that ‘Mastros Ocean Club’ is once again fully booked. But how does the number of tables available today compare to those available in January? This unknown, and the clear data inconsistency, renders any comparison to prior SHI10 data meaningless. Of course, it is interesting to see how quickly our SHI restaurants have attracted well-heeled diners — a plus for the restaurant and the economy at large.
Further, there will come a time when our expensive eateries will once again operate at full capacity, most likely after a vaccine is widely distributed. So any data we accumulate today at, say, half-full will not meaningfully compare to the restaurant reservation demand when full capacity is restored.
Reservation demand is strong — surprisingly strong. Are more affluent folks been less impacted by COVID-19 caused job losses and economic hardships? This data would suggest the answer is yes. And given the difficult my local Carls Jr is having finding employees, perhaps our SHI restaurants are fortunate they are not looking to hire a full staff today. Another challenge our SHI eateries face is profitability. Operating a restaurant — even a high-priced steakhouse — is an expensive proposition with many fixed overhead costs, such as rent, management, salaries, equipment rentals/leases, debt payments, etc. These costs do not typically decline based on capacity or demand. So even with full reservation demand and occupancy at a 60% capacity, many restaurants will be challenged to make a profit. Which may be one reason why two of our SHI eateries are now permanently closed.
Crazy times. On one hand, it appears the US economy is, well, recovering somewhat. With help from the FED and the US Treasury. But make no mistake, many obstacles remain in our economic path — both known and unknown. The June of 2020 “World Economic Outlook Update” from the International Monetary Fund (IMF) said it best. Here and abroad, we are facing “A Crisis Like No Other” and “An Uncertain Recovery.” Agreed.
(Want to read the IMF update? Here’s a link: https://www.imf.org/en/Publications/WEO/Issues/2020/06/24/WEOUpdateJune2020?cid=em-COM-123-41754 )
– Terry Liebman