SHI 10.9.19 – Cracks in the Foundation

SHI 10.2.19 – Chew on This, Beyond Meat!
October 2, 2019
SHI 10.16.19 – The FED Loads up on T-Bills
October 16, 2019
“We have cracks in the foundation of the US economy.”
That’s the bad news. The good news is the cracks don’t seem to be spreading … or getting larger. And if some are spreading or growing, at least the rate of change is slow.
Welcome to this week’s Steak House Index update.
If you are new to my blog, or you need a refresher on the SHI10, or its objective and methodology, I suggest you open and read the original BLOG: https://www.steakhouseindex.com/move-over-big-mac-index-here-comes-the-steak-house-index/
Why You Should Care: The US economy and US dollar are the bedrock of the world’s economy. This has been the case for decades … and will be true for years to come.
But is the US economy expanding or contracting?
According to the IMF (the ‘International Monetary Fund’), the world’s annual GDP is about $85 trillion today. US ‘current dollar’ GDP now exceeds $21.3 trillion. In Q2 of 2019, nominal GDP grew by 4.7%. The US still produces about 25% of global GDP. Other than China — in a distant ‘second place’ at around $13 trillion — the GDP of no other country is close. The GDP output of the 28 countries of the European Union collectively approximates US GDP. So, together, the U.S., the EU and China generate about 70% of the global economic output.
The objective of the SHI10 and this blog is simple: To predict US GDP movement ahead of official economic releases.
Historically, ‘personal consumption expenditures,’ or PCE, has been the largest component of US GDP growth — typically about 2/3 of all GDP growth. In fact, the majority of all GDP increases (or declines) usually results from (increases or decreases in) consumer spending. Consumer spending is clearly a critical financial metric. In all likelihood, the most important financial metric. The Steak House Index focuses right here … on the “consumer spending” metric. I intend the SHI10 is to be predictive, anticipating where the economy is going – not where it’s been.
Taking action: Keep up with this weekly BLOG update. Not only will we cover the SHI and SHI10, but we’ll explore related items of economic importance.
If the SHI10 index moves appreciably -– either showing massive improvement or significant declines –- indicating growing economic strength or a potential recession, we’ll discuss possible actions at that time.
The BLOG:
Once again, the US consumer is carrying the economy on their shoulders.
Consumer spending has always been a critically important component in the US GDP growth picture. And that fact has never been more important than today. Especially as ‘consumer confidence’ — by all measures — is also seeing cracks form in its foundation.
About 10 days ago, the Bureau of Economic Analysis (BEA) released an update entitled, “Personal Income and Outlays, August 2019.” In that report, among other things, they shared this chart:
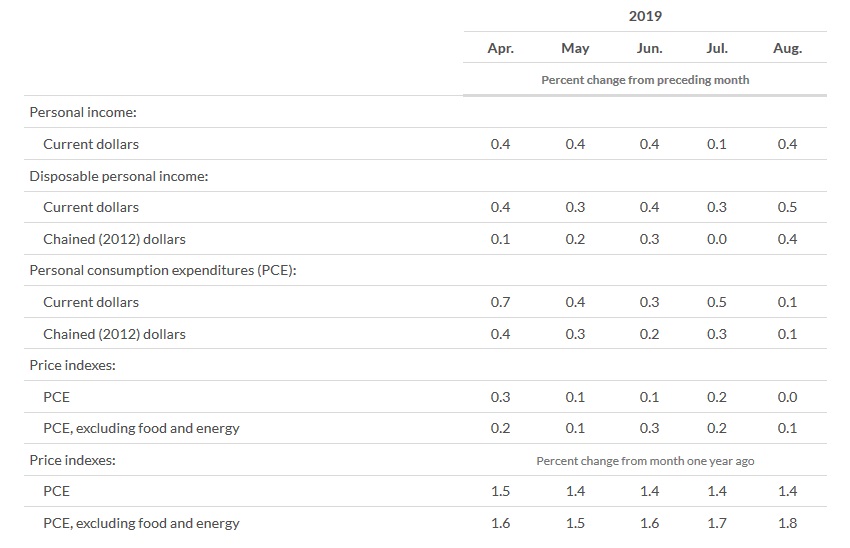
This image is chock-full of great data … but for now focus on the line “Personal consumption expenditures.” The past 5 month’s readings appear here. Back in April, consumers were spending at a pretty good clip. But in every month from April to August, the rate by which spending has grown slipped. And in August, it was almost unchanged — only a 0.1% increase. At the same time, we see that the PCE price index continues its sub-2.00% (YOY) performance … and in month of August, the PCE was actually zero. Flat. No inflation. Zero.
These are the cracks in the consumer spending foundation.
It is likely they have formed as a result of the languishing trade wars and the resultant declines in consumer confidence. Another small crack seems to have appeared in the consumer debt picture. Remember: Every consumer purchase is not made with cash. Quite the opposite. Most purchases are financed. Whether by credit card, auto loan, etc., the consumer typically finances most consumption activity. Which begs the question, “How does the consumer charge-off and delinquency rate look these days?”
Well, simply said, it’s a tiny bit worse that before. In a financial release called “Charge-Off and Delinquency Rates on Loans and Leases at Commercial Banks” we see the delinquency rate for all consumer loans has increased. In Q2 of 2019 the rate was 2.35%. One year before, the rate was 2.26. While this is not a significant change, the delinquency rate has steadily become worse since striking a low of 1.98% at the end of Q2, 2015. Here’s the raw data: https://www.federalreserve.gov/releases/chargeoff/delallsa.htm Check out the peak delinquency rate back in 2008. Interesting.
On the other hand, exceptionally low interest rates have kept the growing consumer debt load from becoming too much of a burden. The FED also tracks data on the “household debt service and financial services ratios.” Their last data release was on September 25th. What is a household debt service ratio of financial services ratio. Here are the definitions, provided by the FED:
- The Financial Obligations Ratio is a broader measure than the Debt Service Ratio. It includes rent payments on tenant-occupied property, auto lease payments, homeowners’ insurance, and property tax payments.
- The household Debt Service Ratio (DSR) is the ratio of total required household debt payments to total disposable income. The DSR is divided into two parts. The Mortgage DSR is total quarterly required mortgage payments divided by total quarterly disposable personal income. The Consumer DSR is total quarterly scheduled consumer debt payments divided by total quarterly disposable personal income. The Mortgage DSR and the Consumer DSR sum to the DSR.
OK, that’s fairly clear and straight-forward. If the consumer was stressed and beginning to default due to mountains of expensive debt, then these ratios would be increasing. If the ratios were decreasing, the opposite would be true. And if the ratios are relatively flat, then not much has changed. Looking at the data, we see the latter — not much has changed:
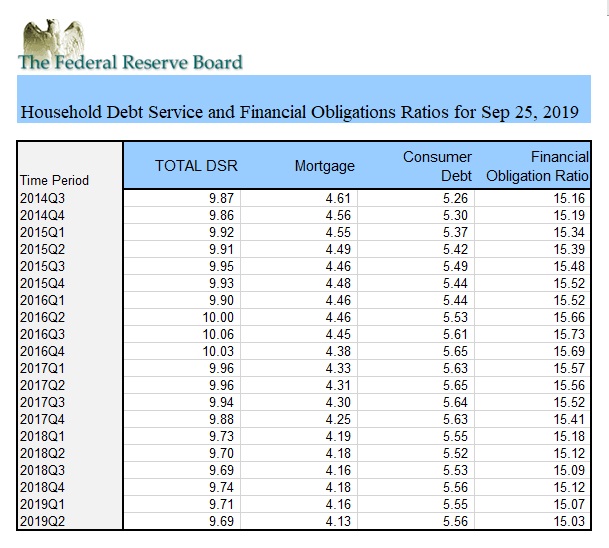
All ratios are flat, to somewhat lower. The bottom line: Any changes in consumer behavior is more likely to be due to psychological stress as opposed to financial stress.
And with that comment, I think we could all use a glass of 1982 Domaine de la Romanee Conti ‘La Tache.’ Let’s head to the steak houses.
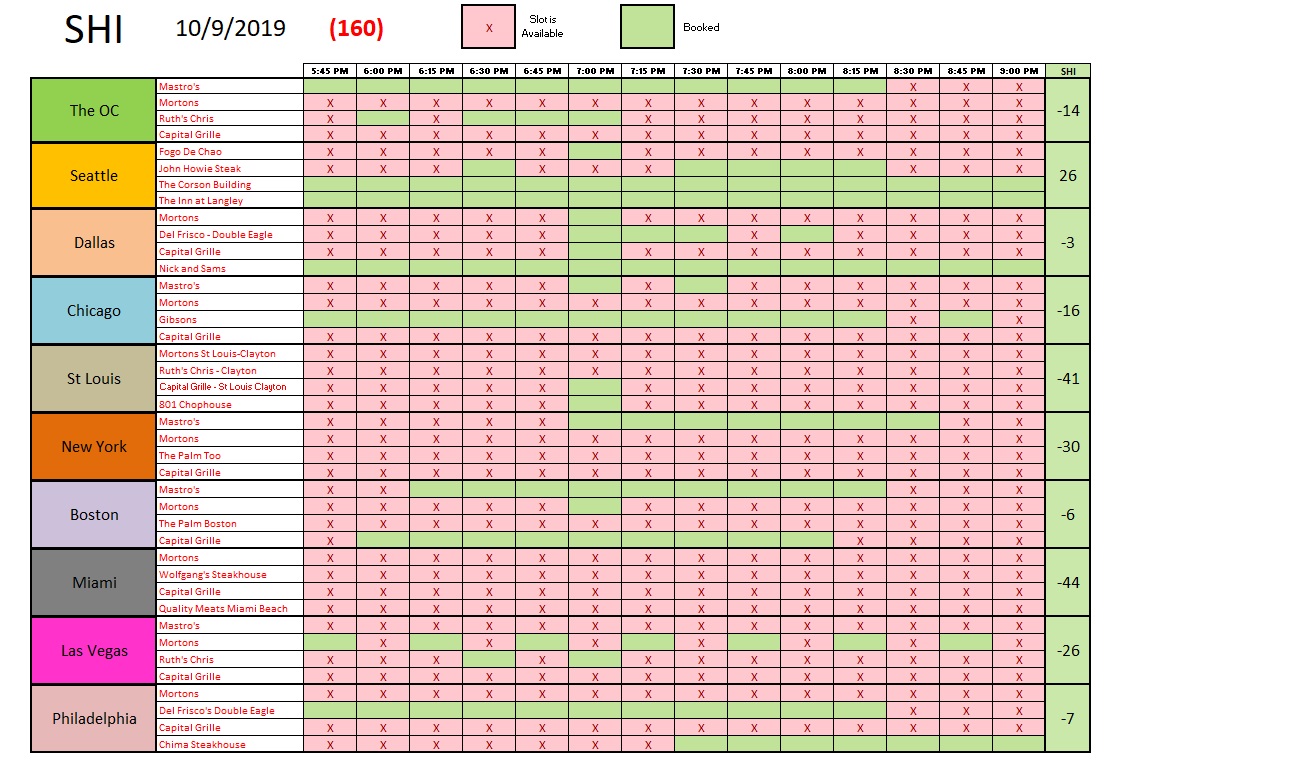
Like the consumer DCR discussed above, this week’s SHI10 is holding up pretty well. Make no mistake, with a reading of negative <160>, reservations and flat-iron steaks are not exactly flying off the griddle, but as you’ll see below, by historic standards this is not a bad reading. From the activity seen above, it’s clear Miami is back in the “steak doghouse” showing local consumers have absolutely no interest in an expensive slab of beef this weekend. St Louis isn’t doing much better. The other 8 markets are showing fairly consistent, if not low levels, of reservation demand. Here’s our trend report:
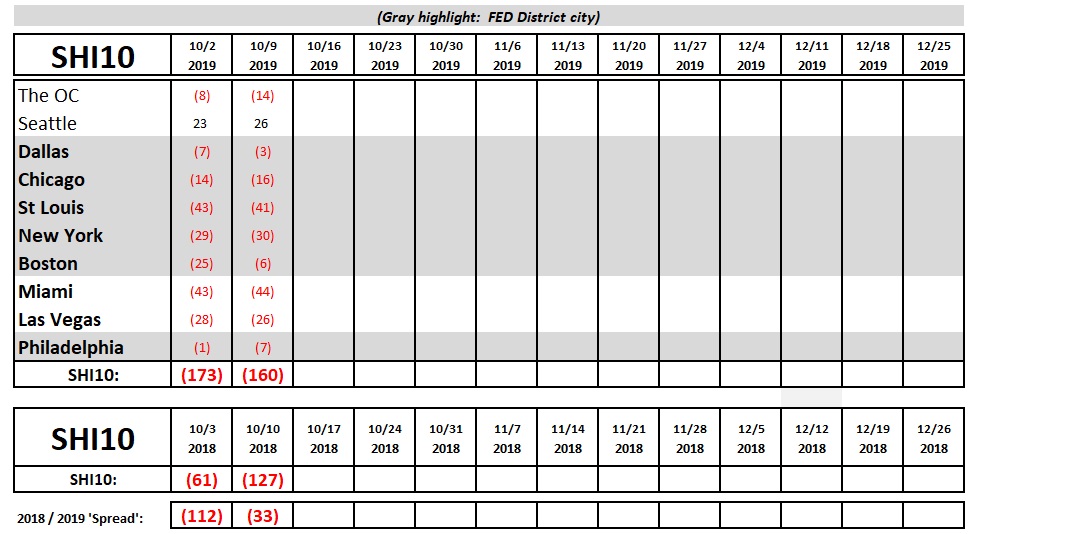
It’s been a few months since the ‘spread’ between this week in 2018 and 2019 had such a small gap. It’s probably just a one-week aberration, but interesting nonetheless.
By our metric, consumer demand and consumption seems to be a bit weaker, but fairly steady. The cracks are there … and they are meaningful as time passes. I’ll repeat my fairly consistent message: Absent a resolution of the current trade wars by the end of November, I believe the pressures on the consumer and businesses will grow to an overwhelming level. When that tipping point is reached, the US economic activity will cycle lower and lower … eventually forcing our economy into a recession.
We’re not there yet. The cracks are clear … but we’re not there yet. Enjoy your steak!
– Terry Liebman