SHI 12/13/17: Another Look at GDP

SHI 12/6/17: Flirting with Inverting
December 6, 2017
SHI 12/20/17: Tis the Season
December 19, 2017
US GDP is the sum of 4 components.
You may recall the below image from past blog posts:
Historically, growth in PCE has been, by a wide margin, the largest contributor to US GDP. In fact, in 2016, GDP growth for the entire year was 1.50% over the prior year … and PCE contributed 124% of that amount since ‘private investment’ and ‘exports’ were both negative for the year! But in the latest calendar quarter — Q3 of 2017 — PCE contributed less than 1/2 the total. By historic metrics, this is very unusual.
Could our economy be shifting away from a consumption-based economy?
Welcome to this week’s Steak House Index update.
If you are new to my blog, or you need a refresher on the SHI, or its objective and methodology, I suggest you open and read the original BLOG: https://www.steakhouseindex.com/move-over-big-mac-index-here-comes-the-steak-house-index/
Why You Should Care: The US economy and US dollar are the bedrock of the world’s economy. This has been the case for decades … and will continue to be true for years to come.
Is the US economy expanding or contracting?
According to the IMF (the ‘International Monetary Fund’), the world’s annual GDP is almost $80 trillion today.
At last count, US ‘current dollar’ GDP is about $19.5 trillion — about 25% of the global total. Other than China — a distant second at around $11 trillion — no other country is close.
The objective of the SHI and this blog is simple: To predict US GDP movement ahead of official economic releases — an important objective since BEA (the ‘Bureau of Economic Analysis’) gross domestic product data is outdated the day it’s released.
Historically, ‘personal consumption expenditures,’ or PCE, has been the largest component of US GDP growth — typically about 2/3 of the total. In fact, the majority of all US GDP increases (or declines) usually result from (increases or decreases in) consumer spending. This is clearly an important metric. The Steak House Index focuses right here … on the “consumer spending” metric.
I intend the SHI is to be predictive, anticipating where the economy is going – not where it’s been. Thereby giving us the ability to take action early.
Taking action: Keep up with this weekly BLOG update. Not only will we cover the SHI, but we’ll explore related items of economic importance.
If the SHI index moves appreciably -– either showing massive improvement or significant declines –- indicating growing economic strength or a potential recession, we’ll discuss possible actions at that time.
The BLOG:
GDP is the sum of 4 components:
- PCE or ‘personal consumption expenditures.’ This, you recall, is the foundation of the SHI. PCE accounts for the ‘goods’ and the ‘services’ we all buy, in the aggregate, every day.
- ‘Private Investment’ represents the money US citizens and businesses spent for both ‘residential’ property and ‘non-residential’ structures, equipment and IP products.
- ‘Net Exports’ nets out exports from the US to the rest of the world, against the imports we bring in, such as cars from Germany.
- ‘Government Consumption’ is the sum of federal, state and local spending, of course, by the government.
All four of these metrics are measured constantly by the Bureau of Economic Analysis, or BEA. Here is a chart I’ve compiled from actual reported BEA numbers:
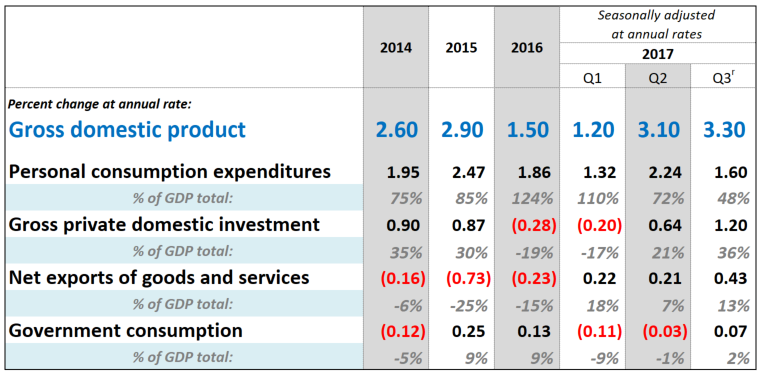
The four components of GDP growth appear in black text. The lighter gray text — below each component — shows the relative value of that component to total growth. As a percentage. For example, we see that in Q3 2017 PCE equaled 48% of the 3.3% GDP growth for the quarter. And private investment equaled 36% of the total.
Is PCE diminishing in importance? No. Remember: the numbers in gray reflect growth — not the absolute number. Let me say this another way: During the 3rd quarter of this year, our GDP grew to an annualized run rate of $19.509 trillion. Of this total, PCE contributed $13.435 trillion. ‘Private investment’ contributed $3.25 trillion. A tidy sum to be sure, but far less that 1/4 of the PCE contribution.
When I dive deeper into the 14 line items that make up ‘private investment’ I see that year-over-year, every line item reflects a meaningful increase over 2016. Could this be the result of greater business confidence or reduced regulation? Probably both; regardless, ‘private investment’ is showing improvement. And, by extension, so is productivity.
But rest assured, PCE is still the darling of our economy. Do the math: PCE remains about 69% of our total economy. ‘Private investment’ is definitely helping GDP growth — as are ‘net exports’ — but PCE remains the workhorse. Which is why the SHI remains so important as a leading indicator for GDP growth.
Beginning with our first blog post January, we will expand the SHI to include a total of ten (10) major US cities. In addition to Orange County, we will add four (4) expensive eateries in each of these cities:
- Seattle
- Dallas
- Chicago
- New York
- Boston
- Miami
- St Louis
- Las Vegas
- Philadelphia
In some cities, the SHI will track some of the same restaurants as we do here in ‘the OC.’ In Las Vegas, the restaurant set is identical … and we’ve included ‘Vegas’ because it represents the ‘poster-board’ of discretionary consumer consumption.
Future SHI methodology will remain identical to current methodology. But shortly, the SHI will have a nationwide footprint. I will be retooling the blog images…since we’ll be adding quite a bit more data in the SHI analysis across the 10 geographic markets. So stay tuned for that.
Foundationally, I continue to believe the SHI has predictive value. The simple fact is about 70% of US GDP is driven by consumer spending. ‘Steakonomics’ theory is based on the belief that consumers spend their hard earned (and borrowed) funds for both ‘need’ and ‘desire.’ Human need include food, shelter and clothing. Desire, or ‘want,’ is completely discretionary. Meaning that the quantity discretionary spending will ebb and flow based on the consumer’s “feeling” about how current conditions impact or affect them. And by how that consumer feels the future is shaping up: Does the future look bright? Or am I worried…and limiting my spending choices?
These feelings impact spending choices, spending patterns, and ultimately how many steaks Mastros sells on Saturday night. Consumer feelings and beliefs drive discretionary consumer spending. And there’s nothing more discretionary than a $150 steak dinner! That consumer is feeling pretty darn good about his or her personal current and future economic conditions! And this is the foundation of the SHI and ‘Steakonomics.’ Discretionary consumer spending behavior drives the PCE component of GDP growth, and for this reason, the SHI is a meaningful proxy and barometer for PCE. And now, with our new nationwide platform, I expect the SHI to offer even greater predictive value.
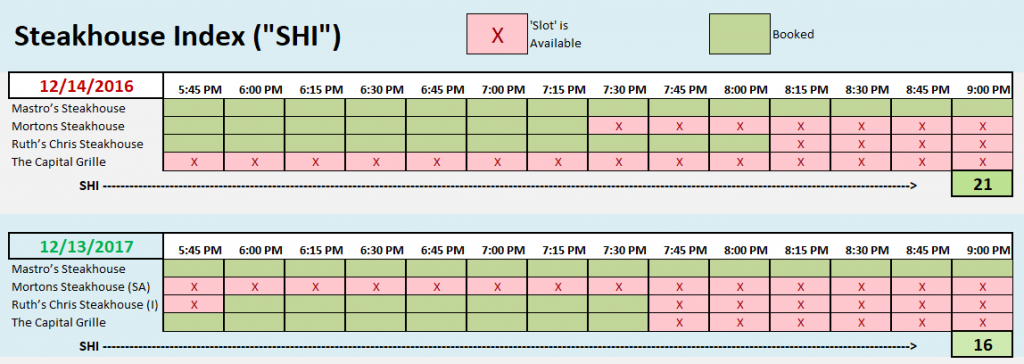
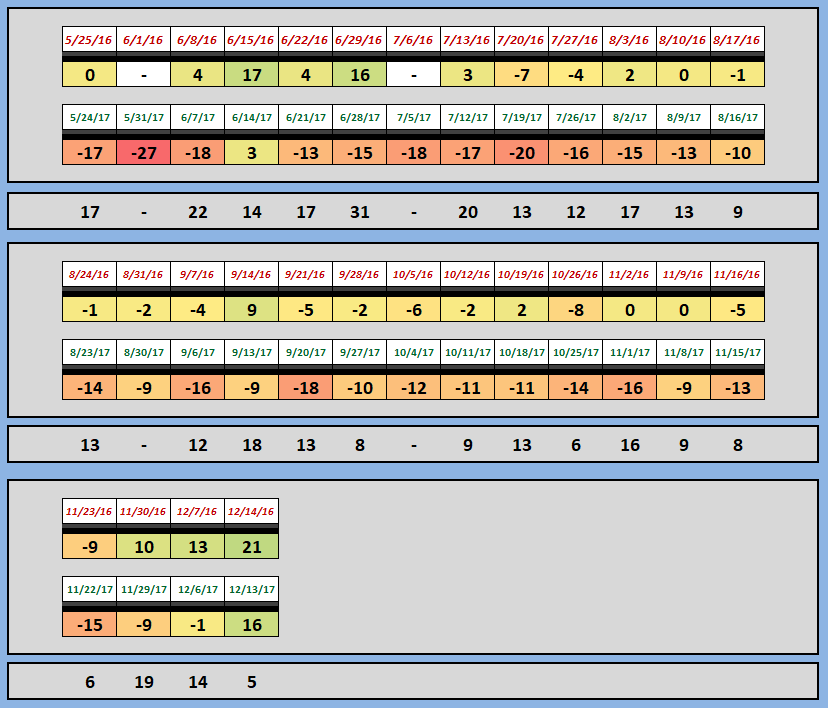
In the interim, let’s take a look at the ‘old’ SHI steakhouses and see how our Orange County highfalutin carnivores are feeling about the economy.
GADZOOKS!
Check this out: The Capital Grille is completely booked until 7:45! Be still my heart! The CG has even beat Ruths’ Chris this week … wow. Happy Holidays, Capital Grille! This week the SHI is a positive 16 — far and away the highest reading we’ve seen in months. And almost as good as the same week last year.
Here is the longer term trend chart:
As expected, the FED raised rates today. The Federal Funds rate is now 1.50%. The 10-year Treasury is currently trading at 2.36%. The 3-month is trading at 1.31% … suggesting the curve retains its positive slope with a difference over 1%. No recession risk here.
Full speed ahead!
– Terry Liebman