SHI 2.17.21: Baskets Full of Data

SHI 2.10.21 – Inflation Hide and Seek
February 10, 2021
SHI 2.24.21: Our Rates are Rising!
February 24, 2021
We have more economic data than fish in the ocean.
Tons of data. But unlike the sardines in the photo above, the data is inconsistent. In fact, for that reason, I’m struggling to form a strong opinion about the near-term prospects for inflation.
But not for US GDP. I am confident 2021 GDP growth will be staggeringly good.
For example, consider today’s consumer spending numbers — retail sales — just released by the US Commerce Department. “Retail and food services sales” for January of 2021 spiked by 5.3% over the prior month. Electronics sales skyrocketed by 14.7%! Furniture sales jumped by 12%! Wow … these are numbers you might typically see over a full year …. not one month! I’ll be shocked if 2021 GDP growth doesn’t exceed 6%. Or more. In fact, the 2021 expansion rate may surpass that of China. They may be the ‘Roaring Panda,’ but this year US economic growth is likely to surpass the Roaring Panda … making our economy the new ‘Roaring Kitty’. Step aside, Keith Gill. 🙂
As discussed below, the $4 trillion increase in M2 will most assuredly spur economic growth. Additional stimulus will simply add more fuel to the economic fire via consumer spending. Remember, about 70% of US GDP growth is the result of consumer spending. Have no fear: 2021 GDP growth will likely set a new high-water mark record. ‘Nuff said.
But the inflation picture is murky. Earlier today, the BEA released its “Producer Price Indexes” report for January. They reported that the ‘Producer Price Index for final demand’ increased 1.3 percent in January. And the BEA added this interesting tidbit:
“This advance is the largest since the index began in December 2009.”
And then we have to consider growth in money supply. One year ago, M2 was about $15.4 trillion. With figures updated on February 11th, less than one week ago, M2 now tops $19.4 trillion — an increase of almost 26%. This increase corresponds with the current unprecedented level of assets on the FEDs balance sheet — also updates on 2/11 — which now eclipses $7.44 trillion.
That’s a lot of sardines. Does this kettle of fish smell inflationary? You bet it does.
Imagine the smell if the US adds another $1.9 trillion into the fish baskets? It smells like a huge economic expansion!
But it also smells like inflation to me. Treasury investors agree: The 10-year yield is hovering near 1.3% today — up more than 1/3% in the past few weeks. And yet, oddly enough, the price of the one asset most often used to hedge against inflation — gold — has fallen thru the floor. Hmmm….
“
GDP growth will set a record in 2021.“
“GDP growth will set a record in 2021.“
Economically speaking, these are turbulent times. I personally feel 2021 GDP growth is highly predictable, and while I harbor growing concern about near-term inflation rates, the FED remains calm. They assure us inflation rates remain low. And under control. Hmmm…..
Welcome to this week’s Steak House Index update.
If you are new to my blog, or you need a refresher on the SHI10, or its objective and methodology, I suggest you open and read the original BLOG: https://www.steakhouseindex.com/move-over-big-mac-index-here-comes-the-steak-house-index/
Why You Should Care: The US economy and US dollar are the bedrock of the world’s economy.
But is the US economy expanding or contracting?
Before COVID-19, the world’s annual GDP was collectively about $85 trillion. Then it shrank … then bounced back! We can thank global fiscal and monetary policy for the bounce. According the the Q3, 2020 ‘preliminary’ numbers, annual US GDP is back UP to about $21.1 trillion. And still, together, the U.S., the EU and China continue to generate about 70% of the global economic output.
The objective of this blog is singular.
It attempts to predict the direction of our GDP ahead of official economic releases. Historically, ‘personal consumption expenditures,’ or PCE, has been the largest component of US GDP growth — typically about 2/3 of all GDP growth. In fact, the majority of all GDP increases (or declines) usually results from (increases or decreases in) consumer spending. Consumer spending is clearly a critical financial metric. In all likelihood, the most important financial metric. The Steak House Index focuses right here … on the “consumer spending” metric. I intend the SHI10 is to be predictive, anticipating where the economy is going – not where it’s been.
Taking action: Keep up with this weekly BLOG update. Not only will we cover the SHI and SHI10, but we’ll explore related items of economic importance.
If the SHI10 index moves appreciably -– either showing massive improvement or significant declines –- indicating growing economic strength or a potential recession, we’ll discuss possible actions at that time.
The Blog:
Per the January 26-27 FED meeting minutes, the FED remains concerned about elevated levels of US employment:
“While labor market conditions had improved significantly, on balance, since the spring, if the sizable number of workers who reported having left the labor force since the beginning of the pandemic were to be counted as unemployed, the unemployment rate would be substantially higher. Participants judged that the current low level of labor force participation likely reflected a number of factors, including health concerns and additional childcare responsibilities.”
This comment is supported by the fact that payroll employment in January was down 9.6 million year-over-year (YOY), with 10.1 million people still unemployed — 4.3 million more than at the start of 2020. And the size of the labor force shrunk by 4.3 million from a year ago with women accounting for 58% of the decline. Likely, many had to quit jobs to care for children whose schools were operating online only.
Thru the ’employment lens’ its not surprising the FED is supportive of additional fiscal stimulus from the Biden administration:
“Most participants expected that the stimulus provided by the passage of the CAA in December, the likelihood of additional fiscal support, and anticipated continued progress in vaccinations would lead to a sizable boost in economic activity. Even so, participants noted that economic activity and employment were currently well below levels consistent with achieving maximum employment.”
No doubt: An additional $1.9 trillion will invigorate the economy and spur additional hiring. But will the recipients spend the money?
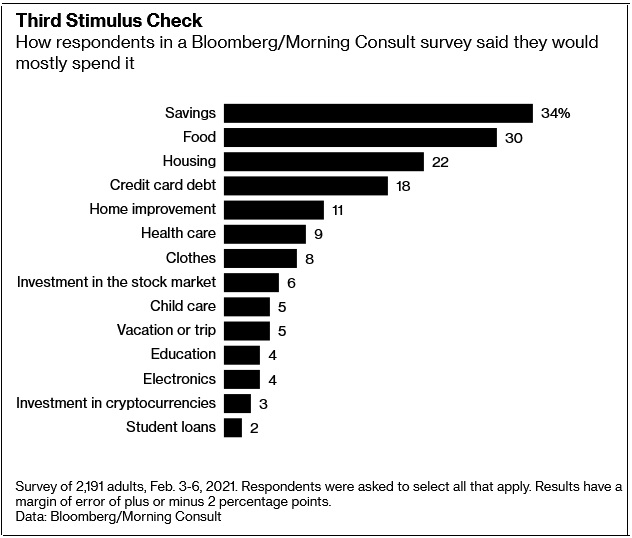
A great question. Bloomberg recently sponsored a survey, asking 2,191 adults “What do you plan to do with your $1,400 from the Treasury?”
More than 1/3 said they will save much of it. That compares with 23% who said they did so in April last year, when the government sent out $1,200 checks under the Cares Act, and 26% of those who got the $600 checks Congress approved in late December.
Interesting.
Of course, the vast majority of the respondents plan to spend more than half their money on food and housing. And did you notice that 3% plan to “invest” in cryptocurrencies? 🙂
Another 6% plan to invest in the stock market. Perhaps they should reconsider and invest in “collectable” sports cards instead.
In early February, a Michael Jordan rookie basketball card in pristine condition sold for a record $738,000 at auction. The exact same item sold for nearly $215,000 just weeks before. We’re seeing similar value increases across this asset class. Yet, while collectable sport-card values are skyrocketing, according to the Hagerty Ferrari Index, the value of vintage Ferrari’s is not. At best, it has held steady thru the pandemic:
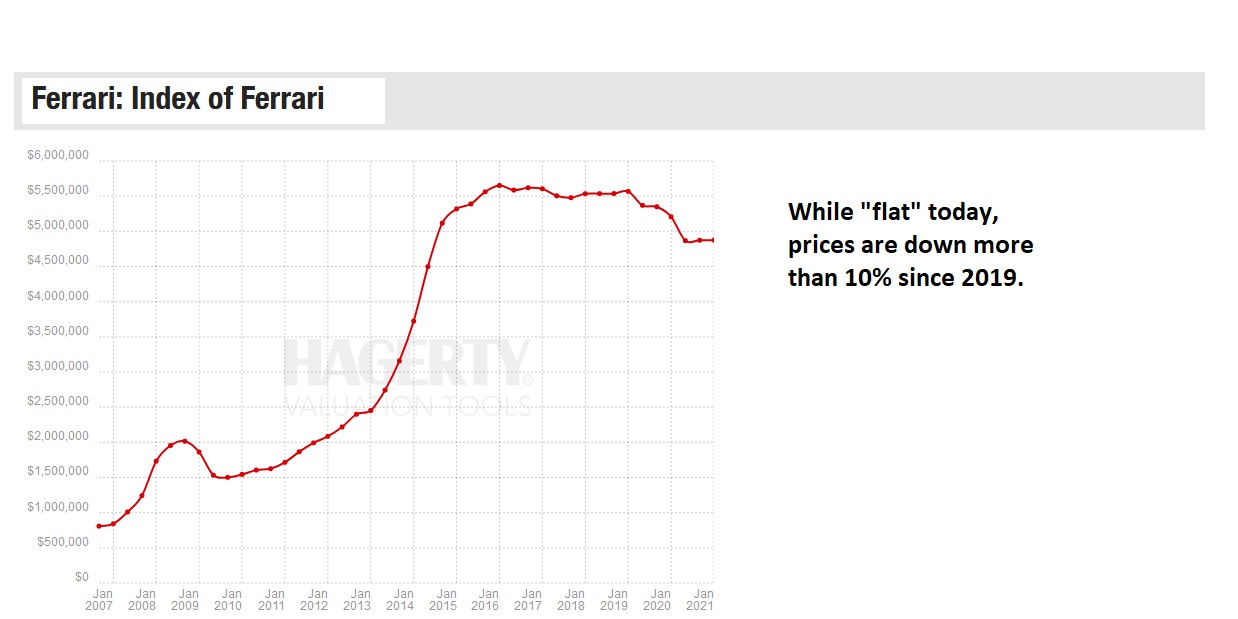
But remember, “asset inflation” is not synonymous with “consumer price inflation.” Sure, over time, asset price increases do bleed into consumer prices. Consider home prices. But there is no direct correlation. Investment asset prices can, and will, rise over time along side with money supply growth. But consumer prices may not follow suit.
When discussing inflation, gold requires a mention. Especially when it’s behaving oddly. As it is right now.
According to Forbes magazine, gold is a classic hedge against inflation:
“During America’s worst inflationary period, 1968-1982, the Consumer Price Index rose an average of 7.3% per year, while gold gained 17.1% per year.”
Unfortunately, like a lot of statistics, this one is misleading. Remember what Twain said, “There are three kinds of lies: lies, damned lies, and statistics.”
Correct. Because a funny thing happened between 1968 and 1982: In 1971 then President Nixon removed the US from the gold standard. No longer was the dollar backed by gold. As a result, the price of gold surged. That the surge accompanied the longest and largest CPI increase in US history was uncorrelated.
The magazine, to their credit, did add, “That sounds pretty good, but the four years of inflation from 1988 through 1992 saw a fall in gold of 5.1% per year, while prices rose 4.6% per year.”
Right. Regardless, in the past few decades the gold price and inflation rate have been fairly consistently joined at the hip. Thru this lens, it’s hard to reconcile recent per-oz gold prices declines in light of the massive M2 growth. Here is the latest:
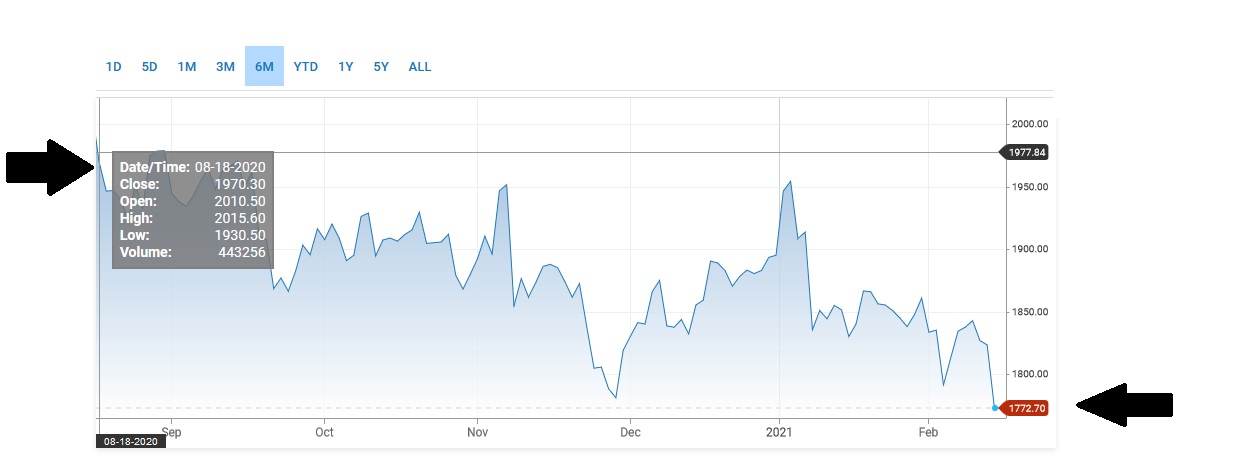
Only 6 months ago, gold price was over $2,000 per oz. Today, its value is more than 10% lower, hovering near $1,770 per oz. Again, odd. But the FED agrees with gold investors. They insist inflation isn’t a problem.
Again, from the minutes of the January 26-27 FED meeting:
“Inflation was projected to gradually edge up to 2% by the end of the medium term as labor and product markets tightened. With monetary policy assumed to remain accommodative, inflation was projected to moderately overshoot 2% for some time in the years beyond 2023.”
2023? That’s 2 years from now!
The FED differentiates between a one-time or short-term “change in prices” resulting from fiscal stimuli as a very different thing from a structural increase in well-grounded inflation expectations.
They believe we’re seeing the former … not the latter. Perhaps.
But, as I said above, while every American will not participate equally in this year’s explosive economic expansion, I believe a post-pandemic and post-vaccinated American will set new GDP growth records in 2021 and set the stage for the next Roaring ’20s.
- Terry Liebman