
SHI 2.28.18: Fears and Beliefs

SHI 2.21.18 Buy a House
February 21, 2018
SHI 3.7.18 STEAKONOMICS
March 7, 2018
There’s an old Wall Street saying: “The financial markets are driven by two powerful emotions – greed and fear.” But while investor behavior may be driven by fear, consumer behavior is driven by belief.
- INFLATION REMAINS CONSISTENT AND LOW.
- CONSUMERS ARE CONFIDENT.
- CONSUMER INFLATION EXPECTATIONS REMAIN CONSISTENT AND LOW.
In the aggregate, investor fears drive our stock and bond markets. Consumer beliefs drive drive the economy and, I am convinced, the inflation rate. Let me explain.
Welcome to this week’s Steak House Index update.
If you are new to my blog, or you need a refresher on the SHI10, or its objective and methodology, I suggest you open and read the original BLOG: https://www.steakhouseindex.com/move-over-big-mac-index-here-comes-the-steak-house-index/
Why You Should Care: The US economy and US dollar are the bedrock of the world’s economy. This has been the case for decades … and will continue to be true for years to come.
Is the US economy expanding or contracting?
According to the IMF (the ‘International Monetary Fund’), the world’s annual GDP is almost $80 trillion today.
During the calendar year 2017, US nominal GDP increased by $833 billion … by an amount approximately equal to the market capitalization of Apple. At the end of 2017, US ‘current dollar’ GDP was almost $20 trillion — about 25% of the global total. Other than China — a distant second at around $11 trillion — no other country is close.
The objective of the SHI10 and this blog is simple: To predict US GDP movement ahead of official economic releases — an important objective since BEA (the ‘Bureau of Economic Analysis’) gross domestic product data is outdated the day it’s released.
Historically, ‘personal consumption expenditures,’ or PCE, has been the largest component of US GDP growth — typically about 2/3 of all GDP growth. In fact, the majority of all GDP increases (or declines) usually results from (increases or decreases in) consumer spending. Consumer spending is clearly a critical financial metric. In all likelihood, the most important financial metric.
The Steak House Index focuses right here … on the “consumer spending” metric. I intend the SHI10 is to be predictive, anticipating where the economy is going – not where it’s been.
Taking action: Keep up with this weekly BLOG update. Not only will we cover the SHI and SHI10, but we’ll explore related items of economic importance.
If the SHI10 index moves appreciably -– either showing massive improvement or significant declines –- indicating growing economic strength or a potential recession, we’ll discuss possible actions at that time.
The BLOG:
To some extent, I will argue, it’s a “chicken and egg” question. Which comes first? Rising inflation … or a widespread consumer belief that the inflation rate is rising?
I contend that aggregate consumer beliefs determine the inflation rate, not the other way around. To some extent, the two are inexorably entwined. Consider the three ‘necessities’ of food, shelter and clothing, for example. Suppose the price of certain staples — a loaf of bread or a gallon of milk — begins to rise. Consistently. Month after month. The cause of the price increase is not important. Perhaps shortages, economic growth, or some other event drove the persistent price increase.
The cause makes no difference. But the effect does. Over time, the change is noticed. And over a longer period of time, this experiential event will begin to change the aggregate consumer belief about the inflation rate. And, over a longer period of time, it will change consumer inflation expectations.
But that change in consumer inflation expectations requires (1) a consistent experience over (2) a long period of time. Neither of which have occurred. Because (1) must happen before (2) is possible. And (1) has not yet happened.
Take a look at the chart below, courtesy of Bloomberg. An Bloomberg analyst sought evaluate how the “inflation experience” has been evolving. The BLUE LINE is probably the most meaningful. It measures the price movement of “pro-cyclical” items — consumer items that are particularly sensitive to our economy. In other words, their price movement tends to be highly correlated to increases or decreases in economic strength. So as the economy ‘heats up’ — another way of saying GDP growth is strong — their price tends to rise, too.
Yet we see no consistent BLUE LINE behavior or direction. One could argue we see some consistency since the beginning of 2011 — the direction has been UP. But even at its recent peak — in Q1 2017 — the “price” of this “basket” of pro-cyclical consumer goods was increasing at an annual rate of less than 1.3%. This price increase is too low to show up on the consumer’s radar.
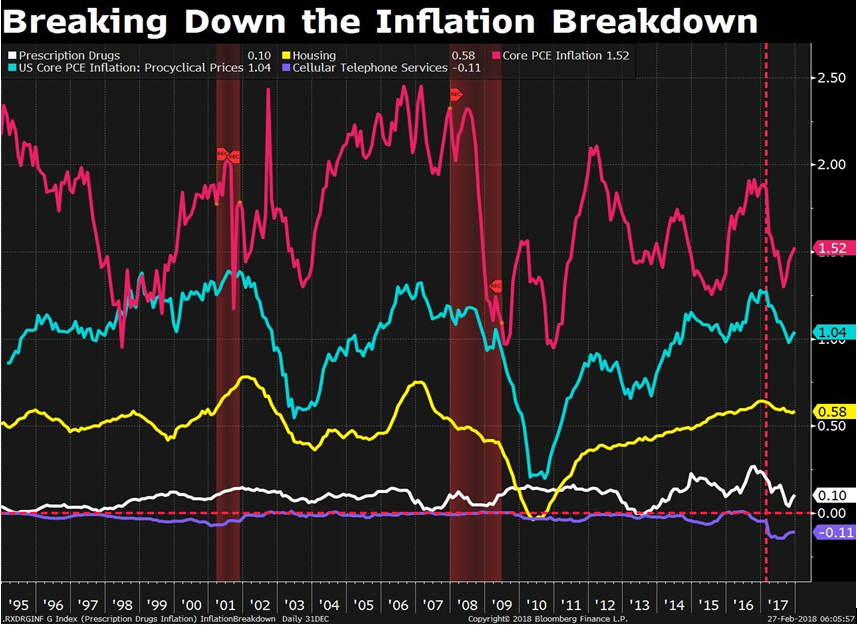
The bottom line: If consumers don’t notice a price increase, their inflation expectation does not change. And, as a result, if consumer expectations don’t change, the longer-run inflation rate will not change.
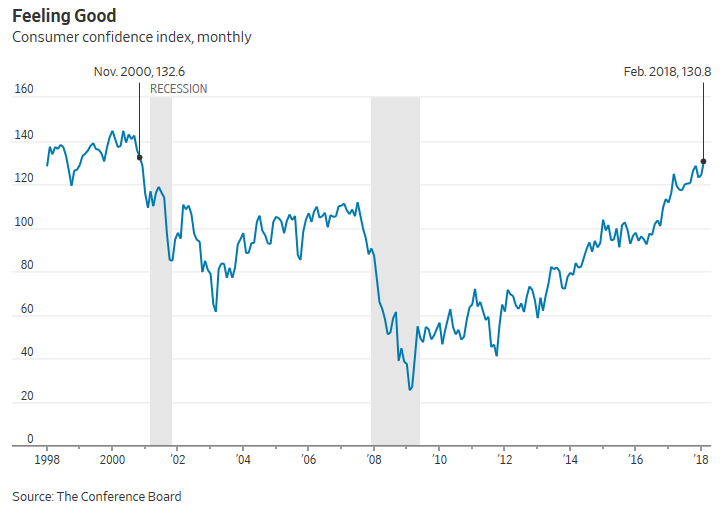
My theory that “expectations remain the same” is completely supported by recent surveys from he Conference Board and the University of Michigan.
The monthly Consumer Confidence Survey®, is conducted for The Conference Board by Nielsen, a leading global provider of information and analytics around what consumers buy and watch. Here is a summary of their February 15th report:
“Consumer confidence improved to its highest level since 2000,” said Lynn Franco, Director of Economic Indicators at The Conference Board. “Consumers’ assessment of current conditions was more favorable this month, with the labor force the main driver. Despite the recent stock market volatility, consumers expressed greater optimism about short-term prospects for business and labor market conditions, as well as their financial prospects.”
Got it: stock market volatility is not a concern and consumers are optimistic!
Each month, the University of Michigan also completes a survey, called “Survey of Consumers.” In February, the survey found:
- Consumer sentiment rose in early February to its second highest level since 2004 despite lower and much more volatile stock prices.
- Indeed, when asked to identify any recent economic news they had heard, negative references to stock prices were spontaneously cited by just 6% of all consumers.
- In contrast, favorable references to government policies were cited by 35% in February, unchanged from January, and the highest level recorded in more than a half century.
- In addition, the largest proportion of households reported an improved financial situation since 2000, and expected larger income gains during the year ahead.
- To be sure, higher interest rates during the year ahead were expected by the highest proportion of consumers since August 2005.
- Consumers also anticipated a slightly higher inflation rate, although the year-ahead inflation rate has remained relatively low and unchanged for the past three months.
- Purchase plans have been transformed from the attraction of deeply discounted prices and interest rates that outweighed economic uncertainty, to being based on a sense of greater income and job security as the fewest consumers in decades mentioned the favorable impact of low prices and interest rates.
- Overall, the data signal an expected gain of 2.9% in real personal consumption expenditures during 2018.
Once again, here’s the bottom line: Stock and bond market volatility make little difference to the typical consumer. Only 6% were concerned about negative movement. Almost 6 times that number were favorably impressed by the tax law changes.
And their inflation expectations have not changed. In February of 2017 – one year ago – the U of M survey found consumers believed inflation would run 2.7% in the next year and 2.5% in the next 5 years. In February of this year, they made the identical forecast. No change. None.
Bond yields, on the other hand, have climbed steadily this year. The 10-year Treasury is hovering around 2.9%, which is about 1/2% higher than when the year began. The increase is the result of fear: fear of significant supply increases, as we discussed in a prior blog, and fear of inflation. Fear drives the financial markets. Not belief.
Consumer inflation expectations are well anchored … and the inflation rate is not likely to change meaningfully any time soon. In my opinion.
Unfortunately, this doesn’t help us at our extravagant eateries. They are already very expensive. Perhaps the only good news is that the price of your favorite NY Strip isn’t increasing anytime soon. 🙂
This week the SHI10 slipped quite a bit:
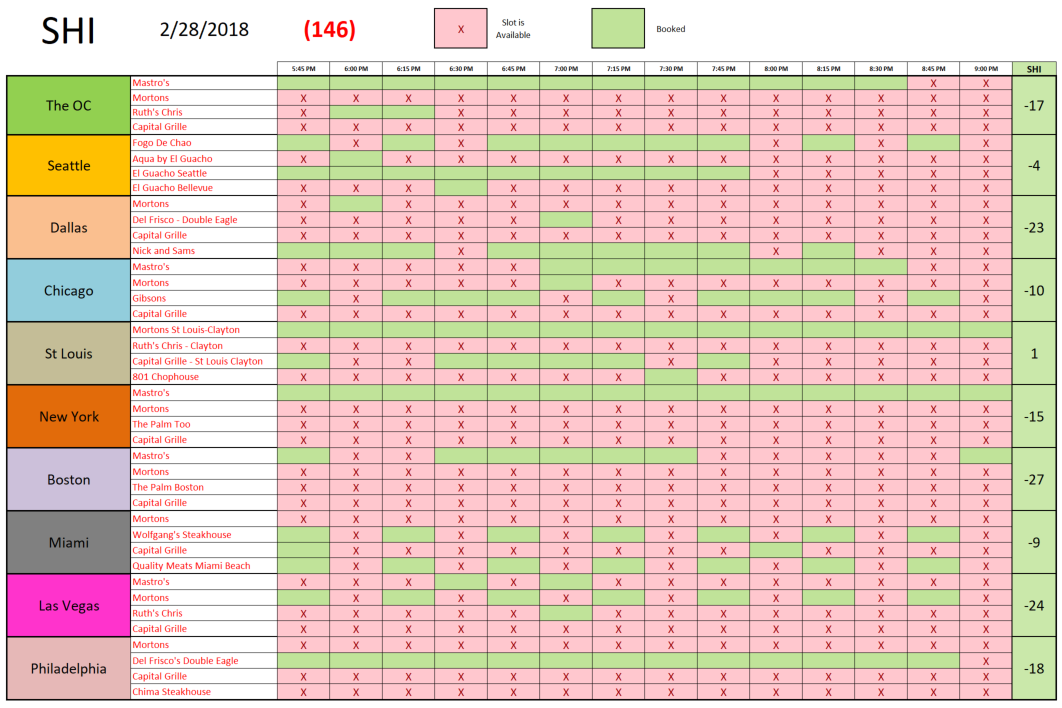
This weeks reading of negative (146) is one of the lowest this year. People in large numbers are eating at home this weekend in “The OC.” The same is true with Dallas, Boston and Las Vegas. Mastros continues to show a high degree of popularity in many cities. Here’s our longer term trend:
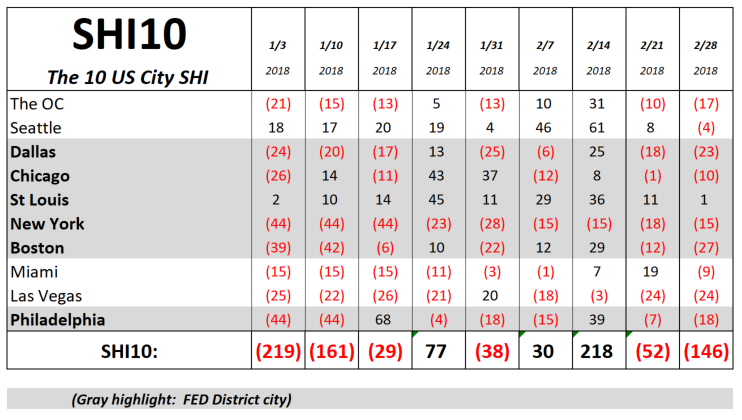
Frankly I’m a bit surprised by this low number. Earlier today, the Bureau of Economic Analysis (“BEA”) released their “second” estimate of Q4, 2017 GDP growth. They confirmed the 2.5% real growth rate. And commented that nominal GDP increased 4.9 percent, or $235.9 billion, in the fourth quarter. These are robust numbers. And they suggest the SHI10 should be significantly higher. C’est la vie.
Enjoy your steak!
- Terry Liebman


