SHI 6.23.21 — Tales From the Crypt-Oh!

SHI 6.16.21 – The Big Apple is Back!
June 16, 2021
SHI 7.7.21 – Rolling the Dice in ‘Vegas!
July 7, 2021
“Bitcoin is not a payment system, and it is not a currency. In the best situation, it is a financial asset, and in the worst case, it is a pyramid scam.”
Ouch. But, hey, these are not my words … but those of Andrew Abir, Deputy Governor of the Bank of Israel.
And therein lies one big headwind for crypto-currencies. Central banks. For example, on Monday of this week, the People’s Bank of China (PBOC) — China’s central bank — told the country’s largest financial institutions, including its three biggest state-owned banks and electronic payment provider Alipay, to crack down on cryptocurrency trading, triggering a value collapse in most crypto-currencies. Bitcoin was hovering down more than 50% compared with an all-time high of nearly $65,000 reached in mid-April, before recovering somewhat. Chinese authorities last week also closed energy-hungry 26 bitcoin mining operations in hydropower-rich Sichuan Province.
“Globally we are seeing a much more forceful crackdown on crypto by governments,” analysts at QCP Capital, a Singapore-based crypto trading firm, wrote in a note. “China is now leading the charge, and this directive coming all the way from the top means it will continue reverberating throughout the lower levels for a few more weeks to come.”
A few more weeks? Hmmm … that’s optimistic. Look, if you choose to play the Bitcoin game, I wish you luck. And get ready for a wild, white-knuckle ride. Danger, opportunity, villains and thieves … there’s plenty here for everyone! 🙂
“
But what about inflation?“
“But what about inflation?“
Oh. Right. Inflation.
This word is on everyone’s tongue these days. Everyone has an opinion and everyone’s an expert. In their own mind, of course.
But what the heck IS inflation, as this term is used by the FED? And what the heck does “transitory” mean … after all, FED Chair Powell has used that word about a trillion times in the past few months.
Welcome to this week’s Steak House Index update.
If you are new to my blog, or you need a refresher on the SHI10, or its objective and methodology, I suggest you open and read the original BLOG: https://www.steakhouseindex.com/move-over-big-mac-index-here-comes-the-steak-house-index/
Why You Should Care: The US economy and US dollar are the bedrock of the world’s economy.
But is the US economy expanding or contracting?
The short answer? Expanding. A lot. Forever more, COVID-19 will be mentioned concurrently with any discussion about 2020 GDP. Collectively, the world’s annual GDP was about $85 trillion by the end of 2020. But I am confident all 2021 GDP discussions will start with a nod to the blowout 1st quarter GDP growth number, because our ‘current dollar’ GDP grew at the annual rate of 10.7%! Annualized, America’s GDP blew past $22 trillion during the quarter, settling in at $22.0489 trillion. The US, the euro zone, and China continue to generate about 70% of the global economic output.
The objective of this blog is singular.
It attempts to predict the direction of our GDP ahead of official economic releases. Historically, ‘personal consumption expenditures,’ or PCE, has been the largest component of US GDP growth — typically about 2/3 of all GDP growth. In fact, the majority of all GDP increases (or declines) usually results from (increases or decreases in) consumer spending. Consumer spending is clearly a critical financial metric. In all likelihood, the most important financial metric. The Steak House Index focuses right here … on the “consumer spending” metric. I intend the SHI10 is to be predictive, anticipating where the economy is going – not where it’s been.
Taking action: Keep up with this weekly BLOG update. Not only will we cover the SHI and SHI10, but we’ll explore related items of economic importance.
If the SHI10 index moves appreciably -– either showing massive improvement or significant declines –- indicating growing economic strength or a potential recession, we’ll discuss possible actions at that time.
The Blog:
Inflation is NOT what we’re experiencing now, here in the United States.
Then what is inflation?
Let’s sidestep all the hyperbole and let me show you. Take a look at this graph, courtesy of John Kemp at JKempEnergy:
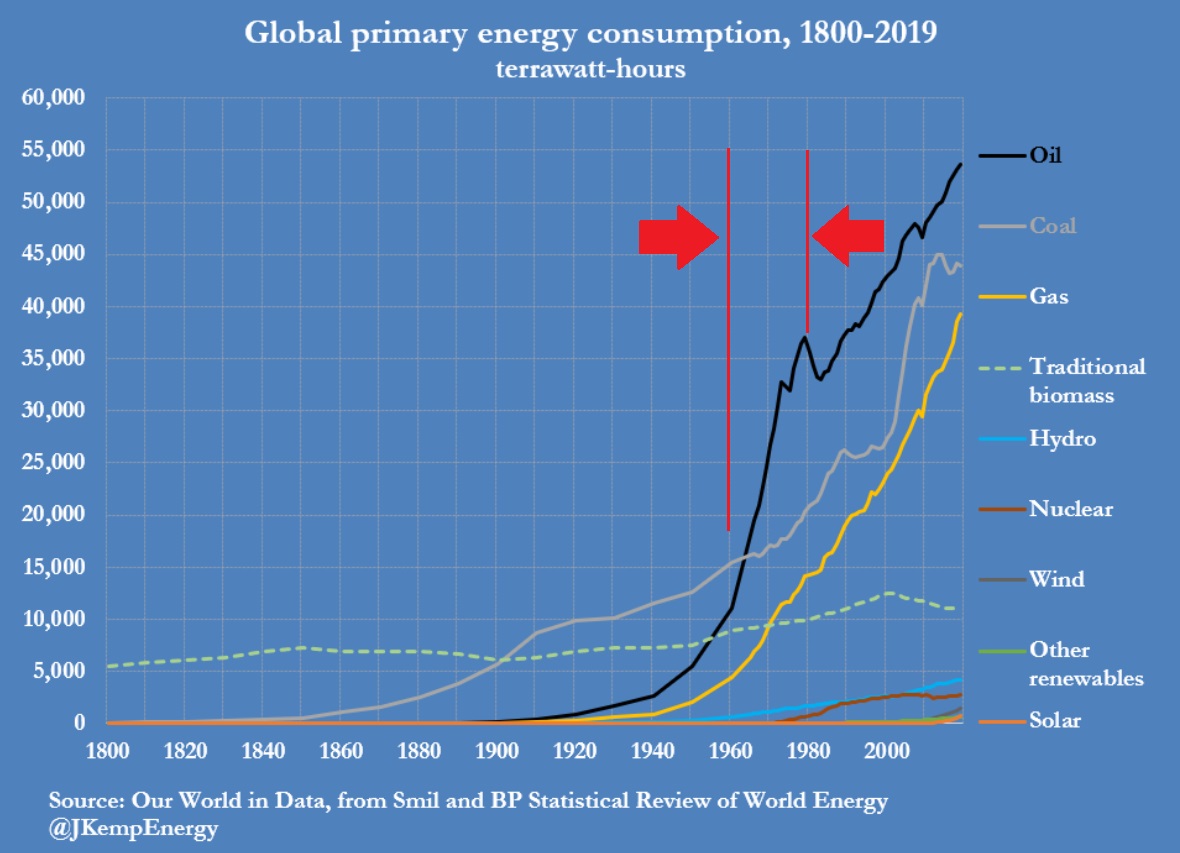
The chart above highlights global energy consumption, decade by decade, for the last two (2) centuries. I’ve highlighted the 20-year period between 1960 and 1980. A bit later, I’ll explain why in more detail.
OK, clearly oil consumption (and gas, and coal) skyrocketed during this period. Why is not important for this discussion — but the fact that energy demand shot to the moon is critically important. Energy dmand skyrocketed year after year — for two full decades between 1960 and 1980.
Only when FED Chair Volcker raised short term interest rates to over 20% — yes, youngsters, this actually happened in the early ’80s — did energy demand fall.
As a long-time reader of The Steak House Index, you know that the ‘supply and demand’ relationship is the underlying foundation for almost all price action. Price movement of Bitcoin aside. Who can possibly explain THAT action! 🙂
OK, let’s get serious here and ask this question: What happened to the price of oil — more precisely the price of ‘West Texas Intermediate (WTI)’ crude oil — during this 20 year stretch when demand was skyrocketing? Here’s a chart courtesy of our friends at the St Louis FED:
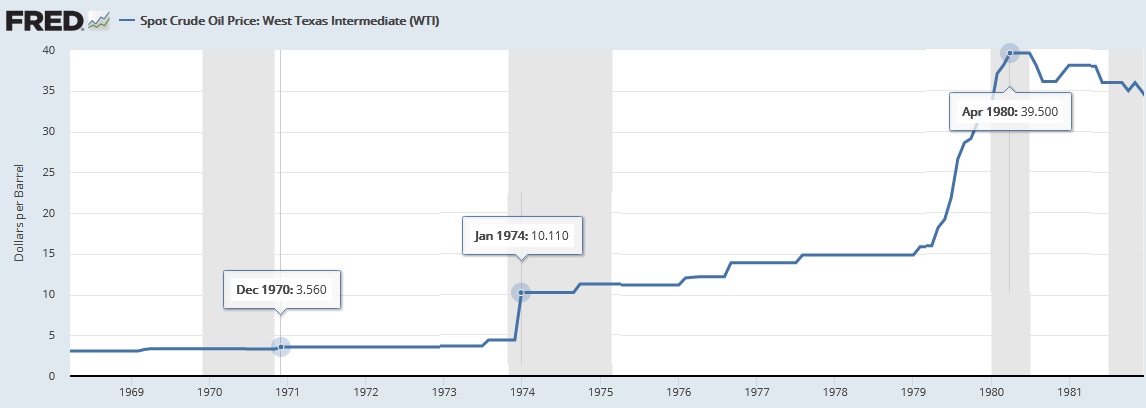
For decades, oil’s price was relatively stable. As you can see above, we left the 1960s and entered the 1970s with oil hovering around $3.50 a barrel (PPB). And here it remained until the end of 1973. But by January of 1974, the PPB was way up — to over $10/barrel. An almost 3X increase. Ouch. But price increases didn’t stop there. Throughout the rest of the 1970s price increases were consistent and persistent … over and over again … until the PPB peaked at just under $40 in 1980. Summarizing, after decades of a relatively stable price, in the 10 years between 1970 and 1980
The price of oil increased more than 11X!
That’s an 1,100% price increase! That’s inflation. A persistent, unrelenting, continuous rise in an economically critical component. Year after year, the price increased. Year after year, American consumers were forced to pay higher prices for everything that used or touched petroleum. There was no alternative: Everything that Americans ate, wore, lived in, or drove used oil in one way or another.
That’s inflation. There was nothing transitory about the inflation of the 1960s and the 1970s. It was real. It was persistent. It was a major problem.
Here’s more on that explanation I promised you above. During the 1960’s the US ran a sizable deficit … predominately to finance the Vietnam war. As a result, the US dollar lost some of its luster in the eyes of our global trading partners. So much, in fact, that many of them elected to swap dollars for gold — because each US dollar was convertible to gold, at the holder’s option, at a near-fixed price of about $35. During the 1960s so many countries elected to swap their dollars for gold that in 1971 then-President Nixon issued a unilateral cancellation of this policy. No longer, Nixon decreed, would the US swap dollars held around the world for gold. And by 1973, as a direct result, the long standing system for international currency exchange, known as Bretton Woods, finally completely collapsed.
And by the end of 1973, the price of oil began its inexorable rise to over 11X its price just 10 years prior.
Again, that’s inflation. That’s real inflation. Not the stuff we’re seeing today. Because inflation, at its core, is essential a metric used by the FED to ‘quantify‘ the annual changes in the average American’s cost of living. Food, shelter, clothing, entertainment, etc … movement in these prices is what the FED is focused on when they discuss inflation. Not lumber. Or copper. Or soybeans. And not home prices … at least not directly. But that’s an economic tangent I’ll leave for another time.
Today’s inflation, I feel, will be transitory, just as the FED believes. Time will tell — because at its core, inflation is a time-bound event — but while prices are definitely increasing at present, like the FED I believe they will plateau in the not too distant future.
Did someone mention food? Oh, right, that was me. 🙂
Well, shall we head to the steakhouses and see how the supply/demand dance is playing out over there? If you’re looking for a reservation this weekend, you may have a bit more luck than last week. While reservation demand is brisk for this coming Saturday, we have more openings than in prior weeks. Here’s this week’s SHI chart:
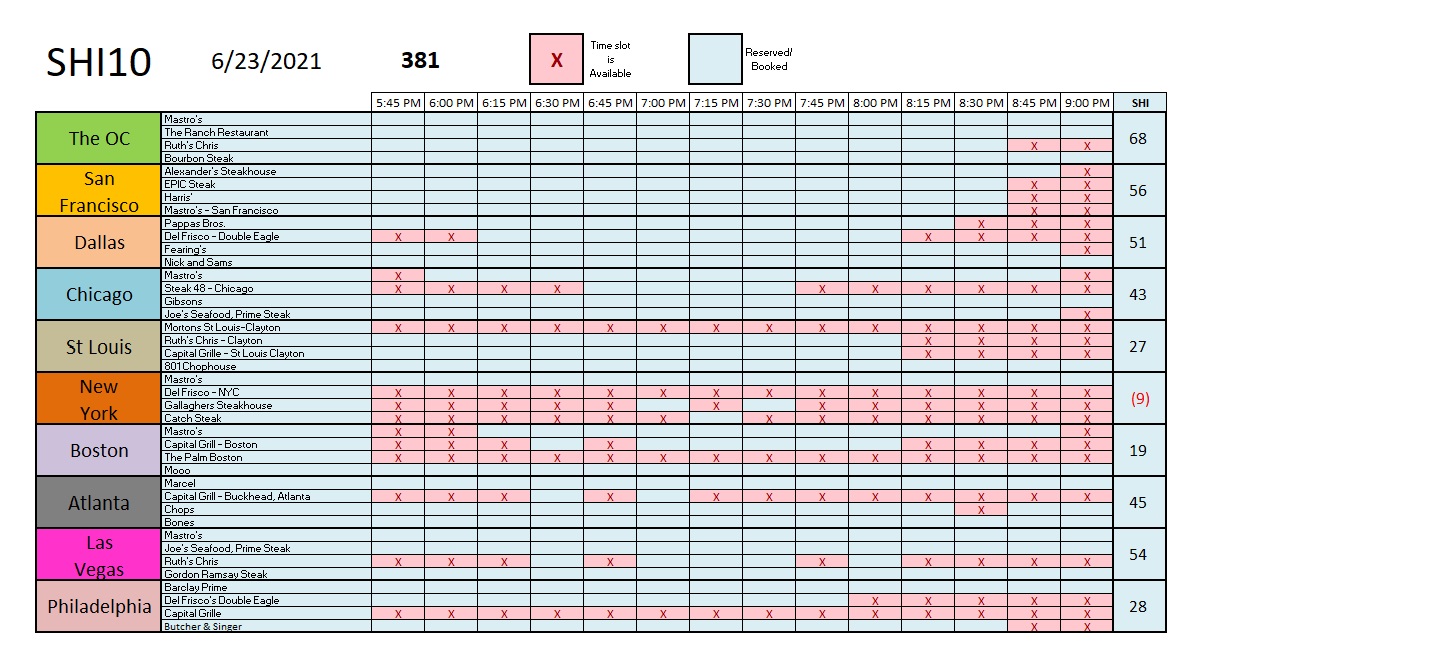
NYC and Boston expensive eateries continue to struggle this week, while the OC and San Francisco are both almost fully booked. Las Vegas has more availability this week than in prior surveys. But only Ruth’s Chris has open tables. All in all, the SHI for this week continues to paint a high-demand picture for pricey cuts of beef. Here is the long-term trend report:
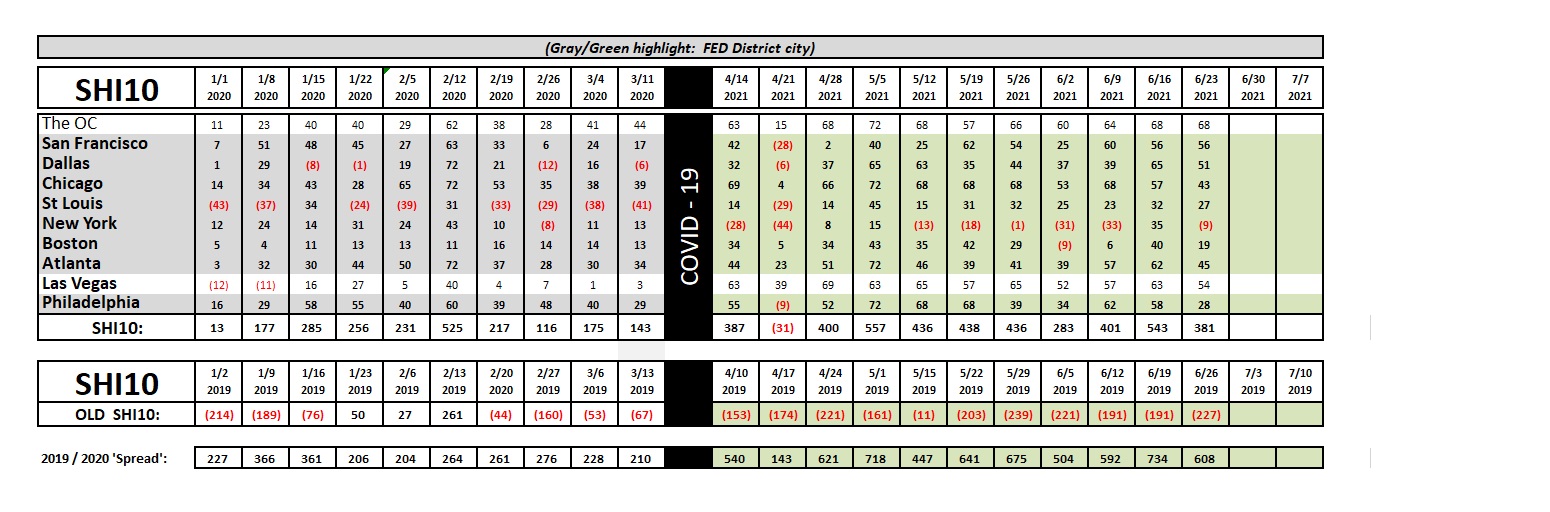
Our comparative 2019 week also reflects a consistent 2019 trend. Clearly, the SHI10 numbers, at present, continue to indicate that America is reopening, and the well-heeled have a strong hankering for an expensive T-bone and a great experience. That experience will cost more this weekend, but there appears to be no shortage of affluent eaters willing to pay the price. US consumer spending is strong … and it looks like the 2021 GDP numbers will be equally lofty. Good news.
Because I’m so dedicated to my craft and my readers, I’m heading into the field next week to conduct some in person research. As a result, I expect that next week’s blog will be MIA … but rest assured I’ll have plenty to report the following week! Good luck out there!
<|> Terry Liebman