SHI 8.6.19 — Staying Positive in a Negative World

SHI 7.31.19 — The Last Mile
July 31, 2019
SHI 8.14.19 – What? Me Worry?
August 14, 2019
“Germany’s 30-year bond now yields less than zero.”
Negative yields. Wow. Imagine … you’re back in ‘Econ 101’ and you suggest to the professor, “One day, lenders will pay borrowers to take their money. Not only will the lender receive NO interest, interest rates will be negative!” Trust me: You would have flunked that class. And been ridiculed mercilessly. Yet, ironically, you would have been right.
Welcome to this week’s Steak House Index update.
If you are new to my blog, or you need a refresher on the SHI10, or its objective and methodology, I suggest you open and read the original BLOG: https://www.steakhouseindex.com/move-over-big-mac-index-here-comes-the-steak-house-index/
Why You Should Care: The US economy and US dollar are the bedrock of the world’s economy. This has been the case for decades … and will be true for years to come.
But is the US economy expanding or contracting?
According to the IMF (the ‘International Monetary Fund’), the world’s annual GDP is about $84 trillion today. US ‘current dollar’ GDP now exceeds $21.3 trillion. In Q2 of 2019, nominal GDP grew by 4.6%. The US still produces about 25% of global GDP. Other than China — in a distant ‘second place’ at around $13 trillion — the GDP of no other country is close. The GDP output of the 28 countries of the European Union collectively approximates US GDP. So, together, the U.S., the EU and China generate about 70% of the global economic output. This is worth watching carefully, right?
The objective of the SHI10 and this blog is simple: To predict US GDP movement ahead of official economic releases — an important objective since BEA (the ‘Bureau of Economic Analysis’) gross domestic product data is outdated the day it’s released. Historically, ‘personal consumption expenditures,’ or PCE, has been the largest component of US GDP growth — typically about 2/3 of all GDP growth. In fact, the majority of all GDP increases (or declines) usually results from (increases or decreases in) consumer spending. Consumer spending is clearly a critical financial metric. In all likelihood, the most important financial metric. The Steak House Index focuses right here … on the “consumer spending” metric. I intend the SHI10 is to be predictive, anticipating where the economy is going – not where it’s been.
Taking action: Keep up with this weekly BLOG update. Not only will we cover the SHI and SHI10, but we’ll explore related items of economic importance.
If the SHI10 index moves appreciably -– either showing massive improvement or significant declines –- indicating growing economic strength or a potential recession, we’ll discuss possible actions at that time.
The BLOG:
Sometimes conventional wisdom is neither conventional nor wise. Consider this: Every duration of German sovereign debt is now negative. Even their 30-year bond has a negative yield. Imagine lending the German government money — for 30 years — and losing money. From the 3-month to the 10-year term, your investment in a German bond will yield you about a negative 1/2 percent. Here’s how it works: Buy a 10-year German ‘bund’ at a price of $10,500 … wait 10 long years … and the government will return $10,000 to you. Germany’s longest bond, the 30-year, just slipped below zero, too. Lenders have always charged interest to their borrower. But today, Germany can borrow money and pay no interest. Zip. Zero. Nada. The entire German bond curve is below zero. If you want to lend money to Germany, for any period of time, you have to pay them to take your money. Apparently, giving money to Germany for safekeeping is better than putting it into your mattress. Germany will safely store your money for you, but they will charge you a fee for that service. Such a deal! 🙂
In the 4,000 or so years that lenders have been lending and borrowers have been borrowing, this has never happened before. Lenders have always charged interest to borrowers. Just as landlords have always charged a tenant rent in exchange for the tenant’s right to occupy the landlord’s property. Can you imagine a world where a property rental is free? No rent? Here’s an even more absurd thought: Imagine a landlord paying you — a tenant — to occupy the landlord’s property! Crazy talk, right? Well, aren’t negative interest rates pretty much the same thing?
So here’s a question for you: Is this simply a temporary aberration … or it is the new normal?
10-year government bonds in Japan, France, Austria, Belgium, the Netherlands and Switzerland are also all below zero. Switzerland is far below zero, hovering at about a negative 0.8% yield. Imagine this:
- About half of all European government bonds sport a negative yield.
- According to Bloomberg, about 1/4 of all ‘investment-grade’ debt yields below zero.
- Corporate bonds have joined the game: A ‘double-A’ rated Nestle bond will cost you, the lender, 0.15% per year to own. Your yield is a negative 0.15% per year.
What is the cause of this phenomenon? And what is the effect and implication as the world seemingly embraces negative yields? Let’s buckle up and dive in.
The cause?
This question is both simple and complex. On one hand, the negative price of sovereign debt is a supply/demand phenomenon. According to ‘Statistical Data Warehouse’ of the European Central Bank (ECB), as of June of 2019 about $8.2 trillion of ‘government debt securities’ had been issued by governments in the Euro area. There’s your supply. On the demand side of the ledger, the ECB has purchased, and now holds on their balance sheet, about $5.3 trillion of this debt. This figure includes other types of debt instruments, not just sovereign debt, but the vast majority of the balance is government debt. The ECB owns more than 60% of all Euro area sovereign debt.
It would appear the extraordinary demand of the ECB, against the relatively stable supply, has driven the price of debt up and the yield on that debt down. Down below zero. Japan appears to be a similar story. Japan remains the 3rd largest economy on the planet, with a GDP of about $5 trillion per year. Japan’s national debt totals about $12 trillion. Of that total, about $5 trillion is owned by their central bank and the majority of the balance is owned by Japanese citizens. Only about 10% of Japan’s sovereign debt rests in foreign hands. Japan’s current 10-year yield is about a negative 0.18% per year. Once again, you could argue Japan’s central bank has driven yields to zero and below by their rapacious demand for Japanese sovereign debt.
The same has not occurred here in the US. Sure, the FED bought (and owns) a bunch of US debt…around $2 trillion. But this represents only about 10% of all US government debt — which totals about $22 trillion. 27% of that figure is “intragovernmental debt” and 73% — or $ 16 trillion — is owned by the public at large. (Including about $6 trillion owned by foreign central banks.)
Then there’s China — the other big fish in the economic pond. Their national debt is about $5.3 trillion. And the assets of the Peoples Bank of China (PBOC) total about the same: $5.3 trillion. It’s easy to see demand for China sovereign debt has increased by PBOC actions. In fact, the PBOC has crowded out all other potential debt buyers, as they own approximately 100% of China’s sovereign debt. Compare this figure to the condition in the Euro area (60% owned by the ECB) and Japan (about 40% is owned by the BOJ). In light of the fact that the PBOC owns 100% of China’s sovereign debt — a far higher percentage than in the EU or Japan — it would seem reasonable to expect this extraordinary, massive PBOC demand would have pushed up Chinese bond prices and push down the yields. In fact, it would be reasonable to expect yields on Chinese sovereign debt to be far below zero, correct? Given these conditions, negative yields seem very likely.
Yet, oddly enough, current 10-year debt in China pays about 3%. In Europe and Japan, huge central bank demand seemingly has driven yields below zero … yet in China — with even greater central bank bond-buying — yields have remained solidly positive.
Here is the complex part. Clearly there is something else at work here. Clearly, the supply/demand relationship only explains part of the picture. Remember: If the supply/demand relationship explained the entire picture, then the interest rates in all nations/areas where significant excess demand, the result of the local central bank buying a sizable share, or majority of, the country’s sovereign bonds, would behave relatively consistently. Given the relatively static supply (or at minimum, consistent supply) of sovereign bonds in the Euro area, Japan and China, we would expect all sovereign debt from these three countries/areas to be firmly in the negative zone. But China, where the excess demand is greatest of the three, is sporting a 3% interest rate. Why?
Some part of the explanation, I believe, is the slow but persistent change in the demographic composition of all developed nations. And the downstream economic impact those changes have on perceived inflation levels and future GDP growth rates. Consider this image, courtesy of Yardeni Research:
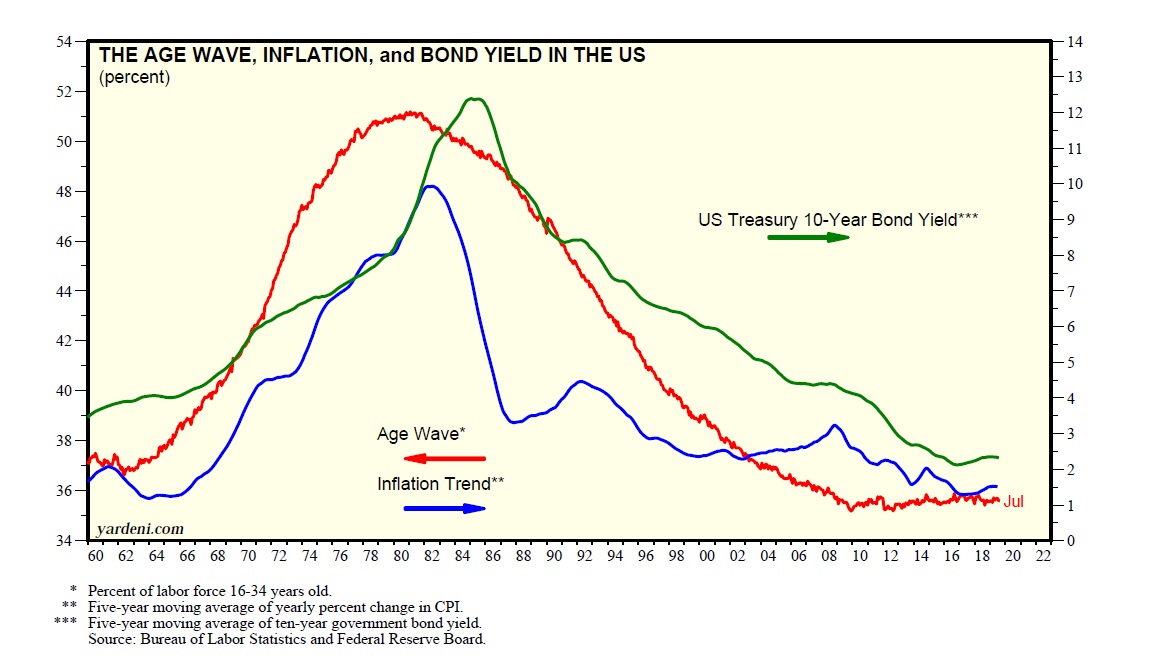
The colored arrows refer to the ‘left hand scale’ or the ‘right hand scale.’ So the ‘Age Wave’ is measured on the left side scale. 16-34 year olds in the US labor force peaked around 1980, at around 51% of the total ‘civilian labor force.’ The percentage of 16-34 year olds in the labor force has declined ever since. Today, that same percentage is below 36%.
Take note these facts:
- As the number of 16-34 year olds in the labor force began its long, continuous taper, shortly thereafter the ‘5-year moving average’ of the annual CPI change also began its long, slow decline.
- As the number of 16-34 year olds in the labor force began its long, continuous taper, shortly thereafter the ‘5-year moving average’ of the 10-year Treasury also began its long, slow decline.
Almost 13 years ago, in 2006, Abraham Mosisa and Steven Hipple wrote a paper for the BLS “Monthly Labor Review.” From that report:
For nearly six decades, an event that has had a profound effect on the population’s size and composition has been the aging of the “baby-boom” generation—those born between 1946 and 1964. The baby-boom generation—and the concomitant rise in participation of women—have had an enormous impact on overall (labor) participation. During the 1970s and 1980s, baby boomers moved into age cohorts typically exhibiting very high levels of labor force participation—for example, 25 to 34 years and 35 to 44 years. Indeed, after being stagnant over the 1950s and 1960s, the aggregate labor force participation rate during the 1970s and 1980s rose rapidly, primarily because of the movement of baby boomers into these high-participation-rate ages and the increase in participation among women. However, in recent years, downward pressure has been exerted on overall participation due to the movement of the baby-boom generation into the 55-years-and-older age group, which traditionally has lower participation rates. In particular, the first of the baby boomers (those born in 1946) reached age 55 in 2001.
Remember: This report was written 13 years ago. Demographic conditions have not improved in the interim. Not only have they not improved, expectations are for current conditions to remain consistent or a bit worse. The Census Bureau, the government agency tasked with closely tracking demographic changes, produced this forecast — take a look at the following image:
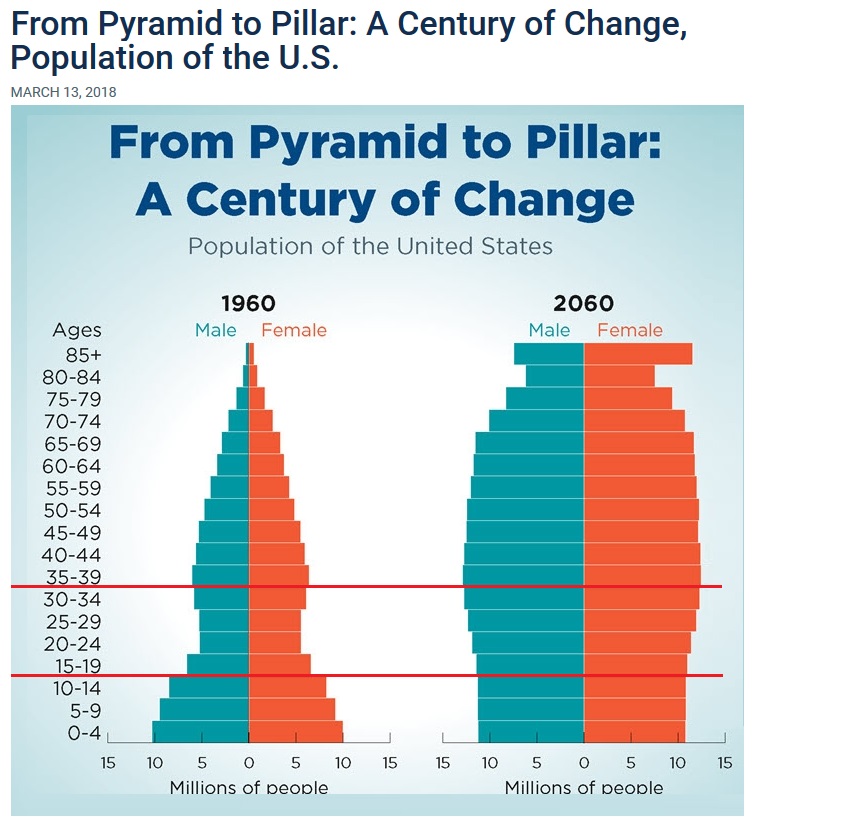
The ‘pyramid‘ of US population from 1960 will become a ‘pillar’ or cylinder by 2060. No more pointy top, folks, the walls of our 2060 cylinder are vertical. I’ve highlighted the cohorts between 15 (close enough to 16) and 34 with horizontal red lines. In absolute numbers, the number of folks in these four age cohorts will almost double. But as a percentage of total ‘work force age’ population, the percentage is quite small, when compared to the 1980s.
When 2030 begins, all ‘baby boomers’ will be older than 65.
Per Jonathan Vespa, a demographer with the U.S. Census Bureau, “By 2035, there will be 78.0 million people 65 years and older compared to 76.7 million (previously 76.4 million) under the age of 18.” By 2035, more “old people” will be living in the US than young people.
These demographic trends are meaningful. And they have economic implications. Take another look at the Yardini image above. You’ll notice a strong correlation between the direction between all three (3) measured metrics: 16-34 year olds in the labor force, the 10-year treasury, and inflation trends. Of course, long-term readers of my blog know correlation and causation are two very different things. Data can be correlated without any causal relationship.
But ask yourself these questions:
- Are “younger” people “spenders” or “savers?”
- Are senior citizens “spenders” or “savers?”
The answers are simple. Younger folks, between entering the workforce and, say, about 50 years of age tend to be “spenders.” They buy ‘stuff,’ eat out, seek unique experiences, and purchase durable goods. (Recall durable goods are things that are supposed to last a long time … like home appliances, jewelry, furniture, tools, etc.) Younger folks are the true consumers driving the US consumer consumption economy.
But senior citizens are not consumers. At least not to the extent of younger folks. They own all the durable goods they plan to own. Ever. They consume, but their expenditures are lifestyle choices and often more health and medical related. Senior citizens tend to be savers not spenders.
This demographic change is not unique to the US. To the contrary, the same is happening — to a lesser or greater degree — in every developed nation on the planet. Japan is leading the charge. Here’s a quote from Wikipedia, “Aging of Japan:”
In 2014, Japan’s population was estimated at 127 million; this figure is expected to shrink to 107 million by 2040 and to 97 million by 2050 should the current demographic trend continue.
Hmmm…. if things don’t change, one probably would be able to “rent” a home in Tokyo for free by the time 2050 rolls around. Or, better yet, maybe the landlord will pay the tenant in exchange for the tenant’s agreement to occupy the property, keep it safe and in good condition. 🙂
At the same time the population of developed nations is growing older, the number of people living in those countries is falling. Even worse, in the case of Japan, their ‘labor force, total’ is shrinking. According to the World Bank, the size of Japan’s labor force peaked in 1998 at about 68 million people. Their labor force has been shrinking ever since. In fact, in 2012 the number had declined to about 65.6 million people — a 3.5% decline in their labor force. Since 2012, Japan has done an enviable job of welcoming more women into the labor force, and by 2018, it had recovered to about 67 million folks. But here’s the problem: Growing GDP with a shrinking labor force is very difficult. If not downright impossible. Even maintaining a constant GDP with a shrinking labor force suggests each worker must become more productive, producing more GDP per capita than the prior year.
Which brings us to the essence of the problem today: All current economic theories are founded on the principle of consistent growth. Because growth has been consistent, year after year. Since the beginning of recorded history, populations grew. For century after century, the number of people in just about every one of the (today) 190 countries around the world increased. Which, by extension, means the labor force in each country grew. And, with the increase in the number of workers came increased demand for goods and services, houses, etc.
This bears repeating: Every current economic theory is based on the premise that growth is foundational and will continue year after year: Growth in demand, supply, population, GDP, etc. Growth in everything. And for centuries, this premise has held true. Populations grew. Demand grew. Supply grew. The labor force grew. GDPs grew. Everything grew.
But what if this foundational principle is no longer valid? No longer ubiquitous?
What would that mean? It means, my friends, that we need to rewrite the playbook. Not today, mind you. But soon. Just as Keynes rewrote the book back in 1935, we’ll have to re-think how different countries and/or cultures will perform (financially and economically) in a shrinking, static, or growing paradigm. Depending on which applies. Make no mistake: Demographics are the most powerful force impacting global economic conditions today.
The effect:
Demographics are showing their might in the low, low levels of current interest rates.
Did the Yardini “Age Wave” trigger falling inflation and interest rates. Or is the correlation mere coincidence? Completely unrelated?
No, there must be some correlation. To what degree, I’m not yet sure. It bears more study, but the aging population has impacted consumption patterns, and will continue to impact consumption into the future. If consumption has been impacted, meaning the “demand” side of the equation is lessening, it makes sense that the inflation rate is down.
Here in the US, the price of durable goods is deflating. This is factual. Of course, some of the price drop can be explained by globalization. But some of the decline must be demographic in cause. Remember: According the US Bureau of Labor Statistics, in 15 of the last 16 quarters — 3 years in total — the ‘price index’ for durable goods has declined.
This is not a fluke.
Europe is even older than the US. Inflation in the Euro area is presently hovering between 1% and 1.5%. But during 2016 and most of 2017, inflation in the EU was negative. Said another way, the EU experienced deflation for almost 2 years. Japan has struggled with deflation since the 1980s. And while they have had a few years of low inflation, their struggle to lift Japan’s economy out of a deflationary spiral remains their greatest battle.
China, on the other hand (I’m using admittedly sketchy government figures here), is sporting about a 2.7% ‘official’ inflation rate. Since 2012, their official inflation rate has consistently hovered very close to their 2% official target.
And so, here in 2019, we find ourselves on the cusp of a brave new world: A world where some countries have aging populations and are shrinking, some that may be relatively static, and others that continue to experience growth in all things. Today’s economic theory must account for all 3 conditions.
The world of John Maynard Keynes was very different than today’s. His book, “The General Theory of Employment, Interest, and Money,” was written to explain modern economic theories for the new, modern world post-world war II. For example, in Chapter 4, Keynes writes
“In dealing with the theory of employment I propose, therefore, to make use of only two fundamental units of quantity, namely, quantities of money-value and quantities of employment. The first of these is strictly homogeneous, and the second can be made so.”
Perhaps money and employment were homogeneous during Keynes’ time, but they no longer are today. Today, I believe, both are polygenous. For example, ‘labor’ today can be performed by robot, computer, algorithm, machine, human, etc., and in the country of manufacture, or in multiple countries using multiple labor forces, or any combination thereof. There is nothing homogeneous about labor today.
In The General Theory, Keynes discounts a number of the theories of David Ricardo, which were guiding and foundational economic principles during the 1800s, after Ricardo published “On the Principles of Political Economy and Taxation,” including Ricardo’s theory of ‘economic rent.’
The theory of ‘economic rent’ is neither economic nor it it rent. In a nutshell, economic rent is an unethical income advantage the owner of an asset gains due to unfair advantage resulting from ‘official privilege’ or a contrived condition, such as a monopoly. And, in fact, society’s application and use of Ricardian economic theories is considered by many to be the catalyst for the rise of Marxism. But that’s another story for another day.
The bottom line is this: We may be in a brand new era. One where growth in all things is not longer predictable or reliable. If Japan’s experience becomes the new normal, a shrinking labor force may also become the new normal in Europe and other developed nations. Robots and automation will help offset some of the decline … but when and how much is unknown.
This is what negative interest rates are saying.
Positive interest rates need growth to remain positive. Negative interest rates are simply the opposite of growth. Negative interest rates tell us the value of capital shrinks in a shrinking marketplace. Economic theories will need to evolve to reflect current conditions, not the other way around.
I need a steak. How about you? Let’s head to the steakhouses.
Green shoots! I’m seeing green! Check this out:
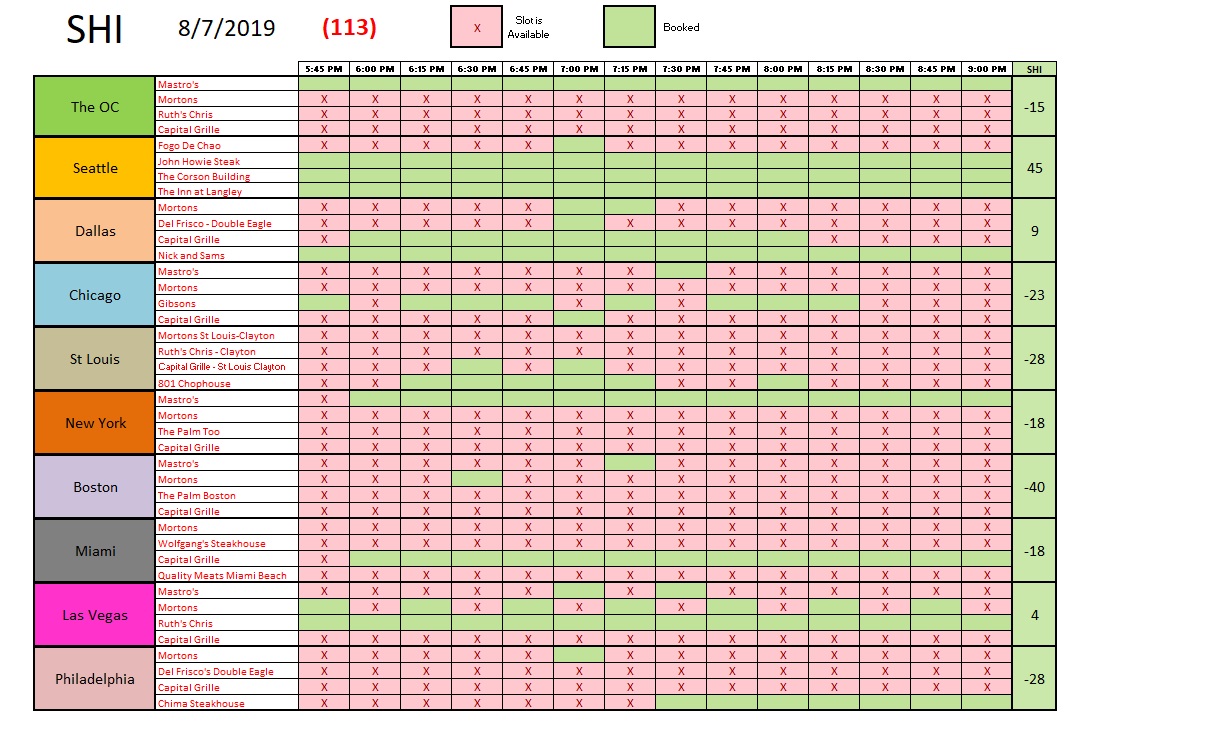
Across the United States, expensive steaks are in high demand this Saturday night! Every city in our SHI10 has at least one time-slot fully booked. After months of craving salads and fast food, even Miami is learning to love pricey T-Bones! While it’s tough to paint an SHI10 reading of a negative 113 in much of a positive light, by comparison to prior weeks we’re looking pretty good!
Reservation demand at our expensive steakhouses remains consistent. From a macro-economic perspective, this outcome is consistent with other more mainstream measurements of consumer spending and consumer confidence metrics from the FED, the BEA and the Conference Board. Consumers are spending … and this behavior is consistent with current US GDP growth metrics. A recession is probably looming in the wings, but not too soon. Here is the longer term trend report:
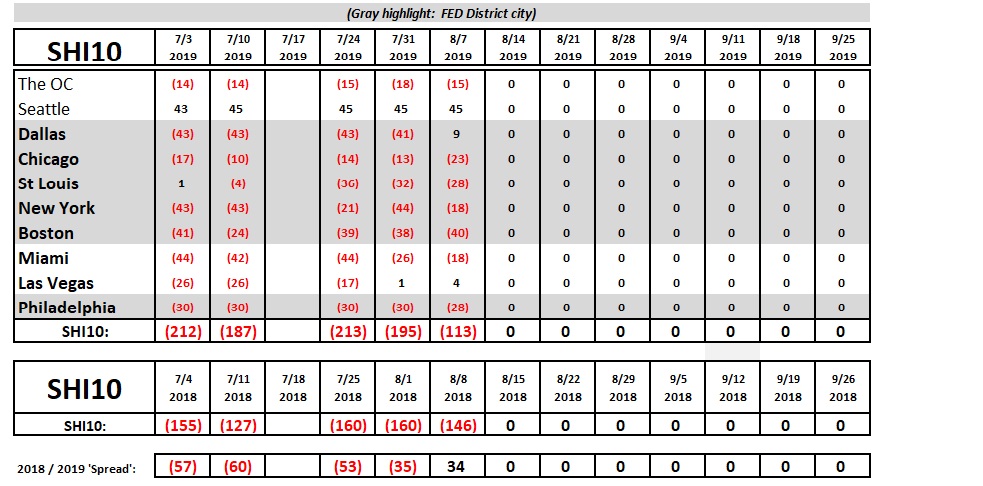
Look at that: This week’s SHI10 reading is better than the reading from this time, last year! Wow! That hasn’t happened in a while. Interesting. While one reading does not indicate a trend, it’s worth noting this metric suggests our economy is improving, not getting worse. Very interesting. Let’s see what next week brings.
By the way, its worth noting that in the past few days:
- New Zealand cut their ‘benchmark rate’ by 50 basis points.
- Thailand cut by 25 basis points.
- India’s central bank lowered its rate by 35 basis points.
Central banks are all jumping on the bandwagon. Across the globe, rates are falling. It’s entirely possible the theories I expressed above are completely off base. It may be that the exceptional decline in rates, across every country on the planet, is simply aberrational. Perhaps this, too, will become a passing phase.
But I believe I’m right. I believe my ‘Growth Theory’ is accurate. Today, growth is no longer a guarantee. I believe interest rates will likely stay positive in countries with positive growth … and will likely move negative where growth is negative. Yes, this has never happened before in recorded history. When growth stops, and shrinkage begins, positive becomes negative. I believe we need to re-write the economics books as a result.
– Terry Liebman