SHI 7.10.24 – Greek Mythology
July 10, 2024SHI 8.7.24 – Follow the Data, Not the Fear
August 7, 2024
Two verdicts, actually.
First, my verdict on the 2022 Napa Valley Cabernets: They are fabulous. I can assure you, from personal experience, that 2022 will be a banner year.
Second, the US economy is doing just fine.
Last Thursday, while I was tasting those 2022 Cabs up in the Sonoma and Napa Valleys, the Bureau of Economic Analysis (BEA) released the ‘first estimate’ of GDP for the second quarter of 2024. The verdict: ‘Real’ gross domestic product increased at an annual rate of 2.8% during the second quarter. In their most recent ‘dot plot’ forecast, the FED had expected 2024 GDP (for the entire year) to grow by 1.4%. This Q2 reading is double that rate. Impressive.
As I always do, let me shine a light on this fact: The BEA tabulates and releases two (2) GDP numbers, not one. The media highlights only the ‘real’ GDP growth figure. I feel it’s important to recognize and discuss both. So while the annualized ‘real’ GDP growth figure was 2.4% for the quarter, the ‘current-dollar’ or nominal GDP growth number was 5.2% for the quarter! The difference between the ‘real’ and the ‘current-dollar’ figure, as always, is due to an inflation factor. The ‘real’ figure is an inflation-adjusted number. That inflation figure, known as the ‘personal consumption expenditures price index,’ or PCE index, measured 2.6% during Q2.
Welcome to this week’s Steak House Index update.
Why You Should Care: The US economy and US dollar are the bedrock of the world’s economy.
But is the US economy expanding or contracting?
Expanding …. By the end of Q2, 2024, in ‘current-dollar‘ terms, US annual economic output rose to an annualized rate of $28.63 trillion. After enduring the fastest FED rate hike in over 40 years, America’s current-dollar GDP still increased at an annualized rate of 4.8% during the fourth quarter of 2023. Even the ‘real’ GDP growth rate was strong … clocking in at the annual rate of 3.3% during Q4.
According to the IMF, the world’s annual GDP expanded to over $105 trillion in 2023. Further, IMF expects global GDP to reach almost $135 trillion by 2028 — an increase of more than 28% in just 5 years.
America’s GDP remains around 25% of all global GDP. Collectively, the US, the European Common Market, and China generate about 70% of the global economic output. These are the 3 big, global players. They bear close scrutiny.
The objective of this blog is singular.
It attempts to predict the direction of our GDP ahead of official economic releases. Historically, ‘personal consumption expenditures,’ or PCE, has been the largest component of US GDP growth — typically about 2/3 of all GDP growth. In fact, the majority of all GDP increases (or declines) usually results from (increases or decreases in) consumer spending. Consumer spending is clearly a critical financial metric. In all likelihood, the most important financial metric. The Steak House Index focuses right here … on the “consumer spending” metric. I intend the SHI10 is to be predictive, anticipating where the economy is going – not where it’s been.
Taking action: Keep up with this weekly BLOG update. Not only will we cover the SHI and SHI10, but we’ll explore “fun” items of economic importance. Hopefully you find the discussion fun, too.
If the SHI10 index moves appreciably -– either showing massive improvement or significant declines –- indicating growing economic strength or a potential recession, we’ll discuss possible actions at that time.
The Blog:
On a current-dollar basis, our annualized GDP level is now at $28.63 trillion. Take a look at this chart from Fred:
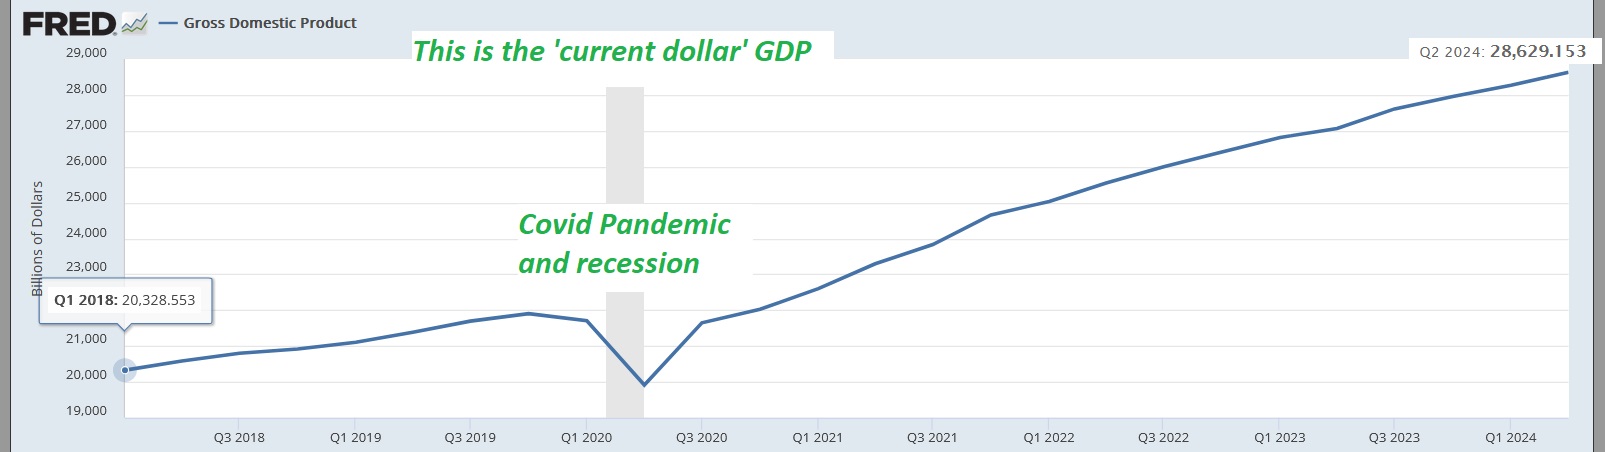
From January 1st of 2018 thru today, current-dollar GDP is up by almost 41%. In Q1 of 2018, the annualized GDP figure was $20.33 trillion.
How does that PCE index adjustment impact the number? Well, in Table 3 of the BEA report, we see the impact is quite significant. Using a “chained 2017 dollars” metric – meaning we remove all PCE inflation between 2018 and now from the GDP level, that $28.63 trillion falls back to just $22.92 trillion – a whopping 25% lower.
Which means that our ‘real’ annualized GDP has increased by only $2.59 trillion – just 12.7% – in the past 6+ years. That’s not very much. The rest of the 41% increase, then, is the result of inflation on prices and wages, and all goods and services.
This point bears repeating: American ‘real’ GDP grew by just 12.7% in the past 6+ years — which is quite paltry when compared to the 41% increase when measured in current dollars. The difference is staggering.
And this is one reason why its important to view GDP growth thru both the ‘real’ and the ‘current-dollar’ lens.
Another reason is this: Many, if not most, economic figures are not inflation adjusted. They are reported in ‘current-dollars’ only. Which means you may get a distorted economic or financial view if you are unaware of the lack of distinction. Apparently, much of the media is, in fact, unaware.
For example, consider corporate profits. Here’s the latest chart, courtesy of Fred again, updated at the end of June:

Using an identical time period as the GDP chart above, between Q1 of 2018 thru Q1 of 2024 (note: this is one quarter shy of the GDP number simply due to reporting dates) the ‘current-dollar’ after-tax corporate profits, for all US corporations combined, increased from about $1.987 trillion to a bit over $3.168 trillion – a 59% increase.
Wow, right? A 59% increase in corporate after-tax profits in just 6 years is, by any measure, quite large. In fact, it’s large enough to garner quite a bit of media attention: Google the phrase “corporate greed” and you’ll find plenty of on-line accounts of how corporate greed is running amuck, triggering a massive inflation surge, and making the lives of many Americans far more difficult.
Perhaps. But if we apply the same PCE deflator to the corporate profits number as the government uses for the ‘real’ GDP number, we see a very different story. Using that same inflation ‘deflator,’ we see that ‘real’ corporate profits increased to $2.54 trillion during that 6 year period – an increase of just 27.6%. In other words, yes, profits are up sizably over the past 6 years, but after adjusting the most recent annualized corporate profit figure by the inflation factor, the 59% exorbitant number shrinks by more than half, down to 27.6%. That’s certainly a respectable increase, but it’s a far cry from 59%.
Said another way, in “chained 2017 dollars” corporate profits are up only 27.6%.
Am I suggesting this means media accounts of corporate greed are overblown? No. Corporate greed has always been a hobgoblin of capitalism and politicians. Which is why I find it somewhat ironic that Adam Smith, often called the “father of modern capitalism,” in his seminal book titled “The Wealth of Nations”, published around the time of the American Revolution, seemed to somewhat support the capitalistic concept of “greed” – sort of. Smith’s words from 1776:
“Every individual necessarily labors to render the annual income of society as great as he can. He generally neither intends to promote the public interest, nor knows how much he is promoting it. He intends only his own gain, and he is, in this, as in many other cases, led by an invisible hand to promote an end which was no part of his intention.”
Of course, it’s a far cry from an individual shopkeeper trying to increase prices and, thereby, his or her personal income, to a massive US corporate entity doing the same. Anyway, you decide for yourself: Is greed good? 🙂
Moving on, my only point here is that we must compare “apples to apples” when making economic or financial prognostications. Comparing a ‘real’ number to a ‘current-dollar’ figure is simply bad math.
Permit me another brief tangent: We all know one of the most common metrics used to measure the current health of the stock market is a price-earnings ratio, or P/E ratio. This metric is discussed constantly by financial analysts, and each analyst has his or her own opinion on if the market is “over priced” based on the P/E ratio. Here’s the interesting part: The P/E ratio of the S&P 500 is calculated using ‘current-dollar’ earnings from the 500 ‘member’ companies. The P/E ratio, and therefore stock market values, are both directly impacted by inflation. Said another way, if inflation is pushing up corporate profits, and as ‘current-dollar’ corporate profits are used in the P/E ratio calculation, then a meaningful percentage of stock market gains over time are the direct result of inflation. So, clearly, if you are a stock market investor seeking gains, while it may be hard to agree that “greed is good,” it’s clear that inflation very good. Assuming you’re looking for gains. 🙂
Here’s another interesting perspective on this point: The value of the S&P 500 is reported in ‘current-dollars’ and is not inflation adjusted. On Friday of last week, it closed at 5,459. On January 2, 2018, the first business day of 2018, the index closed at 2,696 so since that date, the S&P 500 index is up more than 102%. But if we adjust the increase using “chained 2017 dollars” the post-inflation adjusted value is not 5,459 but 4,370. In other words, 1,089 points of the S&P 500 increase are the direct result of inflation. The ‘real’ value of the S&P 500 is 4,370; the ‘current-dollar’ value is 5,459.
Of course, we never hear any such comment or value adjustment in the media. It simply isn’t done. But this is a very useful lens thru which to view official economic numbers. Inflation directly impacts not just milk and bread, but GDP and stock values, too.
Let me return to my “apples to apples” comparison comment above. I use this same approach with I am tasting new wines. For a tasting, I will typically have 2 or 3 glasses in front of me. Only by comparing 2 or 3 wines, side-by-side, am I able to discern meaningful differences. Side-by-side, moving back and forth between glasses, I am able to distinguish the best of the bunch.
And now that we’re talking about wine, let’s head over to the steak houses.
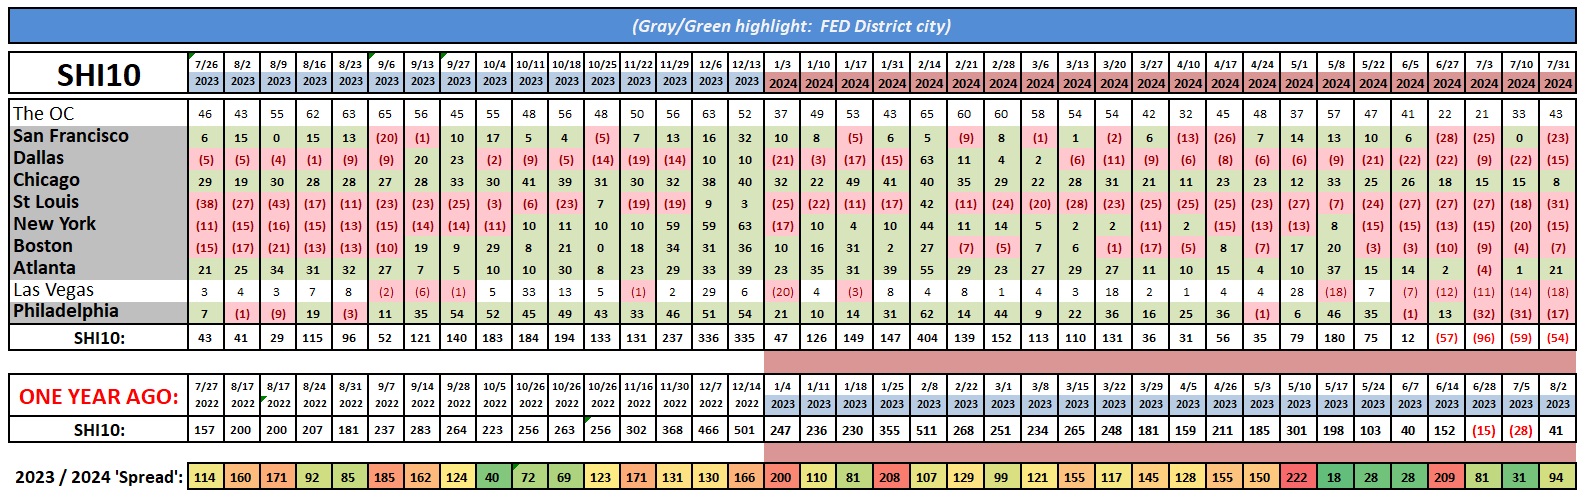
Interesting: The red ink continues. This week, 7 of our 10 SHI cities are as red as a rare T-Bone. Reservation demand in the OC and Atlanta are holding up fine, but Chicago appears to be weakening, and every other city is flashing bright red. The SHI10 is not aligned with the Q2 GDP growth figures. Frankly, if I was using the SHI10 as my sole economic barometer, I would have predicted a much lower ‘current-dollar’ growth rate in Q2 than the reported 5.2%. Regardless, while this week’s reading is actually 3 full weeks from the prior litmus test, the two SHI40 numbers are almost identical.
In contrast to the Steak House Index is the Atlanta FED ‘GDPnow‘ metric which, as of July 26th, was predicting a Q3 GDP growth figure of 2.8%. That’s a strong read. Who’s right? The SHI or the GDPnow? Probably neither. This is why it’s critically important to have numerous traditional and alternative metrics to track the economy. Which is precisely what we do here at the Steak House Index.
I’ll finish today with a brief comment on the widely anticipated FED rate cut. The futures market expects a 25 basis point cut after the September FED meeting. Economists seem to have the same expectation:
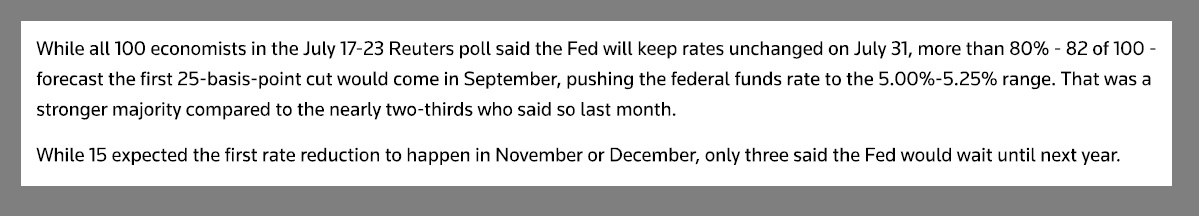
While I generally agree with the economists, one can make a compelling argument for the FED to keep rates unchanged.
Yes, the employment picture is softening. From a ‘low’ of 3.4% in January of 2023, the unemployment rate has been trending upward, most recently at 4.1% in June. This trend should be a concern of the FED, as ‘full employment’ is one of their two mandates. The trend in all inflation metrics is clearly down, too. The FED can take comfort here. However, a ‘real’ 2.8% GDP growth rate, along with a 5.2% ‘current-dollar’ growth rate, surely suggest the American economy is doing just fine with rates where they are.
However, these high-level comments shadow the detail deeper within the numbers. Separating the American consumer by income quartiles, the lower two (2) are clearly struggling under the burden of high rates and higher costs. They can use some relief. It’s time for the FED to begin their move toward lower rates. No, I’m not looking for, nor expecting, a large cut. 25 basis points would be a good start. And from there, if the FED asked my opinion, I would maintain a ‘data-dependency’ as time passes.
Expect a 25 basis point cut in September. It’s time.
<:> Terry Liebman


