
SHI 8.20.25 – Our Economy in a Box

SHI 8.6.25 – “You’re Fired!”
August 6, 2025
SHI 8.27.25 “A Curious Kind of Balance”
August 27, 2025
A Bloomberg article titled, “What Declining Cardboard Box Sales Tells Us About the US Economy,” made this contention:
“Sales of corrugated cardboard used to make boxes are slumping, signaling that retail demand across industries may be due for a correction.”
Well that’s not good. But is it accurate?
As you know, we use the Steak House Index as an alternative economic indicator to help us interpret and forecast economic trends. Are “box sales” another barometer, inasmuch the majority of GDP growth is generated by consumer consumption? After all, all the stuff we buy on-line comes in a box, right?
“
70% of GDP growth
is driven
by consumer spending.“
“
70% of GDP growth
is driven
by consumer spending.“
So are box sales another solid alternative economic index we can use?
Copilot seems to think so. When asked that question, Copilot said,
“That’s a sharp question, Terry—and yes, tracking box sales (especially corrugated cardboard) can offer surprisingly useful clues about GDP growth. It’s not a silver bullet, but it’s a classic example of a real-economy leading indicator.” Copilot even added, “Alan Greenspan reportedly watched box shipments as a real-time economic pulse.”
Interesting. FED Chair Greenspan liked this metric. Let’s explore further.
Welcome to this week’s Steak House Index update.
If you are new to my blog, or you need a refresher on the SHI10, or its objective and methodology, I suggest you open and read the original BLOG: https://www.steakhouseindex.com/move-over-big-mac-index-here-comes-the-steak-house-index/
Why You Should Care: The US economy and US dollar are the bedrock of the world’s economy. But is the US economy expanding or contracting?
Expanding … according the ‘advanced’ reading just released by the BEA, Q3, 2024 GDP grew — in ‘current-dollar‘ terms — at the annual rate of 4.7%.
The ‘real’ growth rate — the number most often touted in the mainstream media — was 2.8%. In current dollar terms, US annual economic output rose to $29.35 trillion.
According to the IMF, the world’s annual GDP expanded to over $105 trillion in 2023. Further, IMF expects global GDP to reach almost $135 trillion by 2028 — an increase of more than 28% in just 5 years.
America’s GDP remains around 25% of all global GDP. Collectively, the US, the European Common Market, and China generate about 70% of the global economic output. These are the 3 big, global players. They bear close scrutiny.
The objective of this blog is singular.
It attempts to predict the direction of our GDP ahead of official economic releases. Historically, ‘personal consumption expenditures,’ or PCE, has been the largest component of US GDP growth — typically about 2/3 of all GDP growth. In fact, the majority of all GDP increases (or declines) usually results from (increases or decreases in) consumer spending. Consumer spending is clearly a critical financial metric. In all likelihood, the most important financial metric. The Steak House Index focuses right here … on the “consumer spending” metric. I intend the SHI10 is to be predictive, anticipating where the economy is going – not where it’s been.
Taking action: Keep up with this weekly BLOG update. Not only will we cover the SHI and SHI10, but we’ll explore “fun” items of economic importance. Hopefully you find the discussion fun, too.
If the SHI10 index moves appreciably -– either showing massive improvement or significant declines –- indicating growing economic strength or a potential recession, we’ll discuss possible actions at that time.
The Blog:
As I said in the intro, a recent Bloomberg article titled, “What Declining Cardboard Box Sales Tells Us About the US Economy,” made this contention: “sales of corrugated cardboard used to make boxes are slumping, signaling that retail demand across industries may be due for a correction.”
You can read that article by clicking HERE. (I hope it’s not behind a pay wall.)
According to that article,
A nontraditional economic indicator, sales of the corrugated cardboard used to make the boxes that transport everything from doughnuts to dishwashers are slumping, signaling that retail demand across industries may be due for its own correction in the not-too-distant future.
US box shipments—that is, volumes of empty packaging materials sold to retailers, which in turn use them to ship orders to warehouses, storefronts and Americans’ doorsteps—fell to the lowest second-quarter reading since 2015, according to data from Fibre Box Association, a trade group. (Corrugated cardboard also goes into other items, such as 3D advertising displays, but since the vast majority is used for packaging, the industry tends to use “box shipments” and “corrugated cardboard shipments” interchangeably.)
Which is concerning. If true. So is it? Along with the SHI40 should we be tracking box sales? Can this be another “alt econ” metric that we can use as a gauge and barometer of US economic and GDP performance? Could a “box sales index” be another predictive indicator for future GDP performance?
I think the answer is no.
Dr. Greenspan may have been a fan of tracking box sales, but I am less convinced. Perhaps my reluctance has more to do with the nature of today’s American economy vs. what the one Greenspan had to manage. Today’s economy is a bit different than 25 years ago: Last year, in 2024, goods-producing production accounted for approximately 16.7% of US GDP, totaling $4.87 trillion out of a $29.2 trillion economy; in the consumer spending segment of GDP, 21.4% was “spent” on goods — the balance, on services.
Back at the turn of the century, the “goods” segment was about 10% larger. Goods manufacturing and goods consumption, as a percentage of GDP, continues to fall. Which means, effectively, box demand is down — and trending downward further.
Ironically, at the same time, people are “moving” less. Yes, more folks are staying put. Where they currently live:
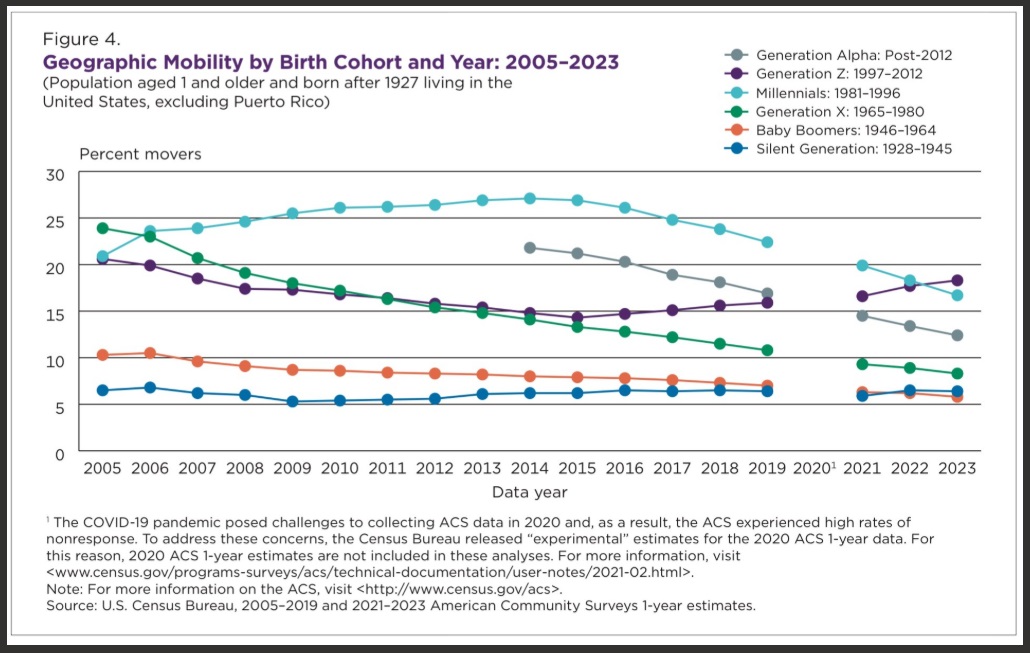
It makes sense that the “Silent Generation” and those Boomers — yes, I am one of those Boomers — are staying put where they are. Moving is not easy … and they are not young.
But what’s going on with Millennials? After peaking around 2015 with mobility about 27%, their wanderlust is way down. Same with Gen Alpha. Staying put. Why? I don’t know … but I do know one thing: Fewer moves means lower demand for the cardboard box.
Finally, if we put the metrics to the test and pull down actual data for the production of “paperboard containers” vs. retail sales over time, we actually see an inverse correlation.

Here’s my take-away for you: Approach even prominent sources like Bloomberg with a degree of skepticism. You simply can’t take everything you read at face value. Even my blog. 🙂
Our economy is a massively complex machine. As one metric points toward an economic contraction, simultaneously others point to continued expansion and growth. Remember, almost 165 million people are working steady jobs. Unemployment is very low by historic standards. Consumers are spending: Consumer spending metrics are rising. As a result, corporate profits are up and rising — and are projected to rise even more:

Growing corporate profits may seem counterintuitive at the present, given the tariff and other economic headwinds we face today, but once again, our economy is far more complex that at first glance. So far, little of the tariff bill has been passed on to the consumer. That will likely change some. Further, many analysts feel “foreign exporters” will gradually absorb more of the cost — and they have some here there, too, by an improving foreign exchange situation.
Of course, economic volatility is a constant. You would be hard pressed to find a lengthy time-period at any time in history where volatility remained low for a long period of time.
Perhaps that fact is nowhere more apparent than within one of the most visible stock market valuation metrics known as the CAPE index. Developed by Nobel prize winning economist Robert Schiller, many consider it to be the gold standard of measurements, as it essentially incorporates 10-years of corporate earnings in its calculation, thereby “smoothing” out any peaks or valleys. Further, it adjusts those earnings by stripping out the effects of inflation; thus, the resulting metric only measures corporate earnings generated without the benefit of an inflationary tailwind.
Here’s a chart I’ve created (yes, with some help from my good buddy “G”) that brackets the “Dot Com Bust” era, from 1990 thru today:
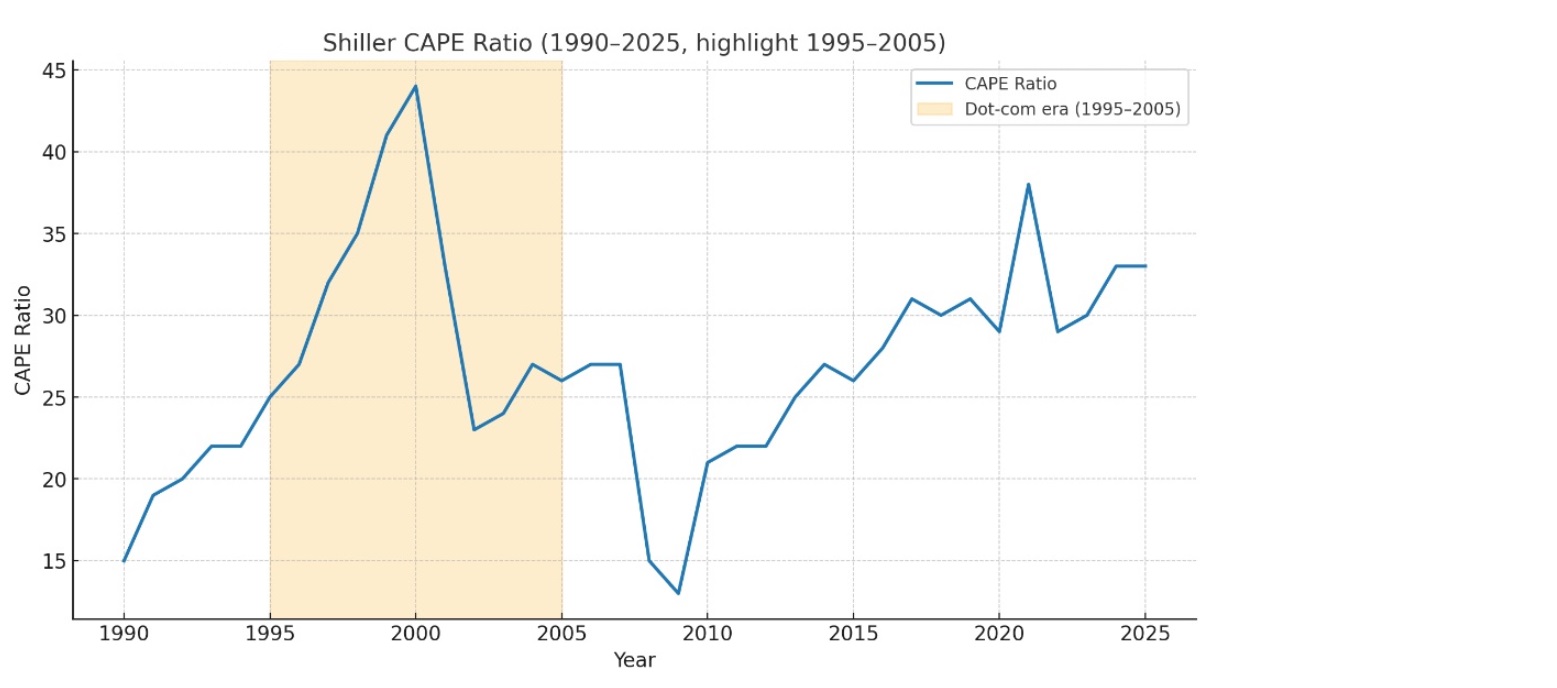
As my long-time readers know, I’m not a huge fan of “real” numbers — meaning, those where the inflation impact is stripped out — unless all of the metrics are “real.” But here, at least, the calculation (the ratio) is consistent in its use of real vs. current-dollar numbers. So I don’t have too much of an issue with the conceptual framework.
One could argue the rising CAPE ratio is troublesome. I would take the opposite side of that debate: Sure, the CAPE is high right now. Perhaps even higher than most times in history — with the exception of the bubble caused by the Dot Com collapse. But I feel the rate of corporate earnings growth supports today’s value. A 10-year earnings window is long — things are changing fast today.
Ultimately, as with all such things, we need to decide if “this time is different” to paraphrase a book title by Ken Rogoff, another economic luminary. Is it? It’s a great question because back in 1995, that was the belief about the newest shiny object — the internet! The internet promised to convert all brick and mortar business into digital gold on-line and everyone was fighting to be first to market with the most users. Of course, as we now know, a large number of user eyeballs doesn’t necessarily convert to revenue and profitability.
As we all know, today’s shiny object is AI. And boy is it shiny. The biggest S&P companies will make capital investments, in 2025 alone, approaching $400 billion. These companies historically generate a ROE exceeding 25% per annum, suggesting they are expecting additional annual earnings, from these investments, of about $100 billion. This would be a very different outcome from that of the Dot Com “earning” and corporate bust.
Are analysts right? Is this time different? Time will tell, but I come down on the side of the analysts: I believe this time IS different. The AI revolution is not hype — it is real. Is there some hype wrapped inside? Sure. So be careful. But I firmly believe this is a transformational time in investment, American and world history.
Regardless, high level, while headwinds persist, the US economy continues to chug along. Even the Atlanta FED ‘GDPNow‘ forecast agrees with this position: Currently, they are projecting a ‘real’ 2.50% growth rate in Q3 GDP. Translating that number with a 2.5% inflation factor suggests annualized current-dollar GDP continues to rise at 5% or more. That’s cooking with gas!
Let’s see if there’s anything new at the steak houses.

Nope, not really. The numbers are still surprisingly consistent. Here’s the longer term chart.

Summing it all up, here’s what I believe today:
First, while the cardboard box “thing” is interesting, the data does not support it’s use as an alternative economic metric. Box sales do not appear correlated with economic activity.
Next, our economy is large, complex and humming along nicely. Yes, as always, there are storm clouds rolling around on the horizon, but for now, I feel generally good about the state of things from an economic growth perspective. If we get a 5% annualized ‘current-dollar’ growth rate in Q3, that will be phenomenal.
Finally, don’t get too caught up in all the hype. Don’t believe everything you hear out there. The American economy is a behemoth. The envy of the world. Relax. I’ll let you know if my opinion changes. 🙂


