
SHI 9.3.25 – BIG Numbers

SHI 8.27.25 “A Curious Kind of Balance”
August 27, 2025
SHI 10.2.25 – $2 Trillion
October 2, 2025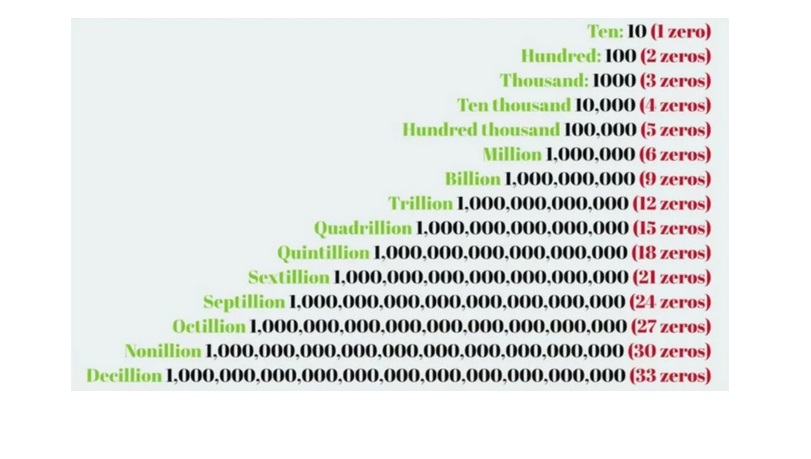
Big numbers.
Today, we are surrounded by big numbers. Huge numbers, in fact.
Consider global GDP: The ‘World Bank’ believes 2024 annual GDP expanded to over $111 trillion — $30 trillion of which comes from the US. That’s trillion with a ‘T’. Above, we see that’s a 1 followed by 12 zeros. According to the FED, the aggregate net worth of American households is almost $170 trillion.
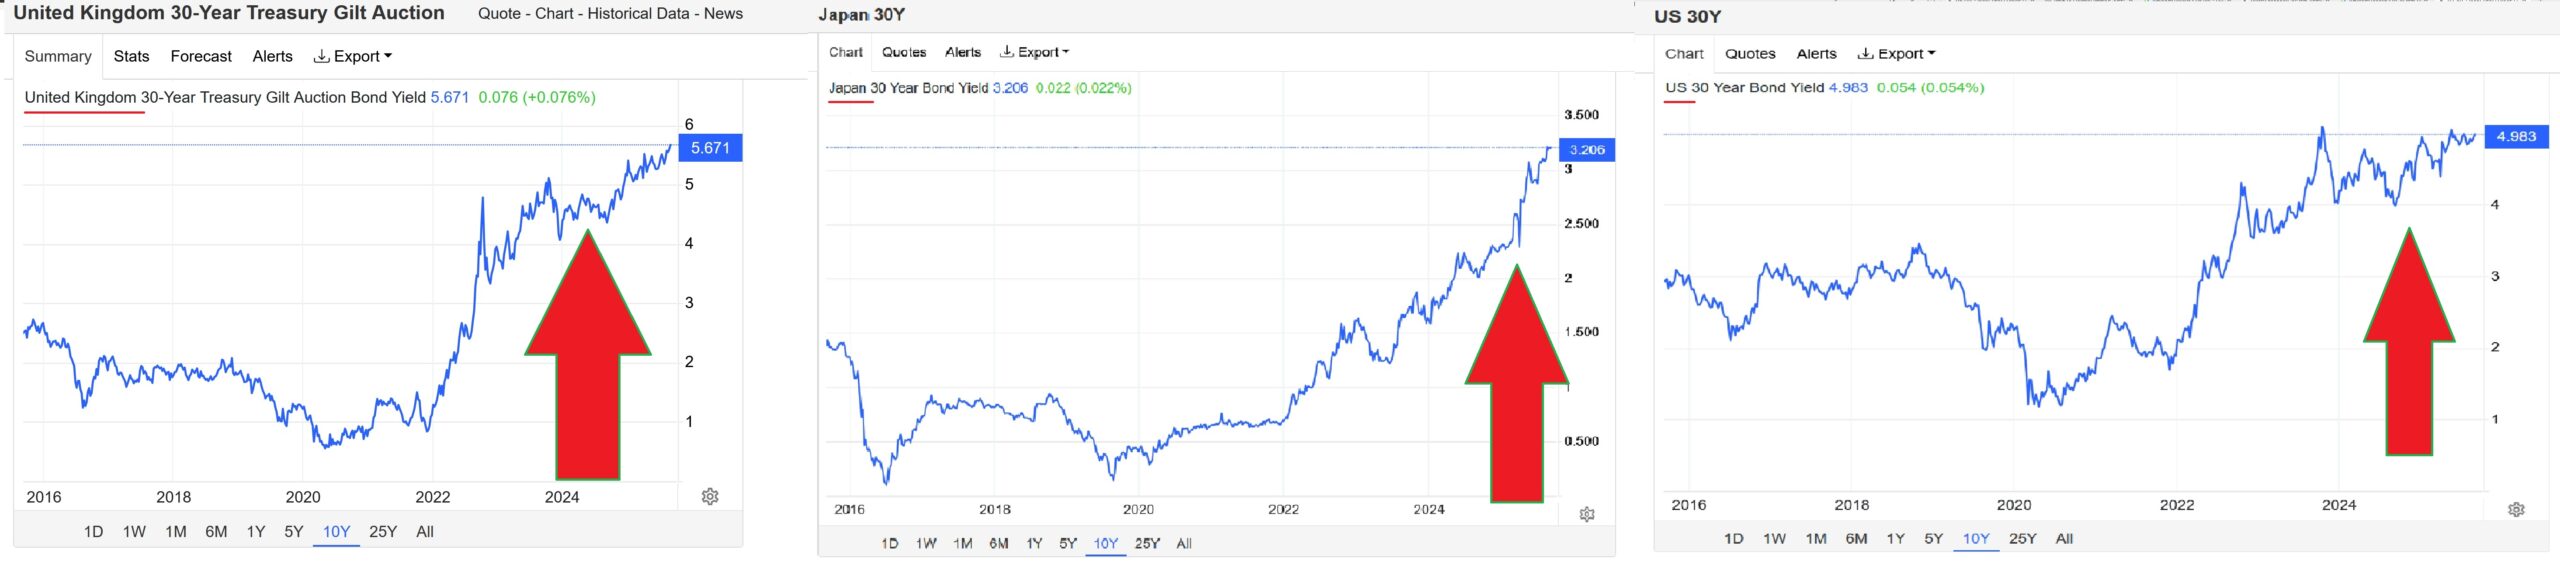
We see big numbers in the global debt markets, too. England’s 30-year bond — known as the ‘gilt’ — is now at its highest yield since 1998. It is yielding close to 5.7% today. US and Japan long-bond yields have also moved up significantly. US 30-year treasury yields are close to 5%
“
What’s the story with long-term rates?”
“
What’s the story with long-term rates?”
Good question. As usual, the answer is complex. Some experts point to “supply” — suggesting ongoing quarterly supply of new long-bonds exceeds investor demand for the debt. Governments across the developed world are all financing large deficits. Others experts suggest robust annual global GDP growth pushes rates up, as growth and inflation are commonly aligned. Perhaps.
And of course, there’s the other well known, oft discussed culprit: The sheer size of sovereign debt today. In the US, “debt held by the public” is about $30 trillion — about 100% of US GDP. In the UK, the number is about 2.7 trillion pounds — about 90% of their GDP. And in Japan? Public debt totals 1.324 trillion yen — about 235% of their annual GDP. These are huge numbers.
Of course, we all know the FED will likely cut the FFR by 25 basis points on September 17th, right? Probably.
Finally, at the same time many developed nations are floating new debt, the FED, the Bank of England and the Bank of Japan are all actively shrinking their balance sheets, shedding a sizable portion of the sovereign debt they accumulated during Covid, when “quantitative easing” was the global economic plan. No longer. Central banks have been in tightening mode since 2022. Shrinking the balance sheets pulls capital out of the markets, putting upward pressure on rates.
So there are lots of cross currents right now. Where will this end? What will happen to long-term rates in the coming months?
Welcome to this week’s Steak House Index update.
If you are new to my blog, or you need a refresher on the SHI10, or its objective and methodology, I suggest you open and read the original BLOG: https://www.steakhouseindex.com/move-over-big-mac-index-here-comes-the-steak-house-index/
Why You Should Care: The US economy and US dollar are the bedrock of the world’s economy. But is the US economy expanding or contracting?
Expanding.
The ‘real’ growth rate — the number most often touted in the mainstream media — was 3% in the last quarter. In “current dollar” terms, US annual economic output rose to $30.331 trillion.
According to the World Bank, the world’s annual GDP expanded to over $111 trillion in 2024. Further, IMF expects global GDP to reach almost $132 trillion by 2030. The US? Various forecasts project about $37 trillion for American GDP in 2030 — I believe it could be even higher.
America’s GDP remains around 28% of all global GDP. Collectively, the US, the European Common Market, and China generate about 70% of the global economic output. These are the 3 big, global players. They bear close scrutiny.
The objective of this blog is singular.
It attempts to predict the direction of our GDP ahead of official economic releases. Historically, ‘personal consumption expenditures,’ or PCE, has been the largest component of US GDP growth — typically about 2/3 of all GDP growth. In fact, the majority of all GDP increases (or declines) usually results from (increases or decreases in) consumer spending. Consumer spending is clearly a critical financial metric. In all likelihood, the most important financial metric. The Steak House Index focuses right here … on the “consumer spending” metric. I intend the SHI10 is to be predictive, anticipating where the economy is going – not where it’s been.
Taking action: Keep up with this weekly BLOG update. Not only will we cover the SHI and SHI10, but we’ll explore “fun” items of economic importance. Hopefully you find the discussion fun, too.
If the SHI10 index moves appreciably -– either showing massive improvement or significant declines –- indicating growing economic strength or a potential recession, we’ll discuss possible actions at that time.
The Blog:
England’s 30-year bond — known as the ‘gilt’ — is now at its highest yield since 1998.
While their up-move might be the largest, they are not alone. 30-year yields are up significantly in all developed and heavily indebted nations:
Interestingly enough, the higher yields are attracting borrowers from across the globe. According to Bloomberg, they are “rushing into the bond market, with more than $128 billion of sales so far this week, and investors are lapping up the new debt.”
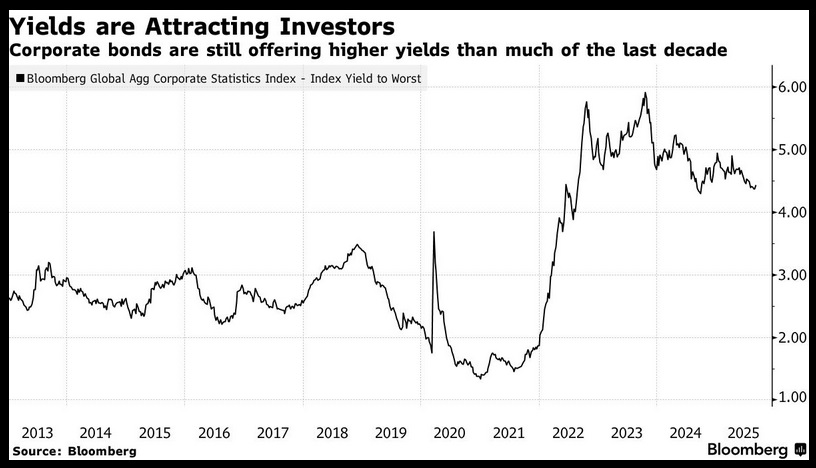
In the US, 13 issuers issued high-grade bonds today, one day after 27 issuers sold $43.3 billion of debt altogether, the third largest amount in volume ever. Europe also had record debt sales of more almost 50 billion euro. Yields are UP … and apparently, they are attractive.
This was not the case just 5 or 6 years ago. My long-term readers may remember my numerous blog posts covering negative interest rates. Yes, there was a time when a bank in Norway or Sweden might pay you to borrow money from them! Can you imagine that? Here’s a blog I wrote on the topic back in 2019:
https://steakhouseindex.com/shi-8-6-19-staying-positive-in-a-negative-world/
But no longer. No, today, you will definitely pay the bank. A lot.
Credit card rates are about 22%. Ouch. Small business financing rates hover between 11% and 14%. And 30-year home loans rates — while down a bit — are still slightly north of 6.5%. Ouch again. These rates are all high — and they are not getting any help from the federal government. At the same time the US Treasury plans to finance almost $3 trillion during ‘fiscal’ 2025 (some new, some a refi of older Treasury debt) — adding close to $2 trillion to the existing pile of debt, the FED is shrinking their balance sheet:
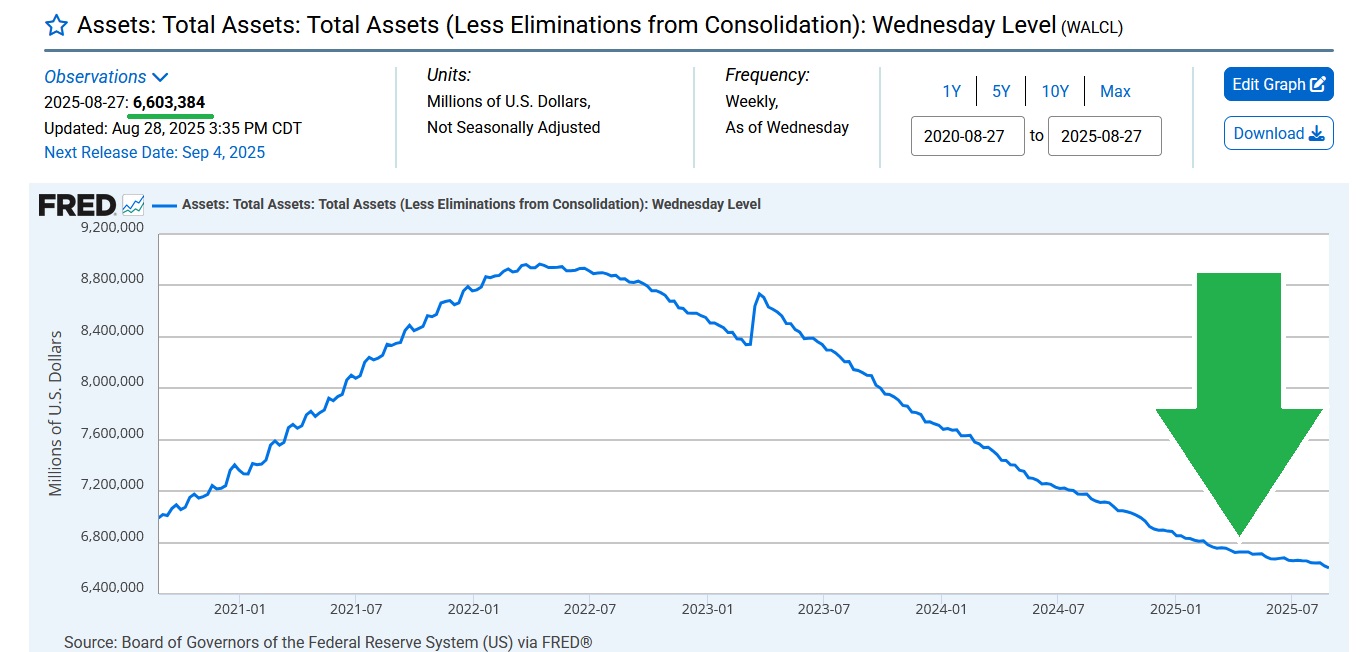
After peaking near $9 trillion in April of 2022, the FEDs balance sheet is now down to a paltry $6.6 trillion — a reduction of $2.4 trillion in a bit more than 3 years.
The Bank of England is also shrinking their balance sheet, thru a combination of letting bonds mature and actively selling them. After peaking near 900 billion pounds, their efforts have reduced their asset balance to just under 600 billion pounds. The Bank of Japan has not actively sought to reduce the size of their holdings, but they have stopped adding to the already large pile.
Further, as GDP growth remains relatively robust across the globe, no developed nation is discussing an end to the “quantitative tightening” in place since about 2022. Central banks don’t see the need, as looser monetary policy stimulates economic activity — and they feel there is no need for that.
So, yeah, there are definitely headwinds right now holding long-term rates aloft. Long term rates effectively reflect an equilibrium point where a borrower and a lender will transact. When an economy has a lot more capital “sloshing around” to paraphrase Ben Bernanke, and an a much smaller borrower pool, supply far exceeds demand. And long term rates fall. When the opposite is true — and there is far more debt for sale than there is demand, long-term rates will rise.
That’s essentially what’s happening today. Central banks are shrinking balance sheets, pulling capital out of the market. Governments are borrowing more than ever, effectively increasing global debt levels at the same time. The combined effect, unfortunately, is upward pressure on long-term rates.
As I’ve said before, 2025 is a strange year, economically speaking. In addition to the huge rates and huge sovereign debts, we have huge tariff issues, trade challenges, supply chain disruption, and court challenges — the likes of which we’ve never experienced before. I can’t forecast where all this will shake out, but there is no lens thru which I can say these effects are positive for the US economy.
So, in the final analysis, as it often does, it will come down to the actual performance of the US economy. So how is our economy doing? Good news! The FED just released their latest ‘Beige Book’ report!
You’ll recall the Beige Book, which is officially titled Summary of Commentary on Current Economic Conditions—is one of the Federal Reserve’s key publications. Its purpose is to provide a real-time, anecdotal snapshot of the U.S. economy that helps guide monetary policy discussions at the Fed’s Federal Open Market Committee (FOMC) meetings. Here’s a summary of today’s report:
<> Economic activity is sluggish or flat:
Hmmm … that’s not promising. Most of the 12 districts reported little if any change in economic activity; some reported slowing activity
<> Labor market is weak but stable:
Again, that’s not good. Stable is OK, but the report went on to say there is a “noticeable slowdown in hiring.” Not good.
<> Consumer behavior & Spending:
The report said consumers are cautious; and, spending levels are flat or declining. Not good.
It’s so interesting to me when we contrast these comments to the massive capital expenditures from the hyperscalers. They are spending gobs of money … even as the consumer slows. So, the question remains:
Where are long-term interest rates going? Up or down?
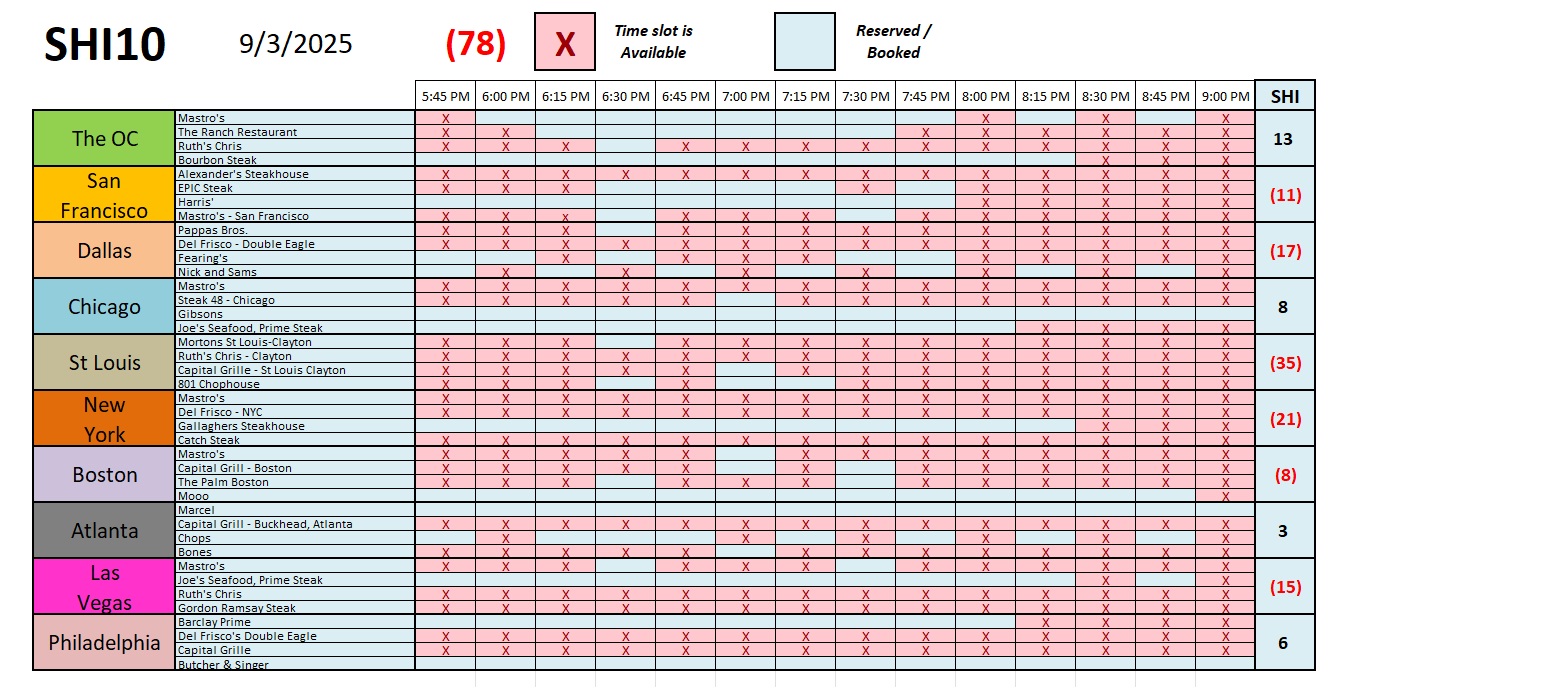
In the final analysis, perhaps as it always does, it will come down to the US economy. Will the headwinds highlighted in the FED Beige Book prove insurmountable, triggering an economic slowdown later this year? Or will the hyperscaler spending spree, and the anticipated spike in US labor productivity from the associated AI implementation, be adequate to fuel a continued US expansion? Unfortunately, no one can tell at the moment. So let’s see what the Steak Houses are telling us. Maybe the answer is on the grill at Mastros.
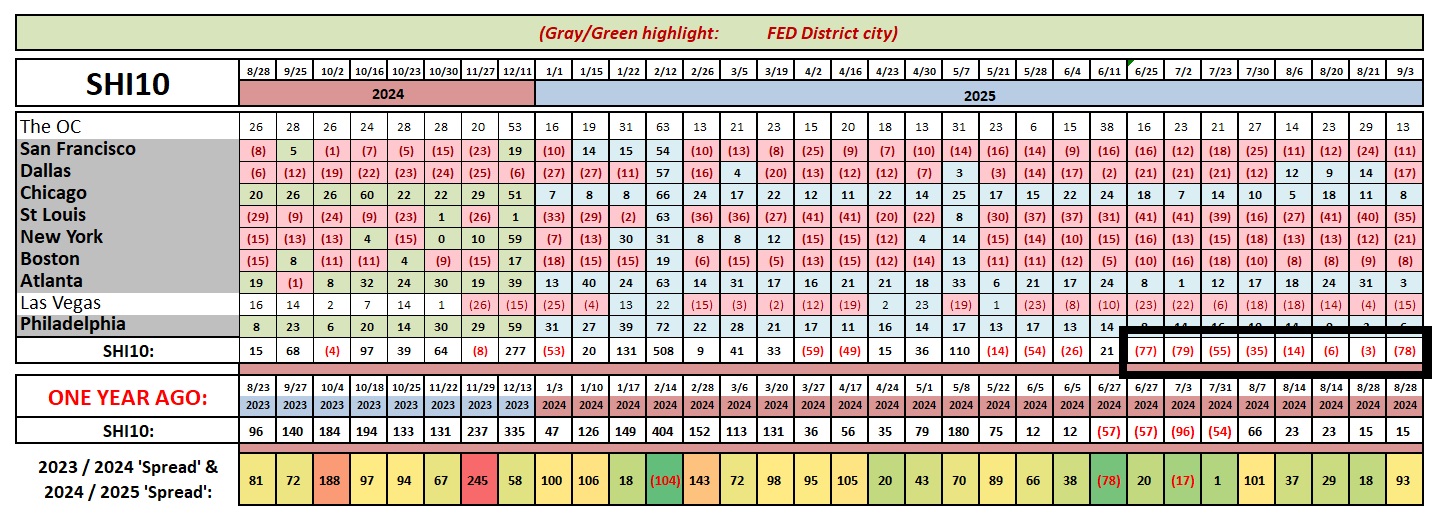
Those numbers in the black box above are about as lukewarm as the Beige Book comments. This week, the SHI10 came in at a rather weak negative 78. Not good. If the only indicator I followed was the SHI, I might be more worried than I am. There is clearly turbulence out there … and the direction of the economy seems hard to predict at the moment. I wish I had better news.
Here’s the weekly chart.


