SHI 9.3.25 – BIG Numbers
September 3, 2025SHI 10.8.25 – Zero-Sum Game?
October 8, 2025
This blog is the first of a multi-blog series on artificial intelligence.
More specifically, this series will center on the question of IF
a bubble has – or is – forming within the financial markets,
as the direct result of AI hype and infrastructure investment.
This first blog will frame the discussion.
The following week, I’ll present divergent facts that I believe both support and debunk the claim.
And I’ll wrap up with a third blog where I will share and support my conclusion – bubble or not. To be clear: This conclusion will be my opinion alone. You will have your own. And we are all entitled to have one! Welcome to America! 🙂
Regardless, opinions abound. Stock markets are at or near record highs. I suspect you’ve heard P/E ratios and the Shiller CAPE are both quite elevated. The “Buffet Indicator” is VERY high by historic standards. And don’t get me started on Palantir – probably the most over-valued, “main stream” stock in the history of stocks – which boasts an almost 600 P/E ratio.
Closer to earth, the “Magnificent 7” are also extremely expensive by historic metrics. The amount of their ‘capital expenditure’ investments in data centers and related AI infrastructure are absolutely staggering in amount. You may not be familiar with some of these indices or topics. Don’t worry, that’s not overly important. What is important is the fact that they are all pushing up against the ceiling.
That fact that is causing many market analysts, investors, and media to ask, “Is this a bubble?”
Clearly, this is a question we need to ask. Trillions are at risk. Trillions can be made … or lost.
A “popping bubble” is extremely bad for financial markets, the US economy at large – for all of us, frankly. Prices collapse. Liquidity evaporates. Credit access can become far more difficult. And then we have contagion effects: A collapsing stock market can spread to currency markets, the housing markets, commercial property, etc. It’s hard to say how far the knock-on effects might spread.
You remember that a stable and growing ‘consumer consumption’ metric is critical to GDP growth? Well, as the wealthiest top 10% of Americans are currently fueling 50% of all consumer consumption, a popping bubble would deflate the ‘wealth effect’ the US economy is currently enjoying. So, this is an important question: There is no doubt we’re feeling “bubble-like tension” right now.
But is a bubble actually forming? If yes, how pervasive is it? If no, how should we view current trends? Let’s dive into today’s blog, Part 1 of the series, titled “$2 Trillion.”
Welcome to this week’s Steak House Index update.
Why You Should Care: The US economy and US dollar are the bedrock of the world’s economy.
But is the US economy expanding or contracting?
Expanding.
The ‘real’ growth rate — the number most often touted in the mainstream media — was 3% in the last quarter. In “current dollar” terms, US annual economic output rose to $30.331 trillion.
According to the World Bank, the world’s annual GDP expanded to over $111 trillion in 2024. Further, IMF expects global GDP to reach almost $132 trillion by 2030. The US? Various forecasts project about $37 trillion for American GDP in 2030 — I believe it could be even higher.
America’s GDP remains around 28% of all global GDP. Collectively, the US, the European Common Market, and China generate about 70% of the global economic output. These are the 3 big, global players. They bear close scrutiny.
The objective of this blog is singular.
It attempts to predict the direction of our GDP ahead of official economic releases. Historically, ‘personal consumption expenditures,’ or PCE, has been the largest component of US GDP growth — typically about 2/3 of all GDP growth. In fact, the majority of all GDP increases (or declines) usually results from (increases or decreases in) consumer spending. Consumer spending is clearly a critical financial metric. In all likelihood, the most important financial metric. The Steak House Index focuses right here … on the “consumer spending” metric. I intend the SHI10 is to be predictive, anticipating where the economy is going – not where it’s been.
Taking action: Keep up with this weekly BLOG update. Not only will we cover the SHI and SHI10, but we’ll explore “fun” items of economic importance. Hopefully you find the discussion fun, too.
If the SHI10 index moves appreciably -– either showing massive improvement or significant declines –- indicating growing economic strength or a potential recession, we’ll discuss possible actions at that time.
The Blog:
CNBC shared this chart on their Tuesday morning show:
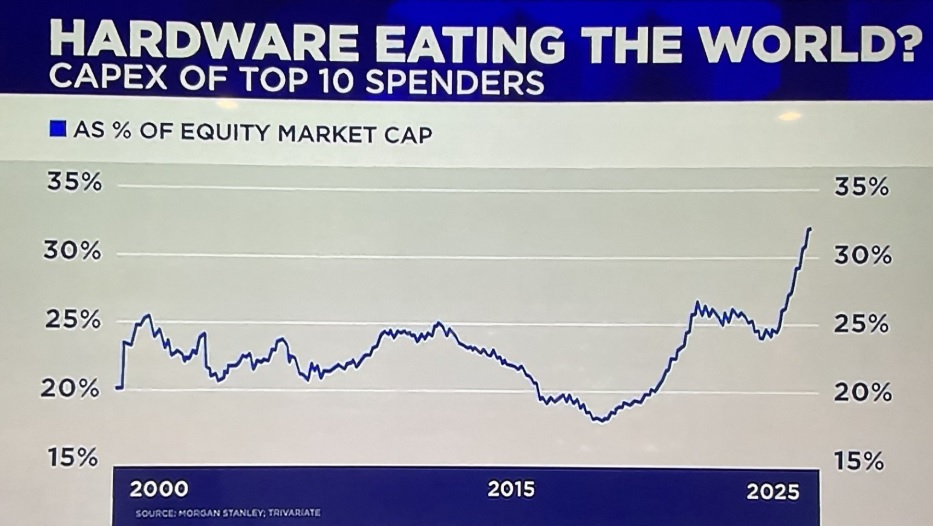
Since 2000, capital spending (CapEx) by the top 10 global companies hovered between 20% and 25% of their market capitalization. This level of spending was consistent for the 25 years leading up to 2025.
No longer. This year, things changed. CapEx is trending at levels unseen in decades.
To be clear, it is NOT only AI infrasturcture spending. Estimates suggest between 10-30% is directly related to the “on-shoring” of “high-value” manufacturing facilities. Ely Lilly is on-shoring 6 new pharma plants. Fujifilm Diosynth Biotechnologies is putting their finishing touches on a huge facility in NC containing 8 bioreactors costing billions. They also have a $3B ‘deal’ with Regeneron for biologics manufacturing at that same site. Semiconductor and chip fabs are popping up all over the US — construction in Phoenix is huge. The on-shoring movement is in full swing.
But the majority of this CapEx boom, I believe, is AI Infrastructure related.
To the “Is this a bubble?” question … the last time we say an explosion in CapEx similar in magnitude was, in fact, in the late 1990s. Yep. The Dot-Com bubble. That was clearly a bubble. We know because it popped. Badly. It’s worth noting that this 2025 CapEx boom is even larger.
Take a look at this comparative chart, put together at my request by my good friend ‘G‘:
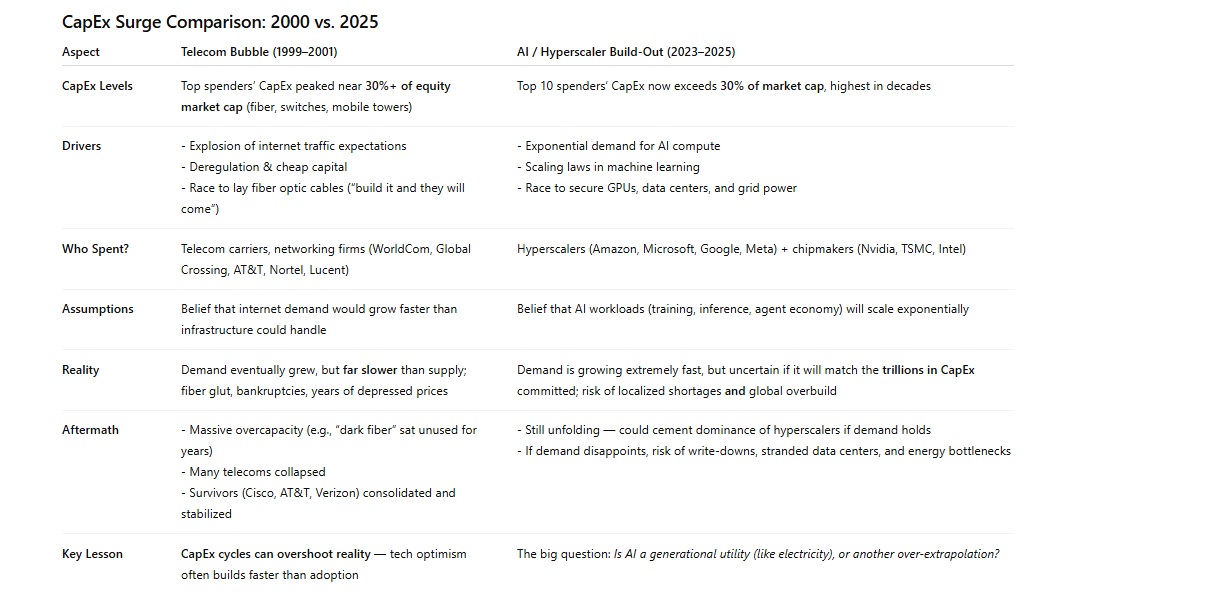
Is it odd to ask an AI engine to help me assess whether or not we’re in an AI-driven bubble? Naaa…. 🙂
The chart above does show a fascinating alignment between the activities and events during the ‘Dot-Com’ bubble and today’s activities. Shall we put one ‘check mark’ in the bubble column? 🙂
Sure. We can do that. And once done, let’s dive in deeper and try to get our arms around more data and facts, and try to get a sense about what’s happening out there right now.
I assume you know who ‘Bain & Company‘ is. In their 6th annual “Global Technology Report,” Bain forecasted:
Two trillion dollars in annual revenue
is what’s needed to fund computing power
needed to meet anticipated AI demand by 2030.
Wow. That’s 2 trillion with a capital “T”.
David Crawford, the head of Bain’s technology group, states “… it’s clear that AI is the defining disrupter of our time.”
Here’s a bit of good news: Bain is not suggesting the economy need to add another $2 trillion in revenue. Bain estimates companies are already using AI to improve earnings by 10% to 25%. However, even with AI-related savings, they believe the world is still $800 billion short to keep pace with demand. That’s not quite as overwhelming. 🙂
Bain is opining that AI is already benefiting many companies. The eggheads over at MIT don’t agree. In August of 2025, MIT published a report madinug this claim: “Despite an estimated $30–$40 billion being invested in generative AI, only 5% of companies saw rapid revenue gains from their pilot programs.”
Interesting. This seems diametrically opposed to Bain’s conclusions.
Another MIT study, published by their Sloan School of Management, commented, “researchers found that AI adoption in manufacturing initially reduced productivity before leading to long-term gains.” This is interesting as well. This suggests the adoption of AI creates more of a “J” curve for the company in the early days. Perhaps that’s the effect the first MIT report is observing? Perhaps.
Neither of these studies are overly positive. But I would suggest MIT is missing the point. Looking back might be interesting it’s but not overly constructive. We need to be looking forward. Which is more of what the Bain report does, focusing on topics like value evolution, strategic battlegrounds, and operational transformation.
If you want to dig deeper into the report, click HERE
In the report, Crawford opines, “By 2030, technology executives will be faced with the challenge of deploying about $500 billion in capital expenditures and finding about $2 trillion in new revenue to profitably meet demand.”
These are bit numbers, so let’s get some context to help get our arms around the size and scale. First, remember the US currently has an annual GDP of about $30 trillion. Keep this number in mind as we kick around others.
Next, know that the US GDP and economy – unlike many other developed economies around the world – is predominately a “service” economy. In other words, 75% of that GDP figure is generated by services and only about 25%, at present, is the result of ‘goods’ or products. The ‘goods’ group would include a car, washing machine, pen set, etc. You know – stuff. Finally, as my long-time readers know, about 70% of all economic activity in the US is consumer driven, or “consumed” by the consumer.
So if 70% of US GDP is the result of ‘consumer consumption’ – as we know – and 75% is a service economy, the math suggests that about half of all economic activity in the US is the result of services consumed by the consumer.
Before I move on, permit me a few caveats, mostly for additional context. First, these numbers are approximate – but close. So don’t quote me. They are also fluid and they are impacted by exogenous (meaning: originating outside) factors such as tariffs. But again, they are close and useful for this discussion.
Second in the caveat category, it’s important to note that the US economy is fairly unique. “Consumer consumption” in the economies of the UK and Japan are the closest across the globe – coming in somewhere in the low 60s as a percentage. Consumer consumption in the economies of France and Germany are closer to 50%, and China is only about 40%. The US consumer is the undisputed consumption king.
OK, so, to repeat, about ½ of all economic activity in the United States is the result of consumers “buying” services. About $15 trillion worth of them will be bought in 2025.
So finding an additional $2 trillion worth of consumption from the consumer is a big ask. But I don’t think that’s right. Even assuming the $2 trillion number is accurate, much of this additional income, or revenue, is likely to come from businesses incorporating AI into their business. And much is likely to come from governments – both here in the US and around the world. More on this later.
Did you know that OpenAI just became the most valuable private company in history? That’s right: Open AI’s valuation reached $500 billion this week after the firm sold an additional $6.5B of equity to three investors. The price they paid for the shares valued the company at $500B.
One would surmise that a company worth ½ a trillion dollars makes a lot of money, right? Well, as the company is still private and is not required to disclose financial results, it’s hard to get precise numbers. However, various analysts believe that during fiscal 2025, OpenAI should generate about $13 billion of income and incur a total loss of $8.5 billion.
Hmmm…wow. Let’s review: This company – OpenAI – is valued by intelligent investors at $500B, and yet is losing money today? That sounds pretty bubbly to me. Regardless, let’s keep going.
A thought struck me: Why don’t I ask ChatGPT – the consumer facing product from OpenAI – what he thinks this issue? Here’s the question I tossed into the engine:
“I heard OpenAI is now valued at $500B.
Yet the company will lose money in FY2025.
How can this value be justified?
Is this valuation reflective of a bubble?”
The reply was long and nuanced, but one of the comments was:
Yes — it has many qualities consistent with a valuation bubble, though “bubble” is not a binary label. It’s better seen as “valuation risk is elevated.”
But then it magnanimously offered up a few signs pointing in the ‘bubble’ direction, and also offered up some counterarguments.
The signs supporting a bubblish interpretations were the company’s large losses, the rapid multiple expansion, and a ‘narrative-driven’ investment thesis. The counter-argument essentially focused on the potential for continued exponential growth and this: If OpenAI becomes the “owner of the AI layer” then it is the long-term strategic player at a transformational time in world development.
The response from ChatGPT finished with this sentence: “You should emphasize that valuation is not the same as realized cash flows — $500B is a bet, not a guarantee.”
Interesting. That’s a big bet.
One serious challenge to realizing $2T additional revenue from AI implementation by the year 2030, as Bain suggests, is energy. Or more specifically, the lack thereof.
Consider this issue: How can the global infrastructure handle the weight of AI’s exponential compute/power demands against the physical limitations we currently face? Raw demand today seems to be outpacing physical improvements. Many US power grids and transmission line systems haven’t been expanded in decades. Natural gas pipeline expansions are rarely approved. Only two US nuclear power plants have come on-line in decades.
Twenty years ago, the total US electricity generation capacity was reported at 950 GW for “net summer capacity” – the peak demand period. Fast forward to today, that capacity has grown to only 1.275 GW – a piddly little 1.5% CAGR. The “mix” of energy sources, of course, has changed a lot. Coal use is down, wind/solar have increased, and we’re using more natural gas. But in total, overall production growth has been pretty flat. These are the facts.
So how will AI infrastructure get powered in the US? And across the globe?
Every hyperscaler is grappling with this issue right now. Amazon appears to be betting heavily on nuclear. They have announced deals with Talen Energy for almost 2,000 MW of nuclear power. And they are co-locating many new data centers “behind-the-meter” with a variety of nuclear power producers. In this context, behind the meter, or BTM, means that a data center is powered directly by an adjacent generation source — in this case, a nuclear power plant — without the electricity first flowing through the public utility grid.
Meta has acknowledged energy constraints will become bottleneck in AI expansion. Their strategy thus far appears to focus on building AI infrastructure on or near existing grids for easier integration into existing baseloads. Meta has signed a 20-year “power purchase agreement” or PPA with Constellation Energy to buy output from the Clinton facility in Illinois beginning in June of 2027. Under that agreement, they will both use existing output and expand the facility.
Microsoft seems to be betting more on renewable energy and grid upgrades, a strategy which at first blush might be discounting the ‘speed to market’ for new nuclear sources. Microsoft is pursuing existing – and even mothballed – nuclear facilities to bridge the gap: Constellation is an energy partner in Virginia, and they’ve even announced the “restart” of an 835-MW nuclear facility near Pennsylvania that was “retired” in 2019. They have signed a deal with Brookfield to deliver “renewable” energy from wind and solar. Finally, they have signed a deal with Helion Energy for a nuclear fusion facility. But there’s a hurdle here: This is a first-of-its-kind PPA inasmuch as fusion is still theoretical. But if the technology works – a big if – Microsoft is expecting 50 MW of power generation by 2028.
Clearly building an AI facility is one thing. Powering it is another. It stands to reason that these massive companies all “have a plan” – time will tell just how good their plan proves to be. But in the absence of data to the contrary, we’ll just have to assume these trillion dollar companies will figure this out.
So let’s assume they are built and powered up. Then what? How do these companies plan to monetize their massive investments?
Well, they tell us they have already begun to monetize their investments.
In their FY 2025 Q4 press release, Microsoft reported that “Azure surpassed $75 billion in revenue, up 34% from the prior year.” Azure is now generating more than 26% of their total annual revenue – which was about $282 billion in FY 2025. More specifically, recent company announcements suggest that about half of Azure’s growth can now be attributed to AI services. Additionally, Microsoft have begun to put AI features behind paywalls, or premium tiers, in their Office, Windows, and SaaS tools.
At Amazon, AWS is their monetization vehicle. Analysts suggest that AI services are already a multi-billion dollar and rapidly growing slice of AWS revenue. Further, Amazon currently offers a broad suite capabilities through AWS AI services. AWS AI Services are a collection of pre-built, ready-to-use machine learning (ML) and artificial intelligence (AI) tools. Unlike other AWS tools, here there is no ML expertise require.
Amazon does not specifically break out their AI-generated revenue within AWS. However, in their 2024 Annual Report, they mention that AWS “launched a slew of new infrastructure and AI services” as part of their growth narrative. Keep in mind their Q2 2025 AWS revenue was almost $31 billion – that’s only one calendar quarter, folks – an amount that represented 17.5% Y-O-Y growth. In some of their earnings conferences, they do attribute AI as a revenue driver: In discussing Q1 2025 results, Andy Jassy said that “generative AI / AI workloads contribute meaningfully to growth.”
It turns out that monetization at Meta is a bit harder to identify as most of their revenue is advertisement driven. However, in their Q2 2025 results, Meta reported their average price per ad increased about 9%, which the company linked to “stronger ad performance driven by internal AI systems.”
Regardless, Meta has publicly stated they will spend heavily on AI infrastructure in future years to support their lofty growth expectations.
Even assuming the entire infrastructure play does ultimately generate $2 trillion or more in revenue, could that outcome simply be “stealing” revenue from another segment of the US economy? In other words, could it simply be a net sum zero?
An argument against is the fact that the hyperscalers already have massive annual cash flow and balance sheets. The group of Microsoft, Google, Amazon, Meta, Apple and Nvidia currently throw off between $500-600 billion per year. Most of that cash flow is not AI driven. Most predated the AI infrastructure boom.
To ensure transparency here, let me point out that Nvidia’s net income is mostly the CapEx from the others in this group. So there is some overlap and circularity.
But the expenditures, themselves, drive GDP. $1 dollar spent on AI infrastructure recycles thru the economy many times — possible as much as 5X. I talked about this in more detail in a recent blog:
SHI 7.30.25 – Betting the Balance Sheet
To quote the sage author of that blog, “AI infrastructure, across America and the globe at large, is growing like mushrooms. The proportions are truly staggering. Analysts project will be a $1.1 trillion global data center spending spree by 2029, up from $430 billion in 2024.”
OK, we’ll end it there for today. I feel the issue is framed. Shall we visit the steakhouses?
So I’ve been gone for 3 weeks. No, I wasn’t traveling the US visiting steakhouses — but I did have a fantastic meal at a steakhouse on the cruise ship. While I was gone, interestingly enough, it looks like reservation demand picked up appreciably. This weeks positive SHI10 is the first since early-June. Here’s the longer term chart:
As we see above, there’s a lot more ‘blue‘ this week than ‘red.’ But beyond that observation, one week does not make a trend. Regardless, it’s nice to see some improvement.
Earlier this week I listened to an “Odd Lots” podcast where Rob Kaplan was interviewed by the Bloomberg team. Rob was the President of the Dallas FED until 2021 and currently serves as vice-Chairman of Goldman Sachs. Much of the show was interesting – you should consider listening in – but I found one segment particularly germane for today’s kick-off of the “bubble” conversation.
Rob commented that today’s economic data – metrics like the ‘jobs report,’ GDP, JOLTs, consumer spending, etc., reflect how economic conditions are today. Or, how they were in the very recent past. They are not predictive of the future. He opined that the US stock markets have that role: Rob believes that elevated stock prices today reflect the collective market’s opinion of future values, likely 3-5 years into the future.
In other words, yes, by historic measures the S&P500 is expensive. However, if, in fact, the markets are also discounting future income streams, predicting significant revenue and income lift from the massive AI spending we’re seeing today, then the markets may be fairly priced, or even cheap.
Is he right? Or is his interpretation wrong? This is the essence, I think, of this bubble discussion. If the massive CapEx results in significant increases in future corporate profits over the next 3-5 years, then these market prices are justified. If not, then they are not.
Tune in next week as we dig in further.
< Terry Liebman >


