SHI 10/15/25: Bubble? Transformative? Existential?
October 15, 2025SHI 11.5.25 – Miles and Miles of LARGE Debt Piles.
November 5, 2025
Permit me a final word on bubbles.
Financial bubbles form when excesses build up within a system. But identifying a bubble, or accurately timing it, are both notoriously difficult. Until, of course, that bubble pops.
And truth be told, bubbles are really not well understood.
For example, the spot price of gold recently peaked at about $4,400 an ounce. One year ago, on October 22, 2024, the spot price was $2,746 — about 60% lower.
I struggle to intelligently explain this increase. But many other experts attribute the price lift to a dramatic increase in global sovereign demand for gold, the continuous “debasement” of the US dollar from our ever expanding money supply, the ballooning size of developed-nation deficit spending, etc. Sure, these factors probably contribute somewhat to the demand and price increases. But not all … or, in my opinion, not much.
So is the gold-trade in a bubble? It might be.
Welcome to this week’s Steak House Index update.
Why You Should Care: The US economy and US dollar are the bedrock of the world’s economy.
But is the US economy expanding or contracting?
Expanding.
The ‘real’ growth rate — the number most often touted in the mainstream media — was 3% in the last quarter. In “current dollar” terms, US annual economic output rose to $30.331 trillion.
According to the World Bank, the world’s annual GDP expanded to over $111 trillion in 2024. Further, IMF expects global GDP to reach almost $132 trillion by 2030. The US? Various forecasts project about $37 trillion for American GDP in 2030 — I believe it could be even higher.
America’s GDP remains around 28% of all global GDP. Collectively, the US, the European Common Market, and China generate about 70% of the global economic output. These are the 3 big, global players. They bear close scrutiny.
The objective of this blog is singular.
It attempts to predict the direction of our GDP ahead of official economic releases. Historically, ‘personal consumption expenditures,’ or PCE, has been the largest component of US GDP growth — typically about 2/3 of all GDP growth. In fact, the majority of all GDP increases (or declines) usually results from (increases or decreases in) consumer spending. Consumer spending is clearly a critical financial metric. In all likelihood, the most important financial metric. The Steak House Index focuses right here … on the “consumer spending” metric. I intend the SHI10 is to be predictive, anticipating where the economy is going – not where it’s been.
Taking action: Keep up with this weekly BLOG update. Not only will we cover the SHI and SHI10, but we’ll explore “fun” items of economic importance. Hopefully you find the discussion fun, too.
If the SHI10 index moves appreciably -– either showing massive improvement or significant declines –- indicating growing economic strength or a potential recession, we’ll discuss possible actions at that time.
The Blog:
It’s hard to spot a bubble. Almost 100 years ago, the Dow Jones Industrial Average — known as the DJIA — reached a a pre-crash peak on September 3, 1929, closing that day at 381.17. The “crash” itself took place in October of that year, with two of the worst days titled “Black Thursday” and later, “Black Tuesday.” And we all know this event ushered in the “Great Depression.”
What is not widely known however, is this: On the last day of trading in 1928, the DJIA closed at 300. On the last day of 1929, that number was 248.48 … not too bad. But market exuberance carried the DJIA to its September 3rd peak and by the end of 1929 it finished the year 35% lower. That was bad. Very bad.
However, while the DJIA fell significantly in 1929, the fall from “peak to trough” was far worse — that was an 89% decline.
The aftermath, it seems, was even more damaging than the 1929 ‘crash’ itself. Yes, that was bad … but the worst was yet to come.
By ‘aftermath,’ in this case, I’m referring to the dismal crisis response from the FED and the Washington politicians — including the President of the United States. That’s my take-away from Andrew Ross Sorkin’s new book titled, “1929: Inside the Greatest Crash in Wall Street History — and How it Shattered a Nation.”
The response post-crash, it turns out, from every single player in the drama, was essentially nothing: Do nothing. Try nothing. And as a result, between 1930 and the beginning of 1933, like a massive tornado the negative feedback loop grew and consumed everything in its path. Ultimately that financial vortex completely destroyed consumer confidence, triggered bank failure after bank failure, and fostered the subsequent economic collapse.
This collapse played out over years. Not days in 1929. Years. The “crash” really wasn’t a crash, but a slow-moving slide into economic and financial oblivion.
I believe the lessons from the 1929 and thru the Great Depression are now well understood by the FED and our Washington leaders. That was evident in the response to the 2008 financial crisis.
Frankly, in my opinion, had they responded in 2008 identically to their counterparts in 1929, today I would be unable to write this blog because there would be no internet, no electricity, no economy, no means of payment, no society and no government. No, had they responded like they did in 1929, you and I would be living in caves wondering where our next meal might come from.
Consider this chart:
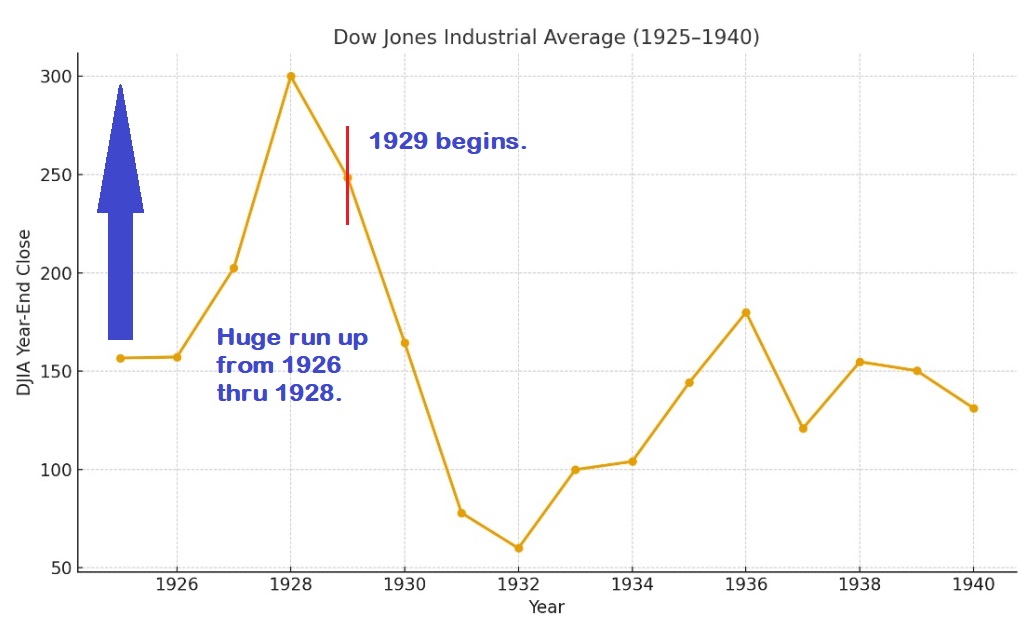
In his book, Sorkin tells us that margin debt first became available in 1919. Debt levels grew slowly at first, but later like a weed, fueling the DJIA to more than double. And then the bubble popped. I’m of the opinion that the FED of today would likely have prevented the Great Depression. To be clear, no, they would not have prevented the bubble pop, but they would have managed the aftermath far better. Today, the FED understands that “doing nothing“ quite likely caused the magnitude and duration of the Great Depression.
In any event, your take away from my epilogue here is this: I believe the government response to a current-day “crash” is the most important mitigating event in a bubble pop. Clearly, the response in 1930 was dismal. The response in 2008 was excellent. We can only hope our leaders will have the skills to handle the next one. Because if history has taught us anything, there will be a next one.
As Mark Twain once quipped, “History doesn’t repeat itself, but it often rhymes.” Indeed.
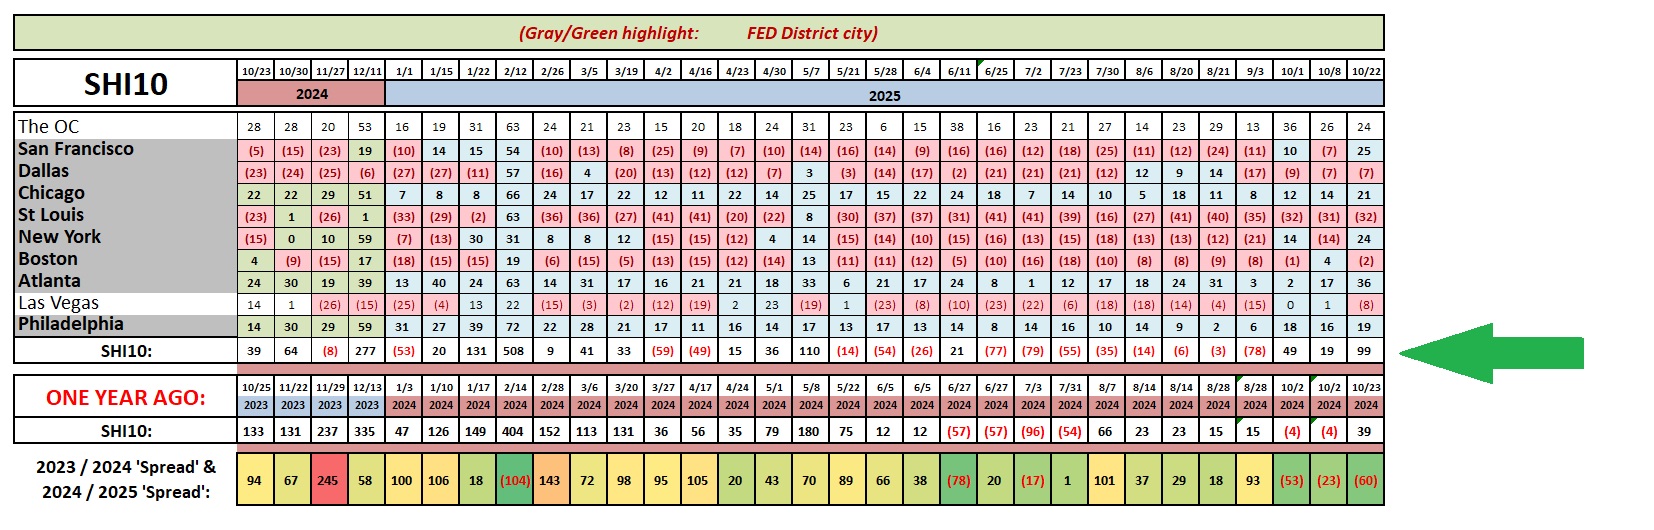
The demand for reservations at our expensive steakhouses is in the green!
The OC, Chicago, Atlanta and ‘Vegas are stable week-over-week, but steaks are flying off the grill this week in San Francisco and NYC!
Overall, the SHI10 is reflecting growing strength, reaching a positive 99 reading this week.
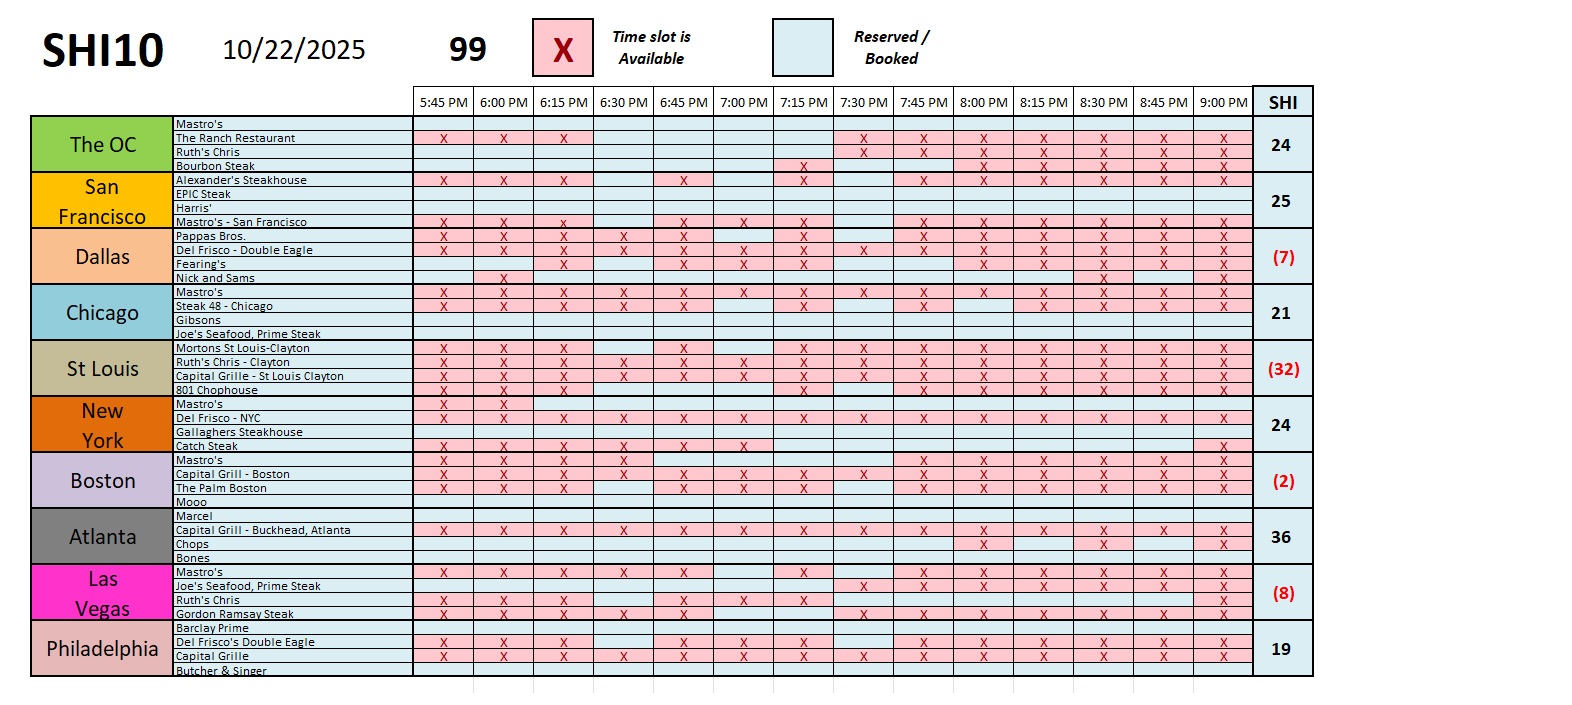
Here are the restaurant level details for the week:
Next week, we’ll return to our “normal programing” and leave behind all this bubble talk.
I’ll leave it here: Froth is easily discernible is segments of today’s financial markets. Animal spirits are running hot. So be careful out there. Make good decisions.
And keep your fingers crossed. Can’t hurt. 🙂
< Terry Liebman >


