SHI 01.21.26 — “Take the Hit”
January 21, 2026SHI 2.11.26 — Disruption Dislocation
February 11, 2026
These 5 are all FED Chairs.
The one on the right is the new guy. If confirmed by the Senate, Warsh will begin leading the FED in March. “Warsh in March” … it almost rhymes!
Volcker — the guy on the left — was a very tall man. Short-term interest rates were the highest in American history during his tenure. As Chairman of the FED, Volcker raised interest rates 14 times! Those rate hikes crushed the US economy. During the early-1980s, US GDP growth first stalled and then plummeted. Real GDP declined by 1.8% during the full year of 1982 — and at its worst point in the first quarter of that year, GDP was contracting at an annualized rate of 6.4%. It was an ugly time for the American economy.
But his efforts were mandated by a serious problem: Runaway inflation. Volcker was charged with “breaking the back” of an inflationary cycle that had become endemic during the ’60s and ’70s. To do so, he had to dramatically slow economic activity in order to both stop inflationary pressures and change deep seated consumer inflation expectations.
OK, moving on: Yes, whoever created this meme didn’t spell his name right. Oops. 🙂
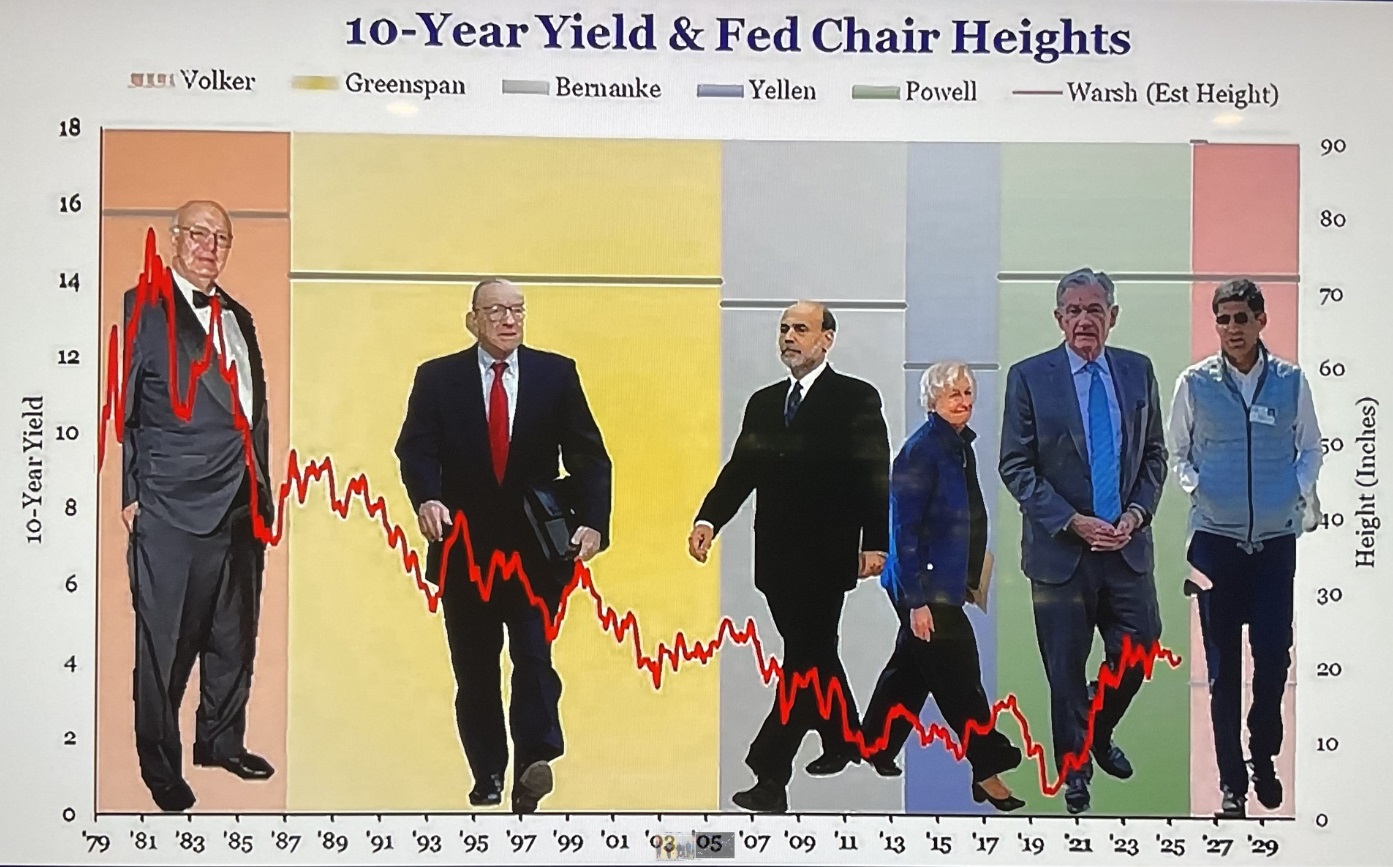
At just 5’3″, Janet Yellen was the shortest. The image shows us an interesting correlation: Interest rates were the highest during the term of the tallest FED chairman … and they were the lowest during the shortest person’s term.
Coincidence? I don’t know…what do you think? 🙂
“
Height and rates? Correlated? Yep.”
Yes, while the image may be somewhat ironic, the fact is that while the rate/height “thing” may reflect a high degree of correlation, the two are clearly unrelated. FED chair height has absolutely nothing to do with interest rates. As I’ve repeated ad nauseam, correlation and causation are often unrelated. And that is definitely the case here. To conclude that taller FED chairman prefer higher interest rates than their shorter counterparts is patently absurd. But, hey, the image is entertaining!
Below, I’ll be talking about another interesting data correlation. But unlike the physical height and interest rate height, I believe the data set we will discuss below is both highly correlated and causation is extremely likely. Read on. 🙂
Welcome to this week’s Steak House Index update.
Why You Should Care: The US economy and US dollar are the bedrock of the world’s economy.
But is the US economy expanding or contracting?
Expanding.
The ‘real’ growth rate — the number most often touted in the mainstream media — was 4.4% in the 3rd quarter of 2025. That is a HUGE growth rate. In “current dollar” terms, US annual economic output rose to $31.098 trillion. Even more staggering: The current dollar annualized GDP growth rate was 8.3% !!!!
According to the World Bank, the world’s annual GDP expanded to over $111 trillion in 2024. Further, IMF expects global GDP to reach almost $132 trillion by 2030. The US? Various forecasts project about $37 trillion for American GDP in 2030 — I believe it could be even higher.
America’s GDP remains around 28% of all global GDP. Collectively, the US, the European Common Market, and China generate about 70% of the global economic output. These are the 3 big, global players. They bear close scrutiny.
The objective of this blog is singular.
It attempts to predict the direction of our GDP ahead of official economic releases. Historically, ‘personal consumption expenditures,’ or PCE, has been the largest component of US GDP growth — typically about 2/3 of all GDP growth. In fact, the majority of all GDP increases (or declines) usually results from (increases or decreases in) consumer spending. Consumer spending is clearly a critical financial metric. In all likelihood, the most important financial metric. The Steak House Index focuses right here … on the “consumer spending” metric. I intend the SHI10 is to be predictive, anticipating where the economy is going – not where it’s been.
Taking action: Keep up with this weekly BLOG update. Not only will we cover the SHI and SHI10, but we’ll explore “fun” items of economic importance. Hopefully you find the discussion fun, too.
If the SHI10 index moves appreciably -– either showing massive improvement or significant declines –- indicating growing economic strength or a potential recession, we’ll discuss possible actions at that time.
The Blog:
You may be familiar with the term or phrase “software-as-a-service”? Even if that is unfamiliar, you probably have heard of a thing called “SaaS.” Essentially, a SaaS company sells software that is used but not owned. Buyers of that software usually purchase a license to use it — and if they stop paying the license fee, they lose access to that software. Often, those software licenses becomes operationally critical for the buyer and, as a result, they buyer is essentially handcuffed, monthly fee after monthly fee, to the SaaS company. By market capitalization, Microsoft is the largest SaaS company in the world. Others include Oracle and SAP, Sales Force and ServiceNow, and the list goes on. Another well known name is Adobe.
For years, those companies have all enjoyed exceptionally high valuations, usually growing by leaps and bounds every year, because their ability to maintain and consistently grow revenue streams was NOT limited by their physical growth. In other words, a company like Microsoft could create a software product like Windows and once created, they could sell 1,000 or 10,000,000 licenses, or more, without any further cost to Microsoft. In this way, their growth potential was uncorrelated with any physical limitations. And so, for years, the financial markets rewarded SaaS companies with exceptionally high P/E ratios and market caps.
But no longer. Consider these two 6 month charts:
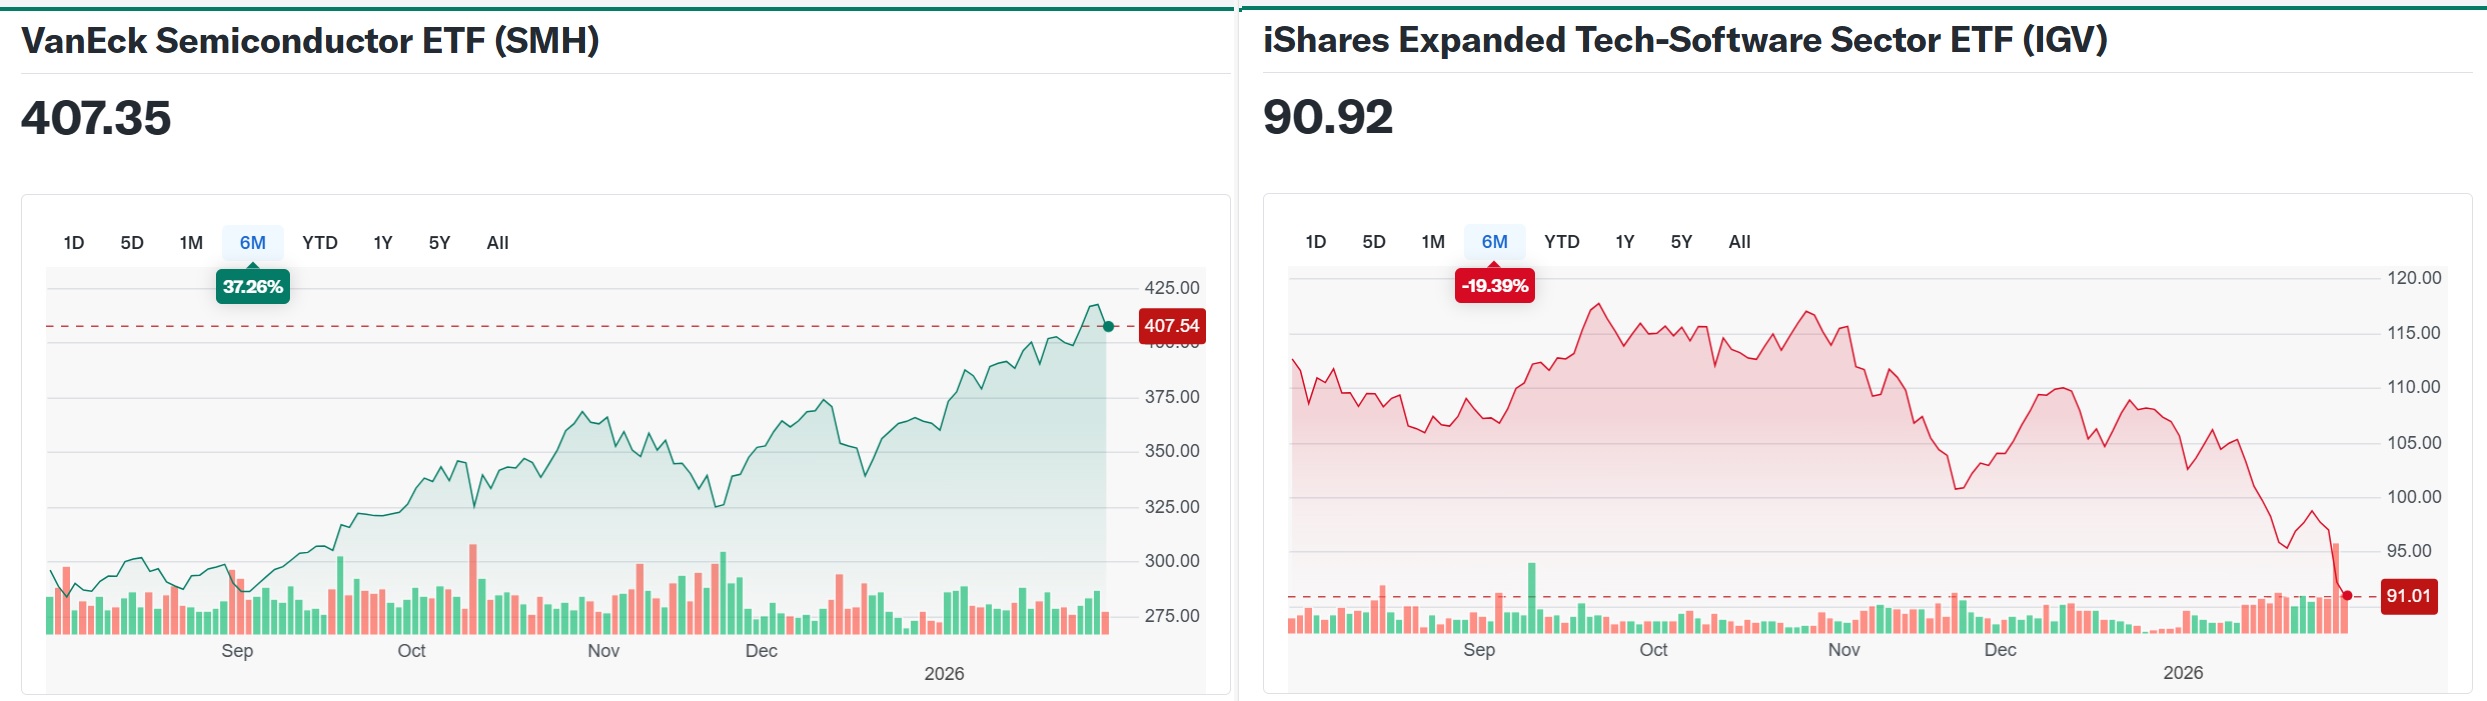
The chart on the right shows just how much this narrative has changed. In the past 6 months, the value of an ETF known and the “IGV” — a collection of publicly traded SaaS companies — has fallen by almost 20%. Historically, this is unusual. In 2024, that SaaS index was up more than 23%. In 2023, it was up by more than 58%. But by 2025, the proverbial bloom was off the rose, so to speak, and this EFT finished 2025 up by only 5%. And this year, the performance is much more ugly.
The chart on the left is a very different ETF. This one tracks the value of the top semiconductor companies. You know, companies like Nvidia, TSMC and AVGO. Those company values have been soaring to the heavens. Everyone knows this. Chips are hot. And chip stocks are even hotter. Because current demand seems inexhaustible.
This was not always the case, of course. Because chip manufacturing requires massive capital investment, and a chip company can only double revenue (in theory) if they double the number of chips sold, their valuations have always reflected this symmetrical and physical limitation. Company valuations have historically fluctuated in correlation with global chip demand. Of course, the long-term chart for this industry segment has always been up and the the right, but the correlation with the supply/demand relationship was clear and obvious.
And so was the directional relationship between the chip companies and the SaaS companies. Up until a few years ago, both market segments tended to move together. If microprocessor company stocks went up, so did SaaS company stock values. Both were viewed as “high-growth tech” companies. But in the past couple of years, that relationship seems to have broken down. Initially, to my eyes, the divergence seemed to be related to spending or capital choices — a type of “crowding out.” In other words, outsized spending on AI infrastructure (read: chips) inherently restricts spending elsewhere. Software “seats” likely took a hit.
But it didn’t end there. Enter the Anthropic coding interface called “Claude Code.” And then, this week, Anthropic introduced the Claude “Legal Plugin.” I won’t talk about the capabilities here — I’ll leave it to you to check them out — but suffice it to say that the day that product was introduced to the market, the stock prices of the SaaS legal companies like Thompson Reuters and Wolters Kluwer plummeted. In just 2 trading days, Thomson Reuters is down over 17%; Wolters Kluwer, almost 14%.
The writing seems to be on the wall: This feels like an existential threat for SaaS companies, doesn’t it. If AI can easily replace some or all of their functionality, why would anyone buy a new “seat” or license? Even worse for the SaaS companies, might AI functionality replace some or all of the capabilities of the SaaS software, thereby making those software licenses superfluous?
The chart below does a great job illustrating this divergence:
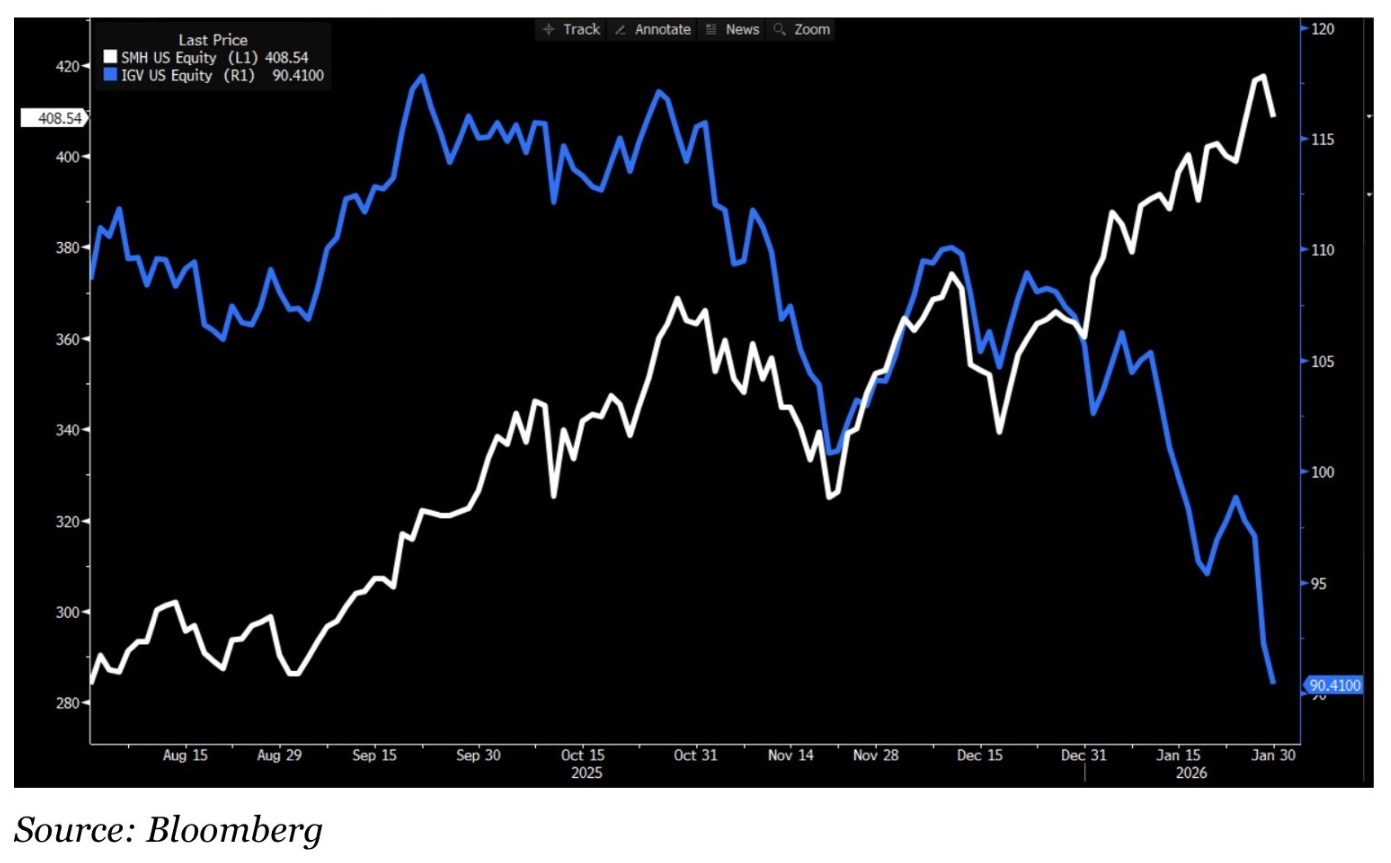
In the past 2 months, the SaaS line has been plummeting while the chips line (white) is heading toward the heavens. The stock market’s movement, essentially the “vote” of hundreds of millions of investors across the globe, is telling us that they, too, believe AI is an existential threat to the SaaS industry. Are these hundreds of millions of investors right?
That’s the problem. We have no idea. Anthropic’s recently released tools suggest this is a rational fear. After all, for more than a year the media has collectively assured us all that AI is going to change the world. Experts have suggested the movie “The Terminator” might become a reality if AI becomes ubiquitous. And if nuclear war and an existential threat against the survival of humanity aren’t the outcome, others assure us a massive spike in unemployment is likely. As these fears are top of mind, is an existential extinction threat for the SaaS (and similar) companies far fetched?
Again, we have no idea. I’ve said it before and I’ll say it again now: AI will change the world. For both the good and the bad. But beyond the rhetoric, its impossible to know how this all plays out. What I can say is this: Stock markets are fickle. They attempt to forecast financial results and activity that may — or may not — happen years in the future. Right or wrong, those forecasts dramatically impact current stock prices.
On the other hand, the millions of companies that rely on SaaS products today work and live in the here and now. Sure, these companies will, to a varying degree, implement AI solutions that ultimately reduce operating costs and improve operating efficiency. And in some cases, this type of change will adversely impact some of the SaaS revenues.
Which ones? And by how much? Again, who knows.
Here’s what I believe: The AI debate is supercharged. Fear and anxiety are clearly unavoidable because that’s what humans do during times of massive change and turbulence. Fear is a survival instinct. So we pay attention to it. Rightfully so.
But at the end of the day, I believe AI will create as many new opportunities for humanity as it eliminates. It will be a bumpy ride along the way, and there will be clear winners and losers. The challenge for each of us, I think, is to keep a level head, navigate the turbulence, and find a way to profit as challenges and opportunities arise.
Easier said than done, right? 🙂
“May you live in interesting times.”
Indeed.
In the meantime, consider this: During Q3 of 2025 — the most recent GDP growth report we have — the US economy grew at the annual rate of 8.3% My friends, that is a smoking hot economy!!! OK, ok, keep in mind this is the ‘nominal’ or current dollar growth rate. The ‘real’ growth rate was 4.4%. This followed a 3.8% annualized real growth rate in Q2. These are staggeringly good numbers. The Atlanta FED believes this blistering growth rate will continue in the 4th quarter, when those numbers are released later this month. They updated their forecast on Monday, February 2nd, to an annualized growth rate of 4.2% for Q4, 2025. Wow. Amazing.
I had to get this post out on Tuesday. So I’m afraid we’ll have to wait until the next blog post for an SHI10 update. 🙂
<( Terry Liebman )>