SHI 10.22.25 – Bubble Talk, Epilogue
October 22, 2025SHI 11/20/25 – The Swan and the Canary
November 20, 2025
The world’s first economics and comedy festival is starting soon!
Yep. That’s right: the Kilkenomics Festival is an Irish “festival” combining comedy AND economics. What’s crazier is they’ve been doing this thing since 2008! I guess economics CAN be funny! Who knew? Get your tickets today!
🙂
“
No, people, economics is serious stuff!”
Usually. But not in Kilkenny, Ireland. There, apparently, it’s pretty funny.
On their website, “What started as a way to make sense of the 2008 economic crash has turned into the Kilkenomics festival as we know it today. The aim of Kilkenomics has always been to take economics, finance and geo-politics out of the conference and the lecture theatre and create conversations that are accessible and relevant to people’s everyday lives.
Our informal, entertaining panels are, mostly, hosted by standup comedians who are there on behalf of the audience to decode, decipher and demolish the sometimes impenetrable language of economics, finance and geopolitics and add some levity while dealing intelligently with some very serious issues.”
There you have it. And where else can you see a show titled, “Leprechaun Economics: How Ireland Blew its Pot of Gold.” Sounds pretty funny to me! 🙂
But less funny, in my opinion, are the growing piles of debt the American consumer and government are collecting.
Welcome to this week’s Steak House Index update.
Why You Should Care: The US economy and US dollar are the bedrock of the world’s economy.
But is the US economy expanding or contracting?
Expanding.
The ‘real’ growth rate — the number most often touted in the mainstream media — was 3% in the last quarter. In “current dollar” terms, US annual economic output rose to $30.331 trillion.
According to the World Bank, the world’s annual GDP expanded to over $111 trillion in 2024. Further, IMF expects global GDP to reach almost $132 trillion by 2030. The US? Various forecasts project about $37 trillion for American GDP in 2030 — I believe it could be even higher.
America’s GDP remains around 28% of all global GDP. Collectively, the US, the European Common Market, and China generate about 70% of the global economic output. These are the 3 big, global players. They bear close scrutiny.
The objective of this blog is singular.
It attempts to predict the direction of our GDP ahead of official economic releases. Historically, ‘personal consumption expenditures,’ or PCE, has been the largest component of US GDP growth — typically about 2/3 of all GDP growth. In fact, the majority of all GDP increases (or declines) usually results from (increases or decreases in) consumer spending. Consumer spending is clearly a critical financial metric. In all likelihood, the most important financial metric. The Steak House Index focuses right here … on the “consumer spending” metric. I intend the SHI10 is to be predictive, anticipating where the economy is going – not where it’s been.
Taking action: Keep up with this weekly BLOG update. Not only will we cover the SHI and SHI10, but we’ll explore “fun” items of economic importance. Hopefully you find the discussion fun, too.
If the SHI10 index moves appreciably -– either showing massive improvement or significant declines –- indicating growing economic strength or a potential recession, we’ll discuss possible actions at that time.
The Blog:
Unfortunately, the comedy stops here. As of 11/3/25, the total debt of the United States is
$38,004,366,480,104.18
That’s just a hair over $38 trillion. Staggering. For context, know that the total debt number was $23.17 trillion as 2020 started. And as 2015 began, total US debt was $18.13 trillion. Meaning, of course, that total US debt has essentially (more than) doubled in 10 years. Staggering.
Debt levels are at all-time highs: US public debt, credit card debt, mortgage debt, student debt … pick one or all — they share a common trait. The amount owed has never been larger.
Obviously, this sounds bad for consumers … and perhaps even worse for America. I can’t imagine any way to spin these facts to sound like a good thing. But could it be neither? Could this current state of affairs simply be neutral? Let’s talk about ‘current state’ and the implications.
Earlier today, the NY FED released their most recent “Quarterly Report on Household Debt and Credit.” They summarized with these words:
Mortgage balances shown on consumer credit reports grew by $137 billion during the third quarter of 2025 and totaled $13.07 trillion at the end of September. Balances on home equity lines of credit (HELOC) rose by $11 billion, the fourteenth consecutive quarterly increase. There is now $422 billion in outstanding HELOC balances, $105 billion above the low reached in the first quarter of 2022. Credit card balances rose by $24 billion during the third quarter and now total $1.23 trillion outstanding and are 5.75% above the level a year ago. Auto loan balances held steady, remaining at $1.66 trillion.
Other balances, which include retail cards and consumer finance loans, rose by $10 billion and now total $550 billion. Student loan balances rose by $15 billion and now stand at $1.65 trillion. In total, non-housing balances increased by $49 billion, a 1.0% increase from 2025Q2.
In general, as y0u can see, credit balances either “grew” or “rose” or “increased” during the quarter. Only auto loans remained unchanged. Here’s a visual:
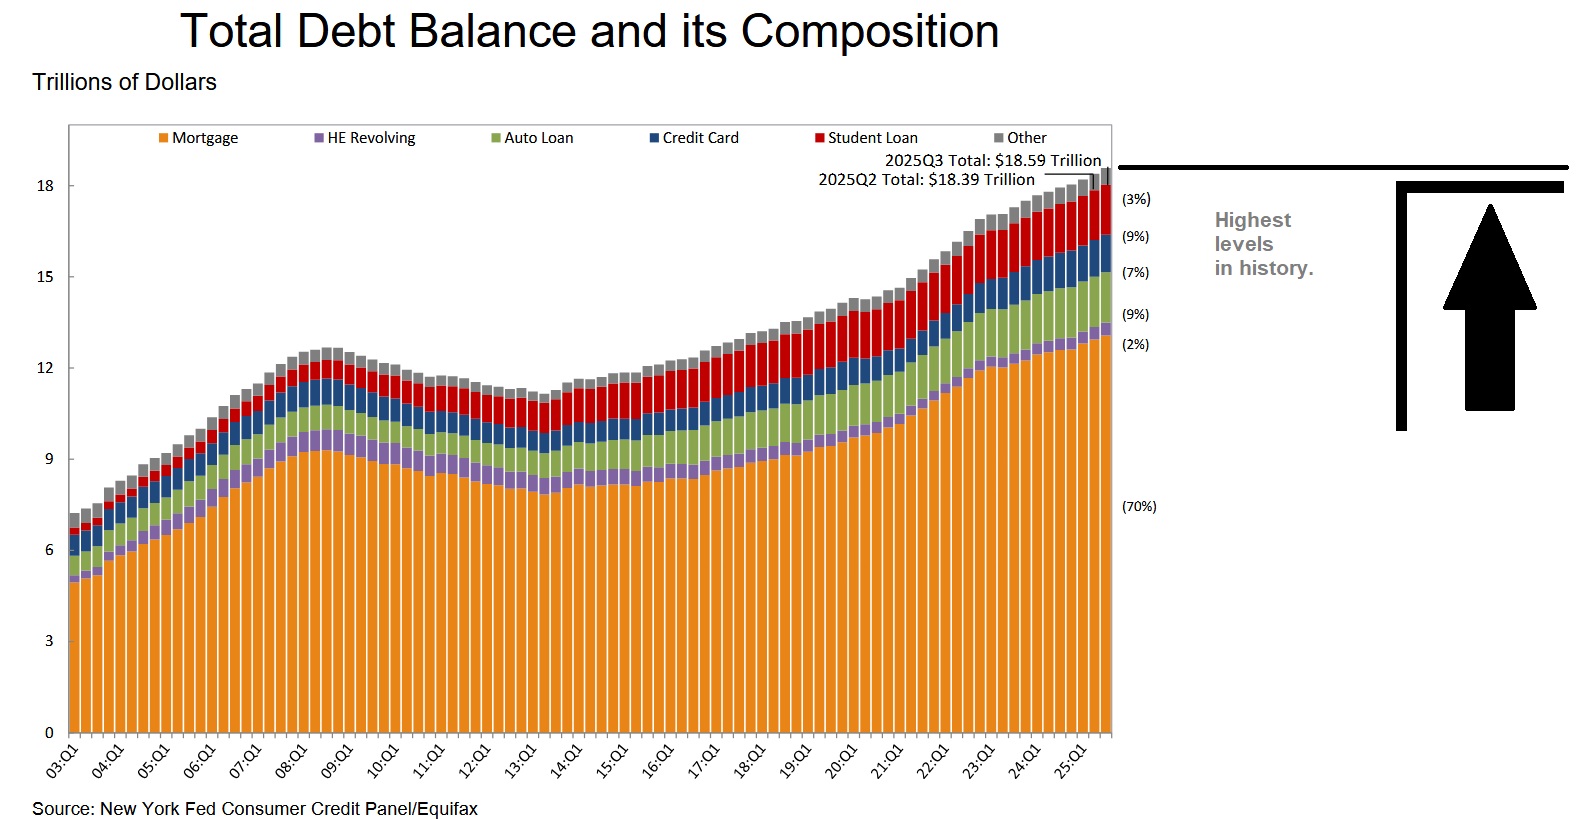
It’s worth noting that while total debt is clearly thru the roof, credit card balances — when compared to maximum credit card limits — are still quite low and constrained. Quantitatively, they are close to only 20% of the maximum.
Student loan debt — which has jumped to all times highs — is now over 14% serious delinquency. Said in other words, 14% of all outstanding student loan debt is more than 90 days delinquent. However, this is an outlier — all other debt delinquencies remain consistently low.
By now, I suspect you agree with my intro — in every direction we look, there are miles and miles of large debt piles. Can the consumer handle the weight? Yes. Because 70% of total debt (see above) is housing debt. Most of that is fixed rate debt. And the vast majority of those fixed rates are below 4%. So that’s manageable in my book.
Fiscal year (FY) 2025 ended on September 30th. The US Treasury collected $5,235 trillion in total revenue during the prior 12 months. The majority was from “individual income taxes” and social security tax, and the rest was a mix of corporate income taxes, customs, duties, etc. During that same fiscal year, the US Treasury spent a total of $7.010 trillion.
How much was interest expense? The “average rate” on federal debt, weighted across all the varying maturities, is about 3.4%. For an entire year, therefore, the interest carrying cost is around $1.3 trillion. However, interest expense in FY2025 was just $970 billion. 🙂
Did you know that over the years, we have found there is an extremely high correlation between the level of nominal US GDP and US Treasury revenue collections? This may sound like common sense as rising levels of GDP should result in rising levels of tax collections. GDP is a pure measure of economic activity. As activity rises, taxes should rise too. And they do.
But by how much? And how strong is the correlation? Let’s begin with some basics.
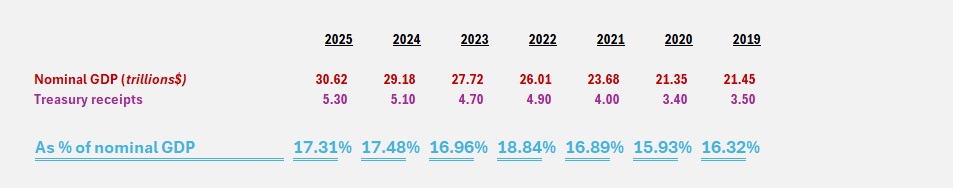
First, it turns out that annual US Treasury collections equal about 17% of the US nominal GDP each and every year. Of course, it varies each year, up and down, depending on tax rates and other factors, but over long periods it has averaged around that figure. Here’s a chart showing the actual collection rates for recent years:
In my opinion, here is where this gets interesting.
While current GDP forecasts are all over the map, the Atlanta FED believes Q3 GDP will clock in at the annualized rate of 4.00%:
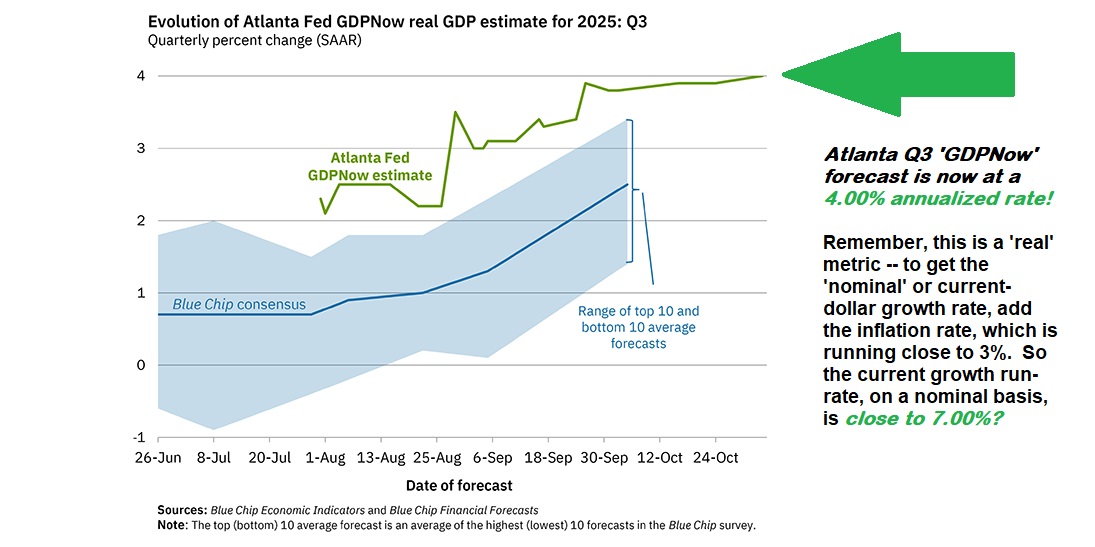
Could nominal GDP growth actually be running that hot? The last time that happened was more than 20 years ago. But, for the moment, let’s suppose that our US GDP is, in fact, growing at the annualized nominal rate of 7%. What would that mean for collections at the US Treasury. Let’s do the math:
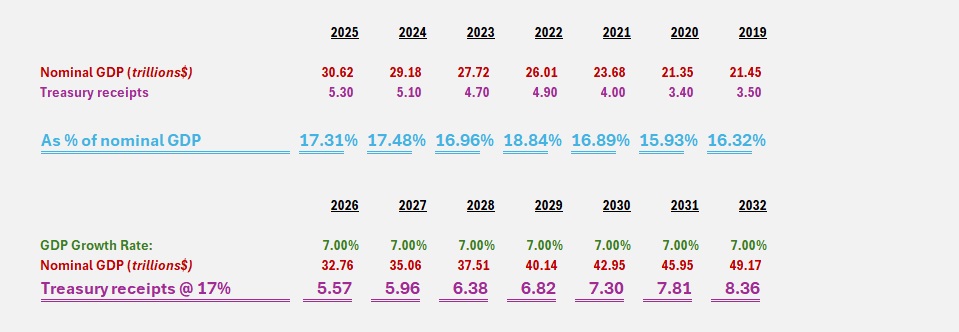
In this scenario, total collections would increase to $7.3 trillion by 2030. Do you remember that FY2025 spending totaled just over $7 trillion? If spending were held constant for the next 5 years, and GDP grew annually at the rate of 7%, the US would be in a surplus by 2030! 🙂
Right. That’s a lot of ifs. And probably a lot of financial fantasy. But its an “interesting” exercise. Pun intended.
Clearly there are a lot of assumptions and hyperbole here. But this analysis does illustrate how the US could potentially “grow its way” out of the current debt death spiral. If the current AI data center infrastructure expansion proves durable, and AI actually supercharges US GDP growth, my financial fantasy might become real.
Wouldn’t that be nice?
Here are this weeks SHI40 numbers:
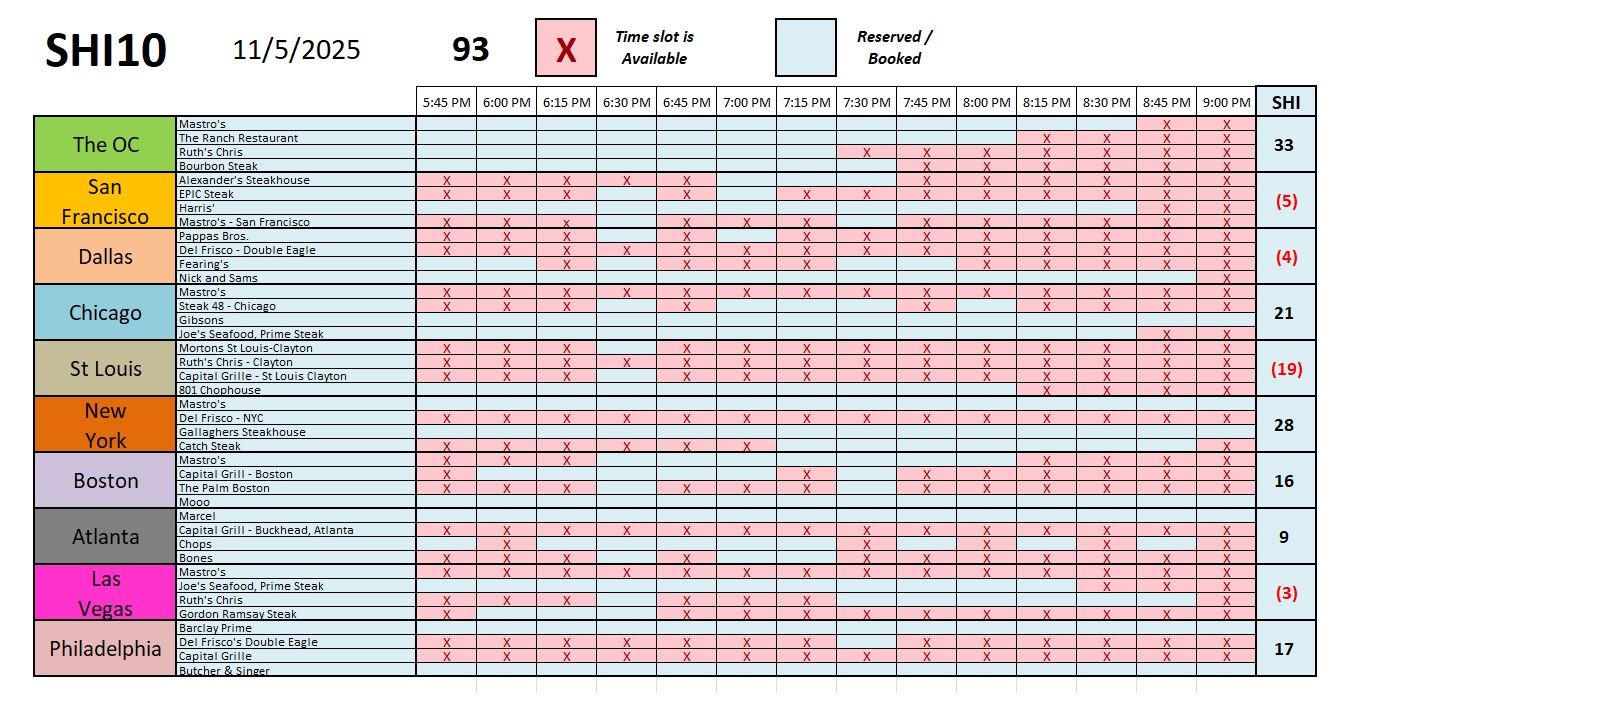
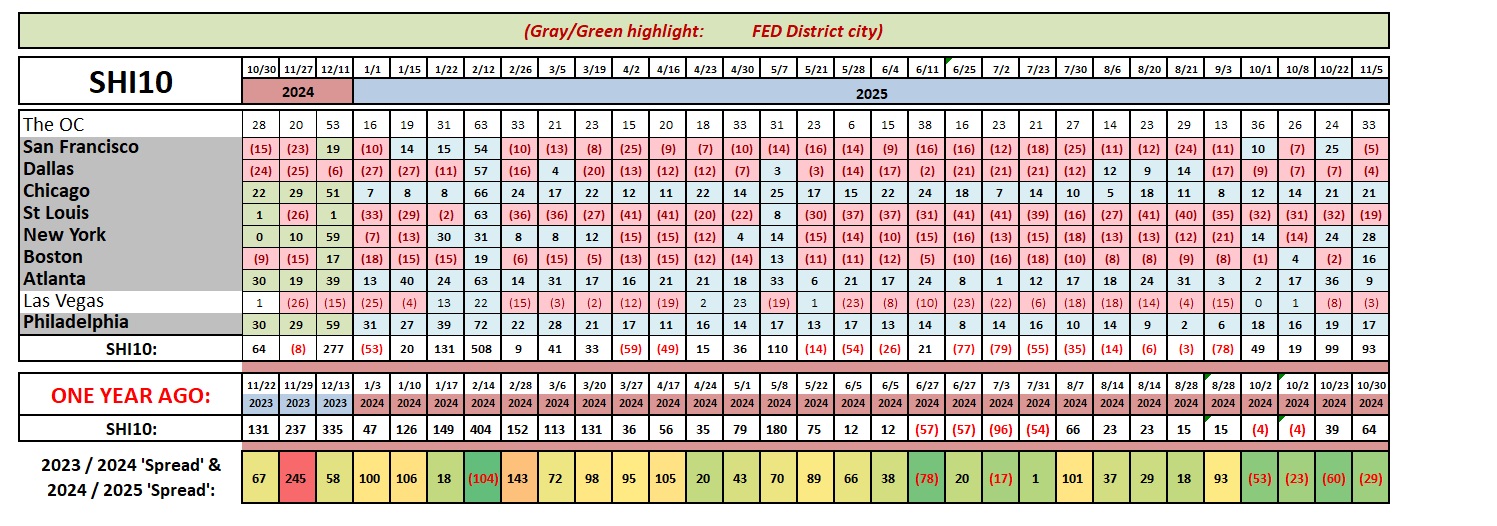
Right. Steady as she goes. 🙂
<: Terry Liebman :>


