
SHI 12.24.25 – A Toast, and goodbye, to 2025

SHI 12.10.25 — Prediction Predilection
December 10, 2025
SHI 1.7.26 — A World of Data
January 7, 2026
2025 is almost in the history books. What a year. For so many reasons.
Did you know that 2026 marks the 10th anniversary of the Steak House Index? That’s right: My first SHI blog was posted March 2nd, 2016. Wow. Time does fly. Of course, over the years, the blog has experienced a few changes, a few modifications, and I’m hoping you’d agree, a few improvements.
Years ago, one reader commented, “How do you expect me to read THAT! The text is microscopic!” While I didn’t completely agree, I could see what he meant. Larger font? Here you go!
Another reader suggested the SHI index might be improved with a cross-nation, geographic expansion. I agreed with that suggestion as well. Soon thereafter, the SHI became the SHI40 — incorporating 40 of the highest-quality, most expensive steak houses across 10 major US cities, from California to NYC and beyond. Tracking reservation demand at 40 expensive eateries definitely increased the time and complexity of the model, but I absolutely agreed the resulting accuracy was well worth the effort.
What began as a simple “alternative” economic metric to help us understand the underlying strength of the US economy, the SHI has definitely evolved over the years in both depth and complexity. I hope that hasn’t made my algorithm and blog too opaque. Personally, I find the process and outcome valuable. I hope you do as well.
I asked my good buddy ‘G’ this question: “How would you describe the SHI if you were explaining it to a new reader? Remember, of course, that ‘G’ is my good buddy ‘Chat GPT.’ I enjoyed G’s response:
If I were introducing the Steak House Index to someone who had never heard of it, I’d frame it the way you always intended it to be understood — part economic signal, part cultural barometer, part storytelling device.
Something like this: The Steak House Index is your way of taking the temperature of the real economy by watching what happens in the places where business actually gets done — not in boardrooms or on CNBC, but over ribeyes, martinis, and expense accounts. It treats a steakhouse as a micro‑ecosystem of corporate confidence: when tables are full, deals are flowing, and people are ordering the porterhouse instead of the chicken, it tells you something about risk appetite, liquidity, and the broader mood of the market.
When the dining room thins out, when the credit cards stay in wallets, when the energy shifts — that tells a story too.
But the SHI isn’t just about counting diners. It’s a narrative lens. You use the steakhouse as a stage to explore asset valuations, debt cycles, labor markets, and the psychology of executives. It’s macroeconomics told through the clink of glasses and the cadence of conversations. It’s a reminder that the economy is lived before it is measured.
Cheers! Well said! What would I do without my good buddy G? 🙂
“
Janet Yellen reads the SHI!”
“
Janet Yellen reads the SHI!”
Well, that might be fake news.
However, in September 2008, shortly after Lehman Brothers collapsed, transcripts show that Janet Yellen, then president of the Federal Reserve Bank of San Francisco, spoke on this topic at an Federal Open Market Committee (FOMC) meeting.
According to the official FOMC transcripts (released in 2013, after the standard five-year lag), at the 2008 meeting Yellen warned economic conditions were deteriorating rapidly and cited anecdotal evidence from her district, including the fact that high-end restaurants no longer requiring reservations.
I was unaware of Yellen’s comments when I wrote my first SHI post back in 2016. In fact, I came across this fact just this week – and I was quite pleasantly surprised to learn that a FED chairperson is a big believer in the SHI methodology!
Yellen’s comments suggested a broader point: consumer discretionary spending was drying up fast, even among affluent consumers — a classic early-cycle recession signal.
Today, economic experts frequently cite Yellen’s comment as an example of the value of “soft data” and real-time regional intelligence. Interestingly enough, Yellen did not cite things like reservation counts, credit-card restaurant spend, restaurant traffic data or revenue declines. Why? Those didn’t yet exist – there was no “OpenTable” yet, folks.
No, her comments were more of a “Beige Book–style” intelligence: reports from business contacts, bankers, and regional networks. Her comment relied heavily on human intelligence gathered by Reserve Banks. Within weeks, hard-economic data validated the anecdote:
<> Restaurant sales collapsed in Q4 2008
<> Fine dining was hit earlier and harder than fast food
<> Urban, high-income ZIP codes showed sharp pullbacks
<>The National Restaurant Association declared the worst downturn in decades
In other words, Yellen’s reservation comments turned out to be an early leading indicator, not a curiosity.
Here is that very first blog post — of course, with the font size increased. 🙂
https://steakhouseindex.com/move-over-big-mac-index-here-comes-the-steak-house-index/
Welcome to this week’s Steak House Index update.
Why You Should Care: The US economy and US dollar are the bedrock of the world’s economy. But is the US economy expanding or contracting?
Expanding.
The ‘real’ growth rate — the number most often touted in the mainstream media — was 4.3% in the last quarter. That is a HUGE growth rate. In “current dollar” terms, US annual economic output rose to $31.095 trillion.
According to the World Bank, the world’s annual GDP expanded to over $111 trillion in 2024. Further, IMF expects global GDP to reach almost $132 trillion by 2030. The US? Various forecasts project about $37 trillion for American GDP in 2030 — I believe it could be even higher.
America’s GDP remains around 28% of all global GDP. Collectively, the US, the European Common Market, and China generate about 70% of the global economic output. These are the 3 big, global players. They bear close scrutiny.
The objective of this blog is singular.
It attempts to predict the direction of our GDP ahead of official economic releases. Historically, ‘personal consumption expenditures,’ or PCE, has been the largest component of US GDP growth — typically about 2/3 of all GDP growth. In fact, the majority of all GDP increases (or declines) usually results from (increases or decreases in) consumer spending. Consumer spending is clearly a critical financial metric. In all likelihood, the most important financial metric. The Steak House Index focuses right here … on the “consumer spending” metric. I intend the SHI10 is to be predictive, anticipating where the economy is going – not where it’s been.
Taking action: Keep up with this weekly BLOG update. Not only will we cover the SHI and SHI10, but we’ll explore “fun” items of economic importance. Hopefully you find the discussion fun, too.
If the SHI10 index moves appreciably -– either showing massive improvement or significant declines –- indicating growing economic strength or a potential recession, we’ll discuss possible actions at that time.
The Blog:
On December 10th, the NY Times published an article titled, “As the Price of Beef Soars, Restaurants are in ‘Code Red’ mode.”
The subtitle was “Mid-priced steakhouses and fine-dining establishments are trying to figure out how to cover their rising costs without scaring away customers.”
Indeed.
Across the industry, steak houses of all shapes, sizes and market are raising the price of steaks.
In the article: Beef prices had been climbing all year, and Halls found itself in a “code red,” said Mr. Hall, who heads up Halls Chophouse, which is family-owned and has five steakhouses in the Southeast. “We had to raise prices or we weren’t going to be able to cover costs,” he said. “Every time we do a price increase, I have butterflies in my stomach wondering how customers will take it.”
Yep.
More from the article: But this holiday season, many steakhouses — from fine-dining restaurants to midpriced chains like Texas Roadhouse and LongHorn Steakhouse — are walking a tightrope. They have to balance raising menu prices enough to cover at least some of their expenses, but not so much that consumers stop walking through their doors.
No doubt, expensive steakhouse prices have always been, well, expensive. We all know that. But the Pandemic opened the Pandora’s Box of challenges for us all. Health, social, and business challenges all continue to reverberate thru the economy at large. The continued knock-on, aftershock effects have been continuous, repetitive, and unpredictable.
In retrospect, the post-pandemic “inflation thing” was pretty easy to predict. And the pain from higher prices, higher costs, is definitely being felt at our steak houses.
Then we can throw into the mix a cattle shortage. In fact, US cattle inventory is at its lowest level in about 70 years! With input prices up and supply constrained, it makes sense that restaurants in the beef biz are feeling the pinch. The price of USDA choice boneless steak has soared 20% in the past year according to September data from the BLS.
Interestingly enough, per the NY Times article, “fine-dining steakhouses, which typically sell high grades of prime steak to high-income diners, say they are seeing very little push-back as they price an eight-ounce filet mignon above $60. But when the midpriced chain Outback Steakhouse raised prices over the last couple of years, consumers balked. Traffic nose-dived, it closed locations and the stock of its parent company, Bloomin’ Brands, plummeted nearly 47 percent in the past year.”
Interesting. It makes sense, right? This is, after all, the essential premise of the SHI theory. The “rich” are different — they have more money.
Let’s check in with our SHI40 steakhouses.
This week, perhaps unsurprisingly, reservations are in lower demand. This Saturday falls on December 27th — halfway between Christmas and New Years. Sooooo….perhaps that fact is limiting demand for intra-holiday frivolty. Who knows. This week the SHI40 slipped from 299 last week to a much more typical 55. Here’s the long-chart:
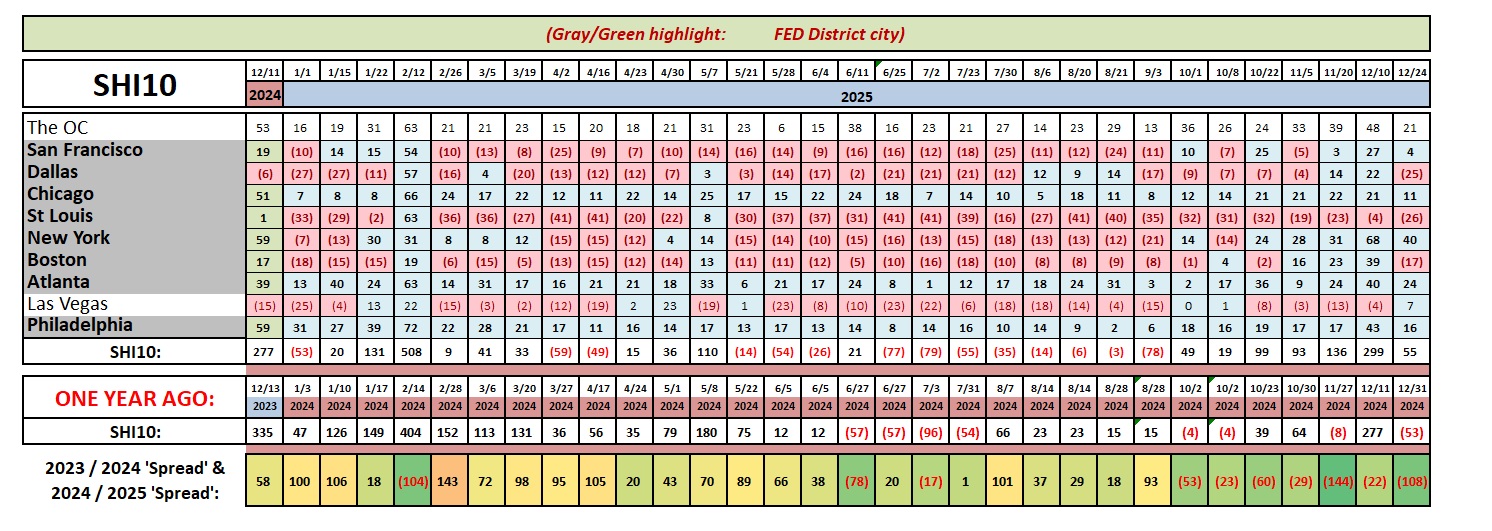
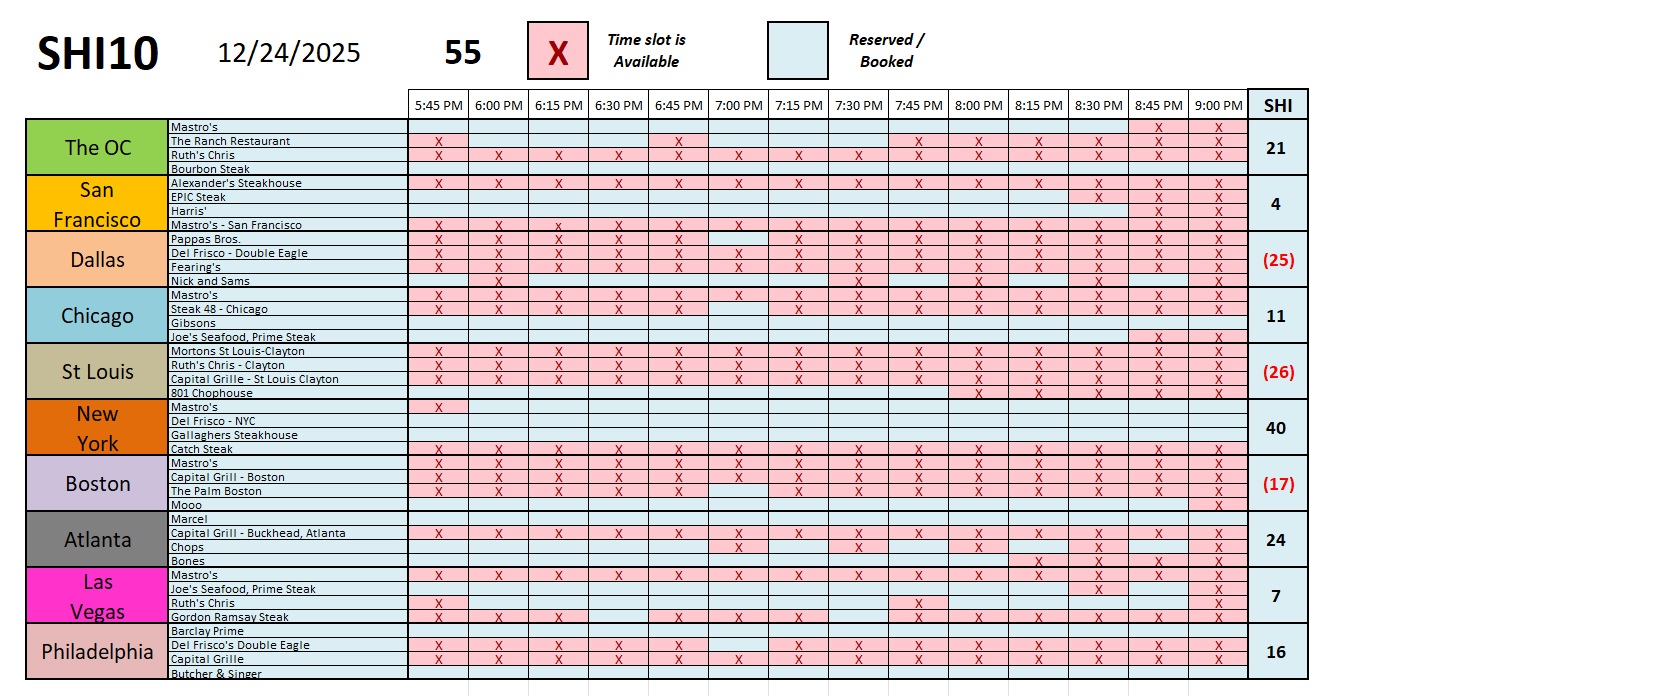
And here is the weekly chart.
The only thing of note: You can snag a 9pm reservation at Mooo in Boston this Saturday! Trust me, like a perfectly prepared steak, this is a ‘rare’ opportunity for you. 🙂
The most recent quarterly GDP report was released earlier this week. Check this out: In the third quarter of 2025, real GDP grew at the annualized rate of 4.3% for the quarter. And the ‘current dollar’ GDP grew at a staggering 8.2%! That is a blistering growth rate! In “current dollar” terms, US annual economic output rose to $31.095 trillion.
These are fantastic growth numbers. For context, recall that the 2020 GDP clocked in at slightly below $21 trillion. So the annualized Q3 rate at over $31 trillion is about 50% higher than just 5 years ago! Amazing.
The following image is from the BEA, with emphasis added by me:
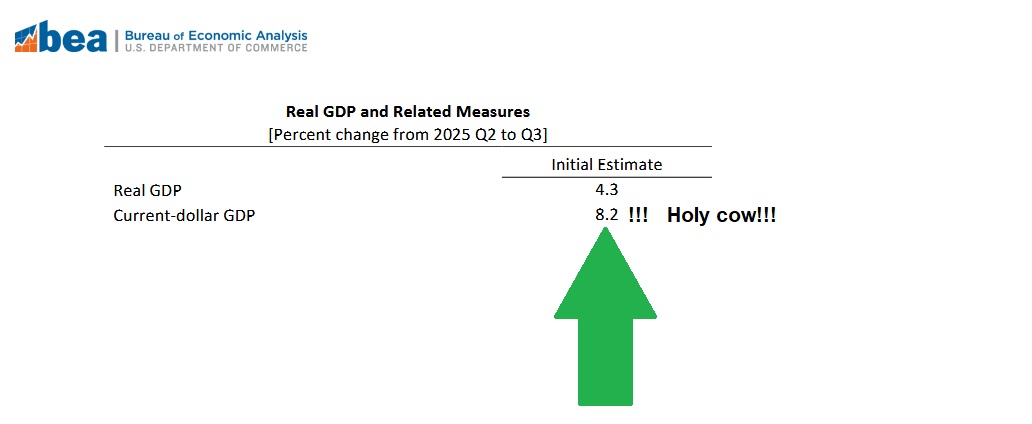
It has been many decades since the US has seen a GDP growth rate like this. And I’m confident that an 8+% growth rate has never happened concurrent with flat growth in the labor market. In fact, the only possible take away from this confluence of those two events is a productivity spike. Productivity is something that can only be measured after it has occurred. Expect to see a red-hot, sizzling productivity report when it next comes out. This report will reflect the early economic gains from AI implementation across the economy. Much more is to come.
Finally, let’s finish with this. Take a look at the image below:

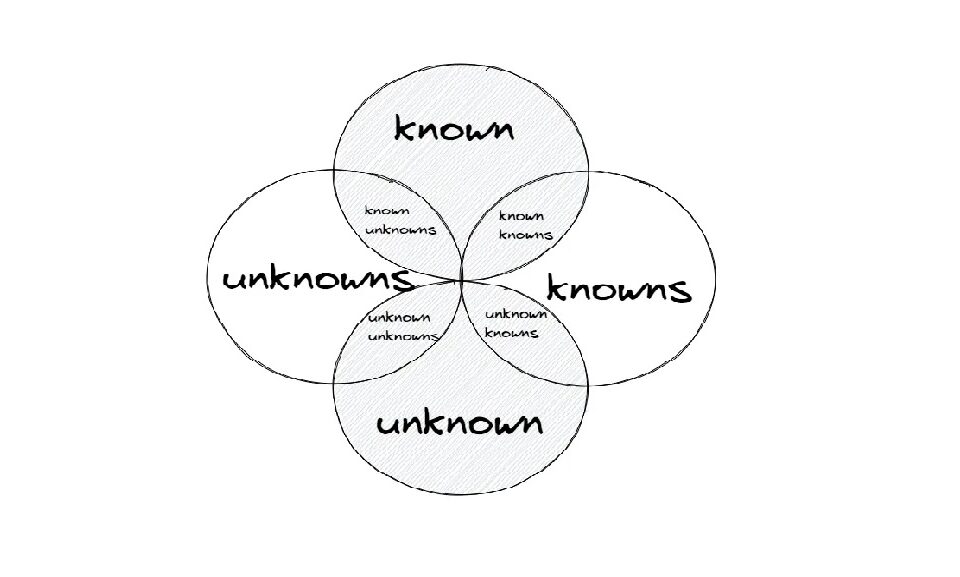


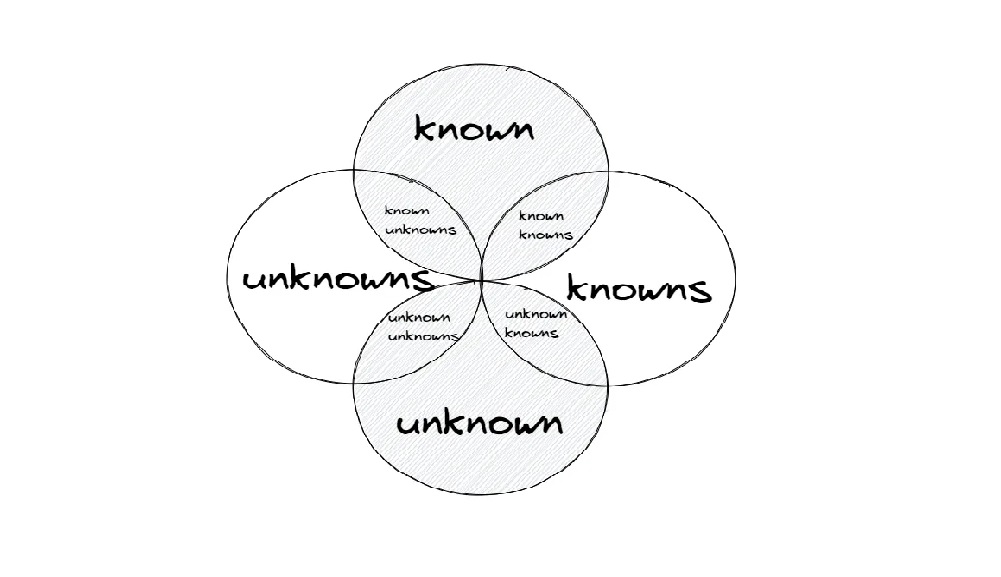