
SHI 2.25.25 – Horseshoes and Hand Grenades

SHI 2.18.26 — Only The Paranoid Survive
February 18, 2026
SHI 3.11.26 — A Financial Neutron Bomb?
March 11, 2026
“Close only counts in horseshoes and hand grenades.”
OK. Right. We’ve all heard that before.
But the last GDP report? The one released on Friday? It didn’t measure up. Unfortunately, the headline GDP growth reading fell short. Very short. Can we say it was close? Nope. Not even thru the ‘horseshoes and hand grenades’ metric. Not even close.
“
The GDP report? Hmmm … not so hot.’“
“
The GDP report? Hmmm … not so hot.’“
Before the report was released by the BEA, the Atlanta FED was forecasting 3.10% annualized for Q4 GDP. The actual ‘real’ GDP number was 1.58%. By any metric, that result is way off.
The Atlanta FED would tell you that their nowcast is not a forecast. It is a real-time, fully mechanical, math-based algorithm designed to converge on the BEA’s first estimate of GDP at the time that first estimate is released to the public.
OK, so it’s not a forecast … but a nowcast. Got it. But, wow, folks you weren’t even close! I suspect the eggheads over at the Atlanta FED might defend their model with a comment something like this: “Well, our nowcast is especially accurate when the economy is stable.” Perhaps. And we all know that Q4 was anything but stable.
But if we’re talking actual forecasts, there are financial “experts” that make those calls all the time. The “market consensus” of the experts was a 3.00% reading. A Reuters Poll pegged the number at 4.2%. Even the financial luminaries over at Goldman Sachs and JP Morgan were in the mid-2s range.
All the experts were wrong. And they weren’t even close! What happened?
Welcome to this week’s Steak House Index update.
If you are new to my blog, or you need a refresher on the SHI10, or its objective and methodology, I suggest you open and read the original BLOG: https://www.steakhouseindex.com/move-over-big-mac-index-here-comes-the-steak-house-index/
Why You Should Care: The US economy and US dollar are the bedrock of the world’s economy. But is the US economy expanding or contracting?
Expanding … according the ‘advanced’ reading just released by the BEA, Q3, 2024 GDP grew — in ‘current-dollar‘ terms — at the annual rate of 4.7%.
The ‘real’ growth rate — the number most often touted in the mainstream media — was 2.8%. In current dollar terms, US annual economic output rose to $29.35 trillion.
According to the IMF, the world’s annual GDP expanded to over $105 trillion in 2023. Further, IMF expects global GDP to reach almost $135 trillion by 2028 — an increase of more than 28% in just 5 years.
America’s GDP remains around 25% of all global GDP. Collectively, the US, the European Common Market, and China generate about 70% of the global economic output. These are the 3 big, global players. They bear close scrutiny.
The objective of this blog is singular.
It attempts to predict the direction of our GDP ahead of official economic releases. Historically, ‘personal consumption expenditures,’ or PCE, has been the largest component of US GDP growth — typically about 2/3 of all GDP growth. In fact, the majority of all GDP increases (or declines) usually results from (increases or decreases in) consumer spending. Consumer spending is clearly a critical financial metric. In all likelihood, the most important financial metric. The Steak House Index focuses right here … on the “consumer spending” metric. I intend the SHI10 is to be predictive, anticipating where the economy is going – not where it’s been.
Taking action: Keep up with this weekly BLOG update. Not only will we cover the SHI and SHI10, but we’ll explore “fun” items of economic importance. Hopefully you find the discussion fun, too.
If the SHI10 index moves appreciably -– either showing massive improvement or significant declines –- indicating growing economic strength or a potential recession, we’ll discuss possible actions at that time.
The Blog:
Let’s take a look.
Yes, the fourth quarter of 2025 was definitely anything but stable. Do you remember the “federal government shutdown?” If feels so long ago, yet is was only a few months ago. And the impact on the GDP metric cannot be understated. The impact was huge. Consider this: Had the shutdown not happened, the annualized Q4 GDP number would have, in fact, been almost exactly what Goldman and JP Morgan projected: 2.65%.
This chart, courtesy of the BEA, does a great job of highlighting the contribution to Q4 GDP from each economic segment:
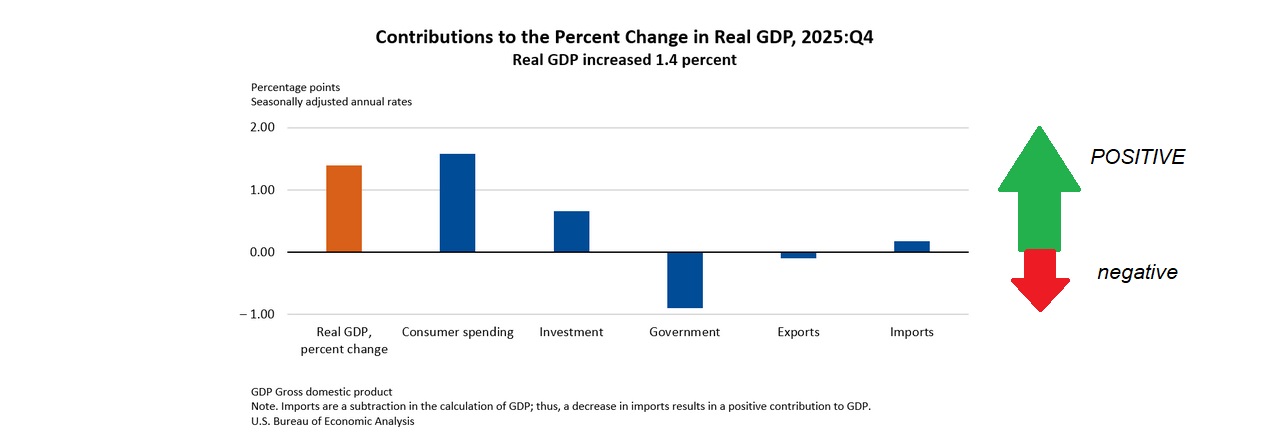
Consumer consumption held up quite well. That’s good. The “investment” bucket was actually lighter than I expected. It’s quite possible supply and construction bottlenecks are slowing a meaningful portion of that $1 trillion mega-cap spend. This component should pick up in coming quarters.
Imports and exports were pretty much a wash. But the “Government” component was a huge negative for the quarter. Huge. It trimmed nearly one full percentage point off the GDP reading.
I’m not a big fan of “adding back” or “removing” unique, black-swan events from quarterly data. Sure, they are always unexpected and unpredictable. But every quarter we seem to have something out of left field impact the numbers. That said, a federal government shut down — especially one as protracted as this one — is very unusual. For what its worth.
Anyway, your take-away from this discussion is three-fold.
First, the ‘adjusted’ GDP figure for Q4, annualized as all these numbers are, came in at 2.65%. That’s a solid reading. But remember: I’m removing the impact of the federal government shutdown.
Second, the real 2025 GDP growth rate without any adjustments came in at 2.2%. Again, that’s a solid year.
And finally, this: As we live in the here and now, and not in an ‘inflation adjusted’ world, I always want talk about the “current dollar” GDP numbers. too. I know many experts dismiss this metric, but I do not. We all buy food, shelter and clothing — the three must-haves — at current dollar prices. I have yet to find a vendor willing to sell me anything at an inflation adjusted price. In current dollars, the US GDP increased 4.8% last year. And even after the impact of the shutdown, in
Q4 “current dollar” GDP increased at the annualized rate of 5.1%.
That’s an impressive number, folks. By any measure.
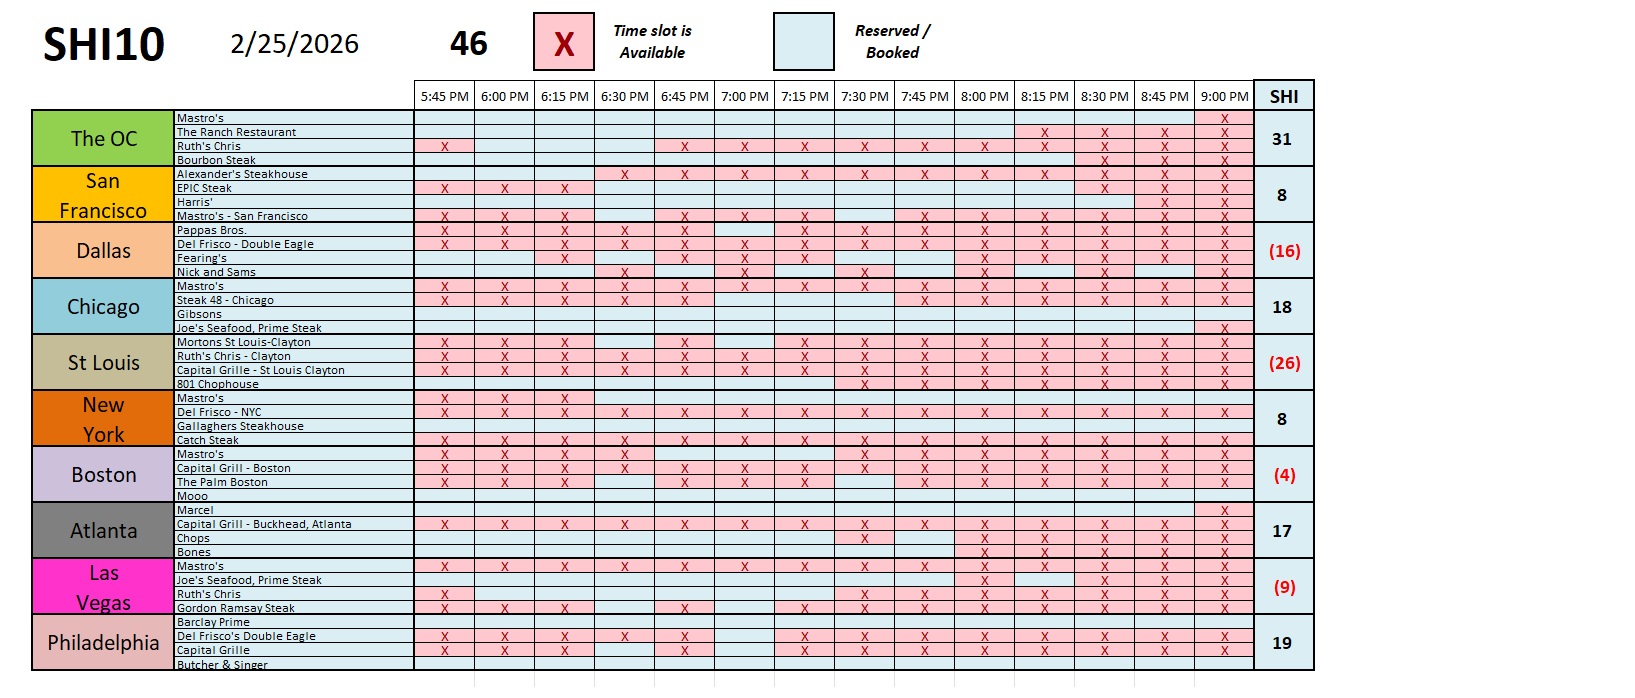
Let’s head to the steakhouses.
Well, there’s not much to see here. The SHI40 is fairly steady-as-she-goes. The long-term chart tells us the same thing:
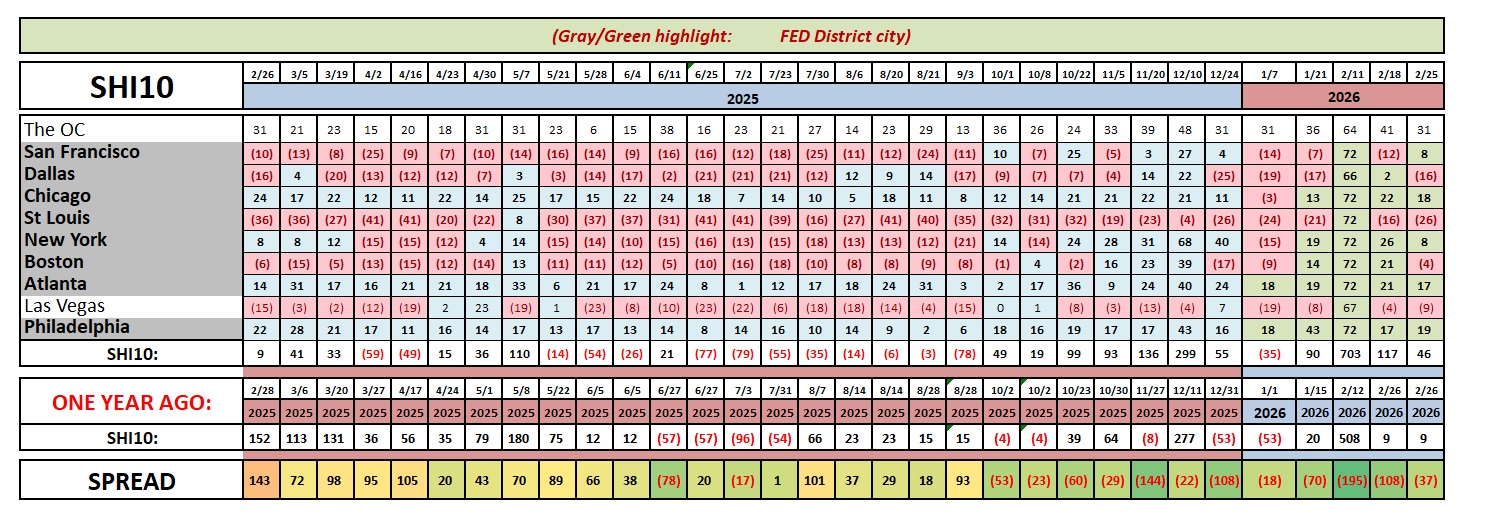
Interestingly enough, with all the craziness in the world today — in all directions — the SHI40 and the US economy, in the aggregate, are both showing quite solid results. The US economy, on the whole, is chugging along nicely. Just calling the balls and strikes here, folks. Nothing more, nothing less.
Good luck out there.
<Terry Liebman>

