
SHI 8.6.25 – “You’re Fired!”

SHI 7.30.25 – Betting the Balance Sheet
July 31, 2025
SHI 8.20.25 – Our Economy in a Box
August 20, 2025
In last week’s blog, I mentioned Skynet and the movie “The Terminator” in my AI discussion.
Of course, as host of “Celebrity Apprentice” Arnold Schwarzenegger — AKA the Terminator — used the tagline “You’re terminated” when firing a game contestant. And, as we all know, that line was borrowed from the originator of the “you’re fired” tagline, our very own President Trump when he hosted his well known prime-time TV show, “The Apprentice.”
I’m guessing Erika McEntarfer was surprised to hear those words from President Trump. Yes, Erika got fired this past week. But you probably already know that. Everyone knows that. And now, we’re all asking …
“
Why fire Erika McEntarfer?“
“
Why fire Erika McEntarfer?“
First, let’s make it clear who Erika is. Or was. She was the Commissioner of the ‘Bureau of Labor Statistics,’ a federal agency created about 150 years ago to collect information about US employment and labor conditions here in the United States. My long term readers know I often quote data sourced from the BLS.
Ironically, Erika got the job in 2024, about one week into the new Trump administration — but was appointed to the position by Biden’s administration. Erika is a seasoned labor economist, holding a Ph.D in Economics, and has decades of experience in governmental roles at the Census Bureau, the Treasury Department, and even a stint on the White House Council of Economic Advisors under Biden.
But this notwithstanding, on the morning of August 1st, after the BLS reported an extremely lukewarm job growth number (only 73,000 total for the prior month) and then reported a massive downward revision of 258,000 jobs for May and June.
The BLS data was released at 8:30 am ET, and hours later, at 2 pm ET, Erika founds herself unemployed.
In a ‘Truth Social’ post President Trump accused her of “manipulating employment data for political purposes“. Is this accusation accurate? Did Erika deserve to be fired? Or was the BLS data accurate and we should be worried about the labor markets?
Welcome to this week’s Steak House Index update.
If you are new to my blog, or you need a refresher on the SHI10, or its objective and methodology, I suggest you open and read the original BLOG: https://www.steakhouseindex.com/move-over-big-mac-index-here-comes-the-steak-house-index/
Why You Should Care: The US economy and US dollar are the bedrock of the world’s economy. But is the US economy expanding or contracting?
Expanding … according the ‘advanced’ reading just released by the BEA, Q2, 2025 GDP grew — in ‘current-dollar‘ terms — at the annual rate of 5%.
The ‘real’ growth rate — the number most often touted in the mainstream media — was 3.0%. In current dollar terms, US annual economic output rose to $30.331 trillion.
According to the IMF, the world’s annual GDP expanded to over $110 trillion in 2025. Further, IMF expects global GDP to reach almost $135 trillion by 2030.
America’s GDP remains around 25% of all global GDP. Collectively, the US, the European Common Market, and China generate about 70% of the global economic output. These are the 3 big, global players. They bear close scrutiny.
The objective of this blog is singular.
It attempts to predict the direction of our GDP ahead of official economic releases. Historically, ‘personal consumption expenditures,’ or PCE, has been the largest component of US GDP growth — typically about 2/3 of all GDP growth. In fact, the majority of all GDP increases (or declines) usually results from (increases or decreases in) consumer spending. Consumer spending is clearly a critical financial metric. In all likelihood, the most important financial metric. The Steak House Index focuses right here … on the “consumer spending” metric. I intend the SHI10 is to be predictive, anticipating where the economy is going – not where it’s been.
Taking action: Keep up with this weekly BLOG update. Not only will we cover the SHI and SHI10, but we’ll explore “fun” items of economic importance. Hopefully you find the discussion fun, too.
If the SHI10 index moves appreciably -– either showing massive improvement or significant declines –- indicating growing economic strength or a potential recession, we’ll discuss possible actions at that time.
The Blog:
To be clear, I have no idea if Erika or the BLS manipulated the data. I don’t believe anyone does. But I seriously doubt the BLS intentionally manipulated data.
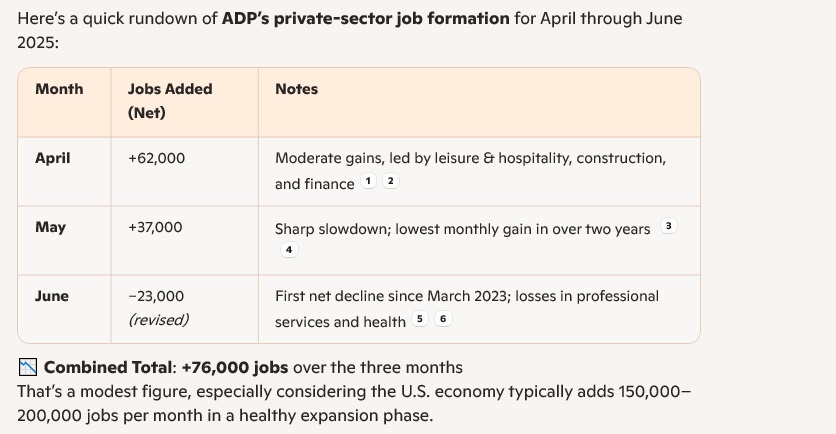
My most compelling argument is this: ALL the various employment data resources I watch have shown weakness of late. The ADP Jobs Report, which tracks “private sector” job formation has been exceptionally weak lately. Hiring momentum seems to have slowed considerably. Consider this chart, courtesy of my good friend Copilot:
The Challenger Jobs Report is a monthly snapshot of US planned corporate layoffs. Challenger tracks announced job cuts by companies, not actual separations. The report focuses on large-scale layoffs (typically 50+ employees) and breaks down the data by industry, region, and reason (e.g. economic conditions, restructuring, AI adoption).
It’s a good “early warning signal” for managerial-level labor-market shifts. The July report announced 62,075 job cuts (up 29% from June). Note: 2025 Y-T-D cuts already surpass all of 2024 combined.
Then we have a sub-index within the Institute of Supply Management ‘Non-Manufacturing Purchasing Managers’ Index (PMI) — known as the ISM Services PMI. It specifically measures changes in employment levels across service-sector firms. This metric helps us understand if companies in service industries like finance, healthcare, retail, and hospitality are hiring, steady, or reducing staff. A reading above 50 indicates expansion in employment; below 50 signals contraction.
In July 2025, the employment index fell to 46.4, meaning more service-sector firms reported declines in staffing than increases. That’s a notable drop and suggests caution in hiring, even as other components like production remained solid.
So, I’ll repeat: I doubt the BLS data was manipulated. All other data feeds that I track support the BLS numbers. For more than 100 years, economists have taken all BLS data at face value. And while past Presidents have criticized various economic reports, this is the first time a sitting BLS commissioner was publicly accused of manipulating data for political purposes. Could it be true? Sure. But I doubt it.
What may be losing efficacy, however, is the data collection process itself. Here I have concerns.
The BLS does a monthly survey incorporating responses from 120,000 American businesses selected from a much larger universe of about 10 million US business establishments. Yes, it’s a small sample, but this methodology has been used by the BLS since 1954. That’s about 70 years. In other words, today’s methodology is consistent will all prior employment surveys and reports. While the sample may, at first glance, seem small, the businesses surveyed have more than 660,000 individual worksites included within the survey.
But here is something that is not consistent: The “initial” response rate. Consider this chart, again courtesy of Copilot:

Well, that’s not good. In the past 10-years, the initial response rate has plummeted. I don’t know why. The “initial” period is only about 2 weeks — meaning that if the BLS does not get that response, they cannot include it within the data analysis. In some respects, it makes sense, right? After all, this is a monthly survey … so giving the respondent about 1/2 a month to reply makes sense. But many more businesses today are not responding in a timely manner.
But they do ultimately respond. They just take longer than the 2-weeks allocated for the initial response. And those “late” responses drive all subsequent revisions. As you see above, the “final” response rate is almost unchanged over the past 10-years. Could that data be manipulated by the commissioner? Perhaps. But it feels to me like it would be difficult to do so. Thus, absent more information, I’ll assume the data, as revised, is accurate.
And so as we move beyond the drama and dig into the data, we have to wonder if these new job formation numbers are concerning. Do they suggest America’s economy is slowing and a recession is imminent? Now that’s a meaty question, worthy of the Steak House Index!
In his most recent blog on Substack, Sam Ro shared this graphic image.
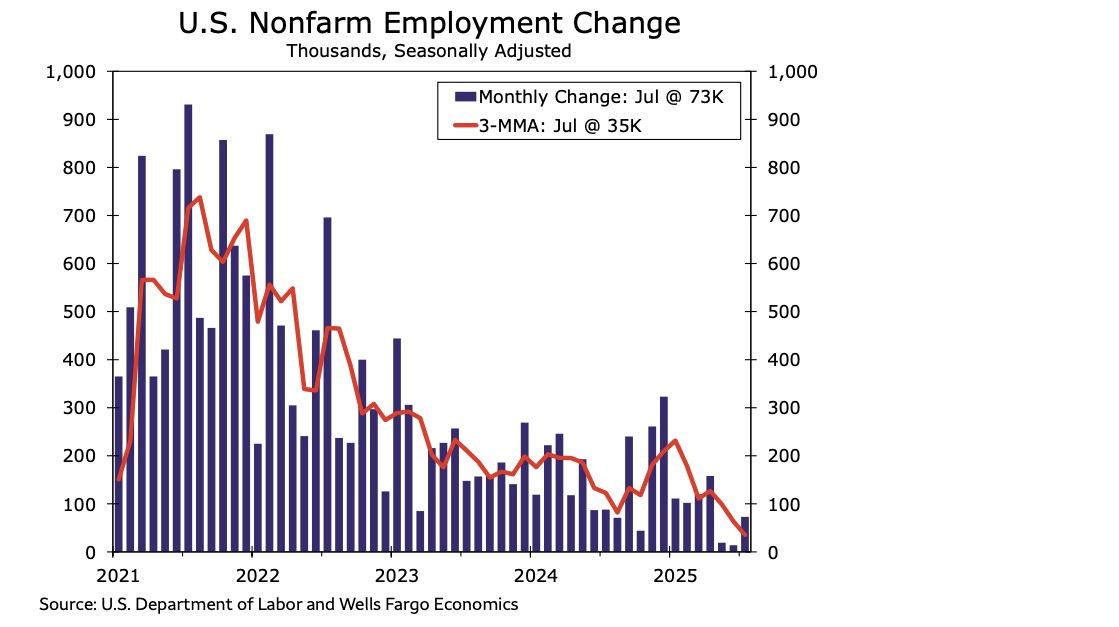
I validated the data on the FRED website. The trend made clear in the 3 month-moving-average — the RED line in the graph above — is concerning. New job creation has clearly been decelerating during the past 5-years. Fortunately, it hasn’t gone negative. Employment levels remain fairly high, even though unemployment did tick up ever so slightly by 0.1% to 4.2% during July. Per that report, there are more than 163.1 million Americans gainfully employed at this point in time.
But that trend line is concerning to me. Frankly, I’m surprised the FED does not find it concerning. When making their “cut” or “no change” decision on short-term interest rates about 1 week ago, they certainly possessed this same data. And while they also have a tough job, balancing the dual issues of “full employment” against “constraining inflation,” frankly I’d be a bit more concerned about employment right now. I may disagree with Trump’s decision to quickly fire Erika, but I agree with the Trump administration’s feeling about interest rates: They are too high. In my opinion, the FED should have already cut the FFR … and that delay may ultimately be responsible for a higher unemployment rate in the coming months.
At the same time, the most recent GDP report — also released last week — seems to suggest the US economy is doing just fine. GDP is growing … and the consumer is spending. According to the Bureau of Economic Analysis (BEA):
“Real GDP increased at an annual rate of 3.0 percent (0.7% quarterly rate) in the second quarter, primarily reflecting a decrease in imports and an increase in consumer spending that were partly offset by decreases in investment and exports.”
At the same time, current dollar GDP grow by 5.0 percent to the annualized rate of $30.331 trillion! Very impressive!
So, I’m asking myself questions about 2 related issues right now.
First, is the slow-down in new job creation the result of industrial efficiency due to advances in AI? Are we witnessing the early stages of a labor productivity boom? Or, in fact, is the US economy slowing? Is a layoff tsunami coming?
Second, is our GDP growing due to the AI infrastructure spending by the hyperscalers while, at the same time, our consumers are strained and spending less? Or are consumers still spending their hard earned, employment dollars at the same robust, historic levels?
Let’s take a closer look. First, here is the data on consumer spending as a percentage of GDP for the past 10 years:
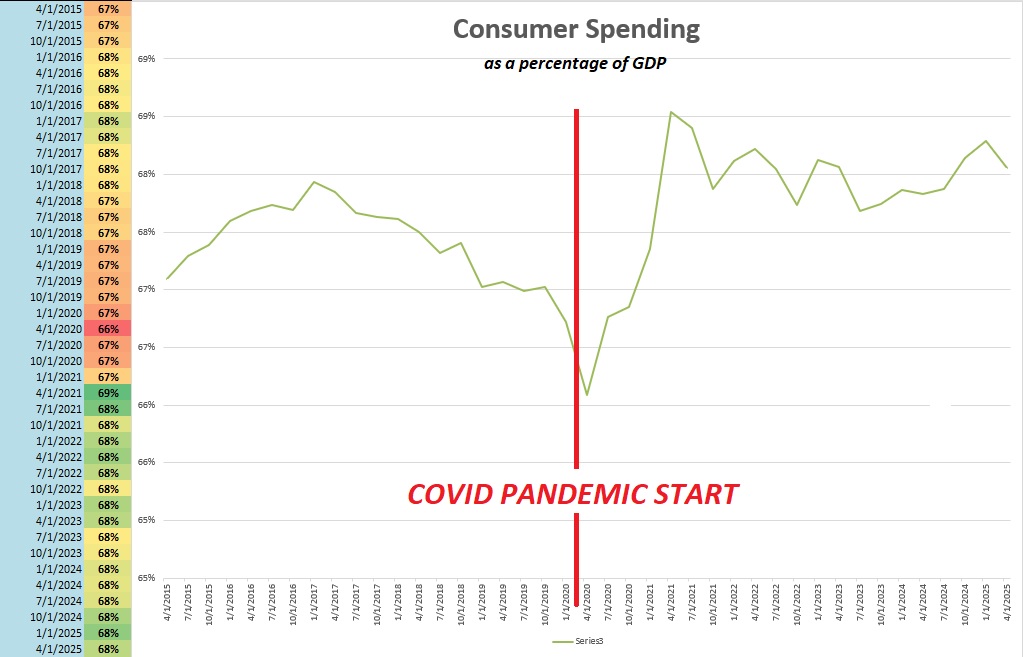
In the 5-years before the pandemic, consumer spending was consistently around 67-68%. Post-pandemic, spending was higher as a percentage of GDP — often between 68-69%. This makes sense to me: The monstrous money supply increase, post-pandemic, clearly gave the consumer more money to spend, and clearly triggered that generational CPI bulge which ultimately caused the FED to lift the FFR back in 2022.
So, clearly, the consumer is spending. About 2/3 of the GDP remains consumer spending. In the most recent reading, the American consumer was consuming at the annualized rate of $20.641 trillion. That’s amazing. Consider this interesting fun fact: The ENTIRE GDP back in 2019, just before the pandemic began, was almost about the same (just a little higher.) So today’s consumer spending is almost equal to the entire GDP just 5 years ago! Amazing.
In the final analysis, I will go out on a limb and answer the questions this way.
<> GDP <>
I am feeling bullish on GDP and the economy at large. GDP is growing because all cylinders are firing. Some better than others, but firing nonetheless. We must have economic concerns in housing and consumer spending headwinds.
The AI infrastructure expansion is real.
Neil Dutta is the Head of Economics at Renaissance Macro Research (RenMac), a prominent macroeconomic research firm catering primarily to institutional investors. Dutta is known for his data-driven, often contrarian takes on economic trends, with frequent appearances in financial media such as Bloomberg, CNBC, and the Wall Street Journal. In a recent blog post, Dutta commented, “We provide a simple illustration of this. I define AI-adjacent as the following: information processing equipment investment, software, power facilities construction, manufacturing structures, and data center construction. Tally this up and we are looking at roughly six percent of US GDP, more than what we saw in the late-90s. It’s been growing by about ten percent per year for the last two years. So, that’s a 0.6 ppt tailwind to GDP growth.”
I generally agree with Neil. But I think the tailwind is even stronger. I believe our AI investment boom will boost nominal GDP growth by at least 0.75% each year for the next 3-5 years. Deglobalization and aggregate tariff-triggered on-shoring will add another 1/2 of 1% each year over the next 3.5 years. Both should provide significant lift to US GDP growth in the coming years.
…. alternatively ….
<> LABOR <>
I am less sanguine on the topic of US labor. I feel AI is already contributing to slower new job formation. The current administration’s heavy-handed and inconsistent economic policies have created consumer and investment uncertainty, here and abroad, both of which adversely impact economic growth, further slowing new job formation. And may result in layoffs and an appreciably higher unemployment rate in the coming years. These are not welcome developments.
Might consumer consumption be adversely impacted as a result?
Maybe. But probably not excessively. You have to remember this:
Consumer consumption is not monolithic.
Meaning each “cohort” behaves differently. Splitting consumers into 4 quartiles is helpful when parsing the data. Overall, consumption across the economy will likely hold up fine; however, the two (2) lowest demographic quartiles will probably struggle. I believe they are struggling now. Price levels are high. Interest rates are high.
At the other end of the spectrum, of course, our Steak House Index patrons are less affected by the higher rates.
Which, once again, is unfortunate since I remain of the opinion that the continue delay in short term rate cuts by the FED is the source of some of that pain. These two groups are the biggest users of consumer debt. When credit card rate and auto loans rates remain at decade highs, they feel it most. So I’ll repeat again: Thru the lens of ‘cost / benefit’ I feel a 50 basis point FFR rate cut is easily supportable. And it would be better sooner than later.
Speaking of steak houses …….
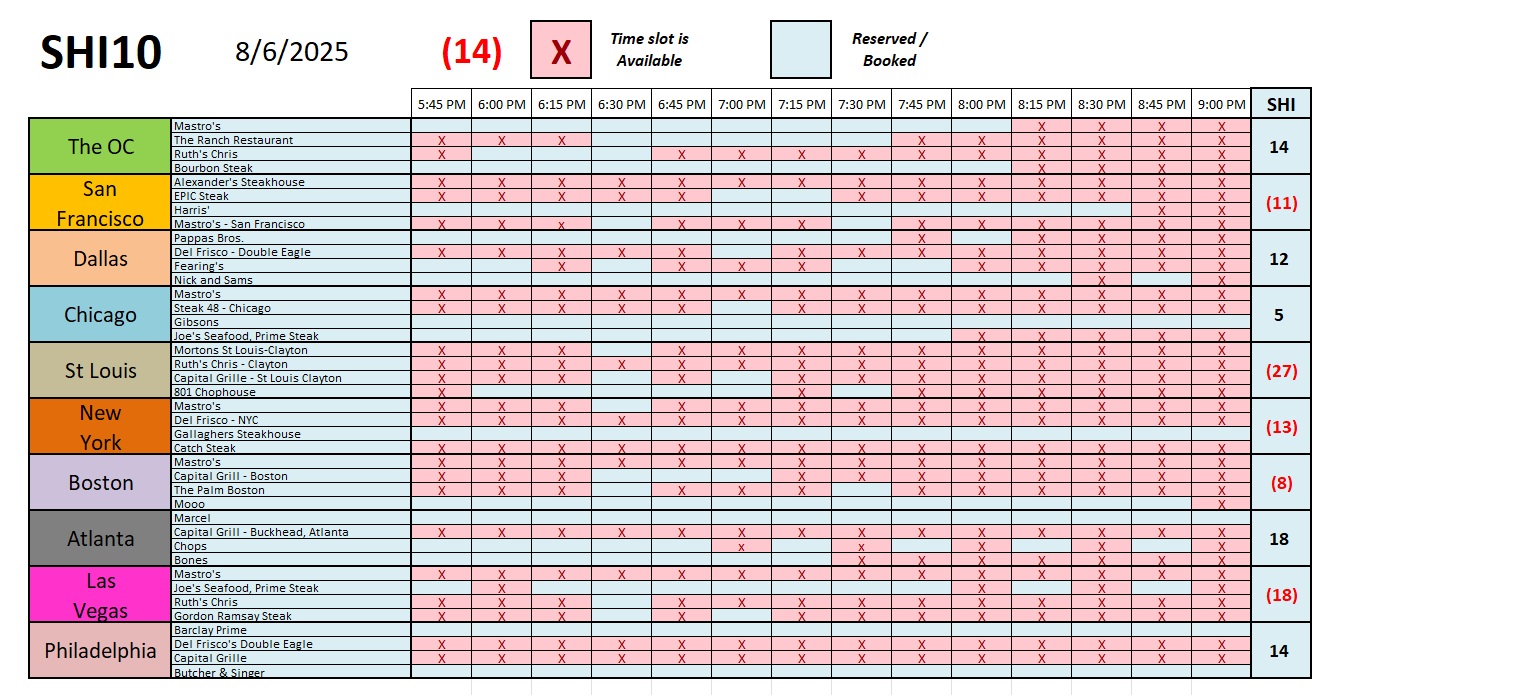
We’re seeing a slight increase in demand for expensive eatery reservations this week. Slight. Nothing statistically meaningful. Overall trends remain consistent yet again:
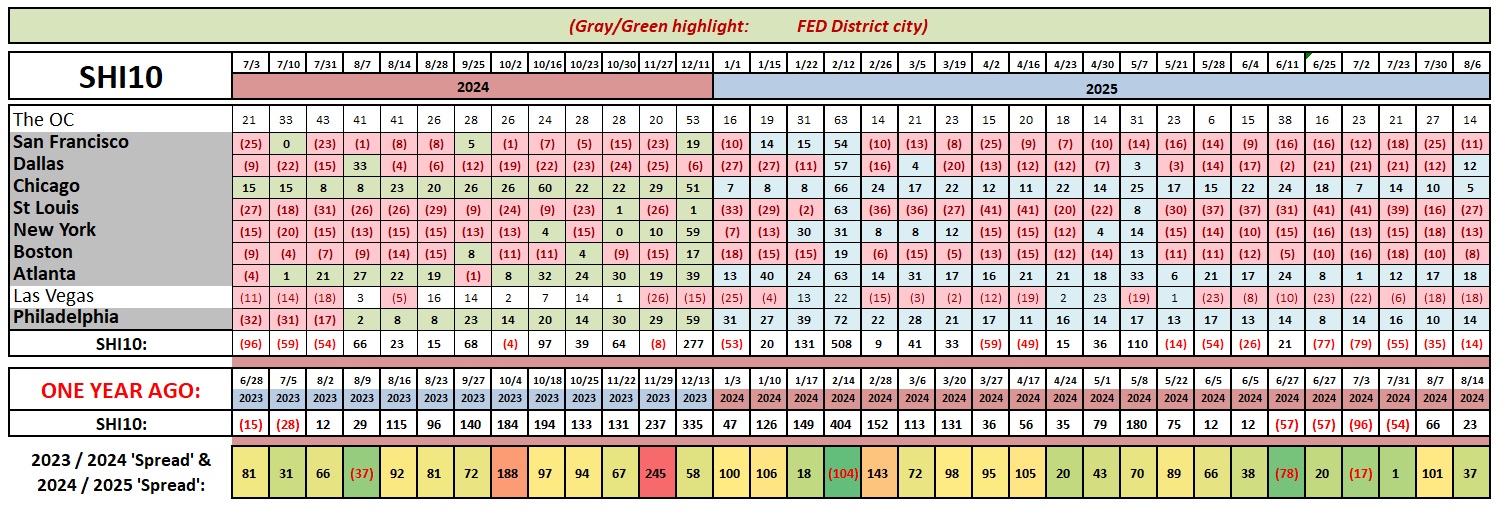
Essentially the SHI10 has been in the red for months now. And unlike the warm red-center of the rib eye loved by rare steak lovers, red readings are the opposite here: They suggest overall demand is tepid. Clearly, even the top two “consumer consumption” quartiles are feeling pinched. Somewhat. But the consistency in demand is reassuring. Somewhat.
Let me finish today’s post with a final comment on the AI boom and the downstream. Some quick, back-of-the-napkin math suggests that a 1% lift in a $30 trillion economy will add about $300 billion to US GDP. Historically, the US Treasury collects between 17% to 19% of gross GDP in “tax” revenues. So, finishing that calculation, it looks like a 1% lift in GDP will add about $50 billion each year to Treasury revenues. If the lift was 1.5%, that number would be $75 billion. These are significant numbers that would make a significant dent in our annual spending deficit.
Thanks for tuning in.
< Terry Liebman >

