
SHI 5.22.24 – Dow 60,000?

SHI 5.8.24 – No, It’s Not Your Imagination
May 8, 2024
SHI 6.5.24: Argentina is Going to the Dogs
June 5, 2024
Friday of last week, the Dow Jones Industrial Average, commonly known as “the Dow,” closed above 40,000 for the first time in history.
Stock market fanatics assure us that Dow 100,000 isn’t far off; detractors, of course, have a very different take, fearing the bubble will soon pop.
“
To the MOON ! ! !“
“To the MOON ! ! !“
So which is it? Are we riding Nvidia and the entire market “to the moon,” borrowing that phrase from our crypto-buddies? Or is this just another bout of “irrational exuberance” al la Alan Greenspan? This is a worthwhile discussion, right? 🙂
Welcome to this week’s Steak House Index update.
If you are new to my blog, or you need a refresher on the SHI10, or its objective and methodology, I suggest you open and read the original BLOG: https://www.steakhouseindex.com/move-over-big-mac-index-here-comes-the-steak-house-index/
Why You Should Care: The US economy and US dollar are the bedrock of the world’s economy. But is the US economy expanding or contracting? Expanding …. By the end 2023, in ‘current-dollar‘ terms, US annual economic output rose to an annualized rate of $27.94 trillion. After enduring the fastest FED rate hike in over 40 years, America’s current-dollar GDP still increased at an annualized rate of 4.8% during the fourth quarter of 2023. Even the ‘real’ GDP growth rate was strong … clocking in at the annual rate of 3.3% during Q4.
According to the IMF, the world’s annual GDP expanded to over $105 trillion in 2022. Further, IMF expects global GDP to reach almost $135 trillion by 2028 — an increase of more than 28% in just 5 years.
America’s GDP remains around 25% of all global GDP. Collectively, the US, the European Common Market, and China generate about 70% of the global economic output. These are the 3 big, global players. They bear close scrutiny.
The objective of this blog is singular.
It attempts to predict the direction of our GDP ahead of official economic releases. Historically, ‘personal consumption expenditures,’ or PCE, has been the largest component of US GDP growth — typically about 2/3 of all GDP growth. In fact, the majority of all GDP increases (or declines) usually results from (increases or decreases in) consumer spending. Consumer spending is clearly a critical financial metric. In all likelihood, the most important financial metric. The Steak House Index focuses right here … on the “consumer spending” metric. I intend the SHI10 is to be predictive, anticipating where the economy is going – not where it’s been.
Taking action: Keep up with this weekly BLOG update. Not only will we cover the SHI and SHI10, but we’ll explore “fun” items of economic importance. Hopefully you find the discussion fun, too.
If the SHI10 index moves appreciably -– either showing massive improvement or significant declines –- indicating growing economic strength or a potential recession, we’ll discuss possible actions at that time.
The Blog:
In my opinion, the answer is neither.
Other than spacecraft, nothing is going to the moon right now. Nor is the market exuberance irrational. There is plenty of exuberance, of course, but I feel it is perfectly rational.
Why?
The short answer is corporate profits.
And let’s talk about an index that’s easier to measure: The S&P500 index, which, also, has hit new all-time highs. Depending on who you ask, and whether you use the TTM or the “forward” earnings, the S&P500 has a ‘price/earnings’ (P/E) ratio of around 20. Meaning, the value of the index is about 20 times the coming year’s aggregate profits of the 500 companies in the index. If the next 12-month’s collective profits come in at $260, then 20 times that figure is 5200 – about where the index is today.
Assuming the P/E ratio remains around 20 – something widely discussed and debated – then if corporate profits increase, it stands to reason the S&P500 index will increase as well.
Let’s start with this chart, courtesy of the St Louis FED:
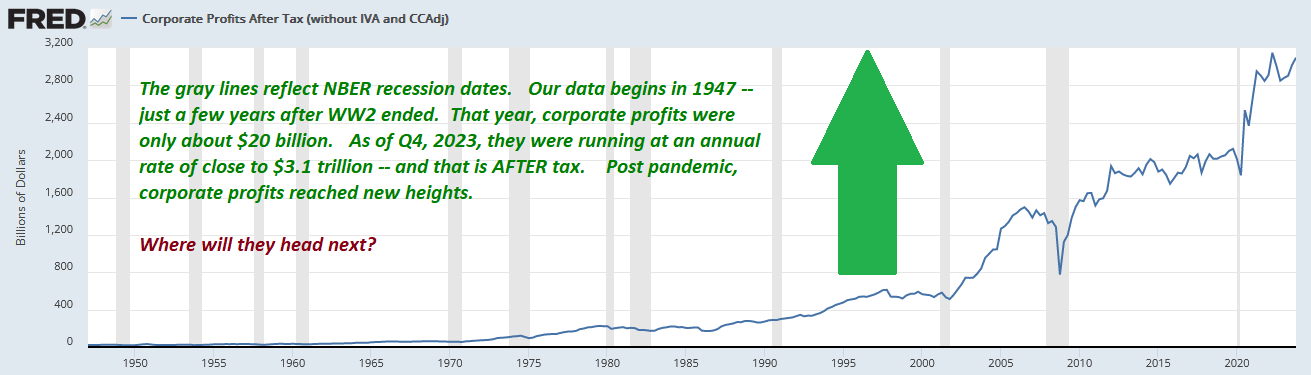
Where will profits head next? Up again? Great question. But before we answer that one, let’s take a brief detour.
Remember, corporate profits are not real. ?
That’s an econ joke. Ha ha ha. Yes, they are real, but they are not “real” — as in they are not inflation adjusted. Corporate profits, just like the value of a stock, are always quoted in current-dollars. Thus, the chart above has been, and always will be, impacted by inflation. Inflation pushes up costs, but it also pushes up corporate profits for many public companies. Inflation, in many respects, is actually a good thing for stock prices!
It’s interesting to see how profits and inflation move in a seemingly similar pattern:

Consider this: When the pandemic began, corporate profits were about $2.2 trillion and the CPI was 259. By the end of 2023, profits were up to about $2.9 trillion and the CPI index had increased to 313. Said another way, while the CPI was up about 20%, corporate profits were up over 31%. So on a “real” basis – after an inflation adjustment – corporate profits were up just 11% over that time period. The balance of the profit increase, I suggest, we can attribute to inflation.
And while the correlation between the two is loose at best, the directional movement is definitely correlated. A significant portion of corporate profits is driven by underlying inflation.
Inflation, money supply, consumer spending, America’s balances sheet – all are expected push corporate profits in the coming quarters. According to Yardeni, professional stock analysts expected S&P500 “earnings per share” (EPS) to increase 1.2% (YOY) in the first quarter of this year. They were wrong. Profits actually increased at the annualized rate of 6.3%.
Those same analysts estimate that EPS will be $244 this year, $278 in 2025, and $313 in 2026. Which, Yardeni argues, suggests $400 EPS is possible by 2030.
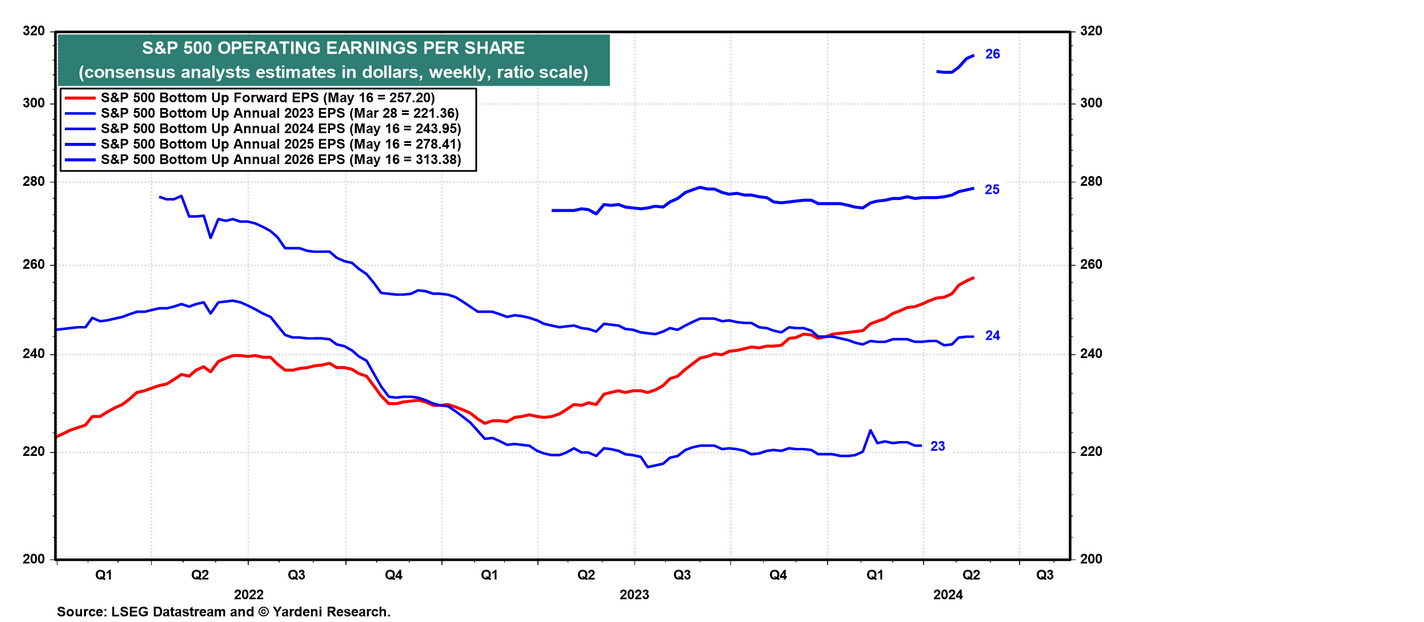
If the P/E ratio holds around 20, then, math suggests the S&P500 could be 8,000 by 2030 – a 50% increase from today’s level. By extension, a 50% increase in the DOW from its current level is 60,000. And once again, a sizable piece of any increase will caused by underlying inflation and price levels.
Consider this thought: Owning stocks is a good hedge against inflation. In my opinion, it can be a better place for your dollars than a bank CD, if inflation is running hot.
For example, if you like and drink ‘Diet Coke,’ and the price doubles between 2020 and 2030, you will pay more for a can. But if you buy and own their stock, and it increases 50% between now and 2030, you’ve made money off the same company. Even better, while you’re waiting for the stock price to increase, ‘KO’ will pay you a 3.1% annual dividend. Not bad.
Maybe coffee is your drink. Coffee prices are up more than 21% since the pandemic.
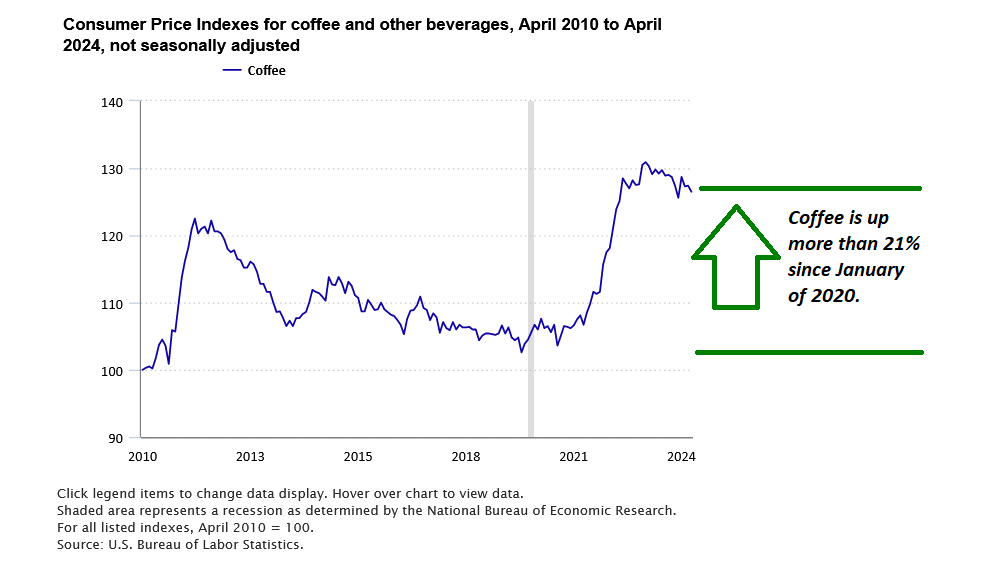
If your cup of Joe costs more today at Starbucks or Dutch Bros, stop fretting and buy the stock. Then the price hikes won’t be so bitter. ?
If Taylor Swift concerts are your thing, consider buying stock in Live Nation, the owner of Ticketmaster. The stock price is up more than 50% in the past 5 years — far more than the increase in the “Consumer Price Index for all Urban Consumers: Admission to Movies, Theaters, and Concerts in the US City Average.” That index has moved from 184 to 226 in that 5-year period, a 22% increase. Use those stock market gains to buy a ticket to your favorite concert!
Of course, all predictions for a stock value jump are speculative. I am aware of at least one respected economist that is predicting a 100-year (later) repeat of the Great Depression in 2029 or 2030. Such an event would likely crush the stock values, much like the experience in 1930. One outcome is impossible if the other occurs. But we don’t need that dire an outcome for the markets to “tank.” In a recent interview, Chase CEO Jamie Dimon again raised the possibility of a US economic “hard landing” and “stagflation.” Both, of course, would be very bad for GDP growth and the economy as a whole. “Possibility” is certainly not “probability”. And the fact that there is a greater-than-zero chance of either does not make them likely.
No, I am of the opinion that if markets do fall dramatically, the event or events that triggered the fall are more likely to be something not currently on our radar — more of a ‘black swan’ event. Such an unexpected event would dramatically alters economic or financial conditions, or overall consumer confidence, leading to a significant decline in consumer spending. Imagine a huge tax hike — whether corporate or individual. Or imagine China invading and annexing Taiwan. There are plenty of currently unknown world events to worry about.
The path to DOW 60,000 or S&P500 8000 by 2030 is not assured. Paraphrasing Mr. Dimon, it is possible … but I’m not sure how probable. Ultimately, reality is likely far different – whether up or down, higher or lower. Who knows: The Dow could hit 100,000 by 2030. It’s possible. 🙂
But as with the Steak House Index, speculation is tasty!

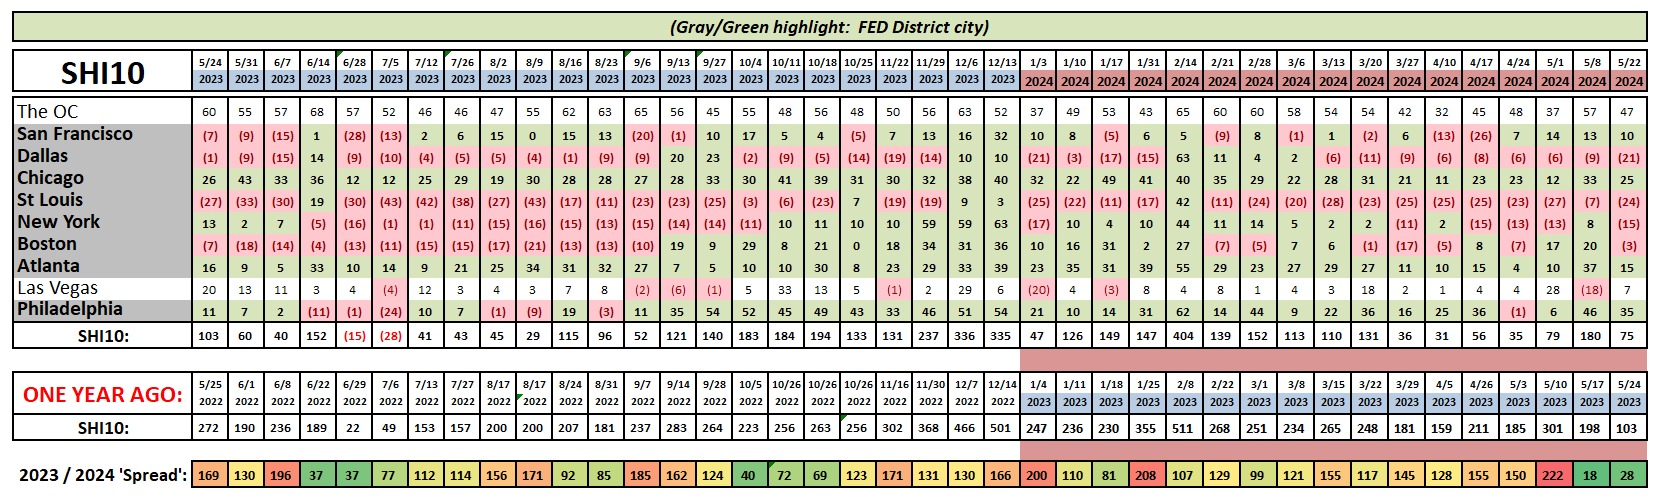
Not much has changed from a couple weeks ago. Reservation demand was a bit lower in the OC, Dallas, and St Louis, but improved in ‘Vegas. All in all, this is a ‘snoozer‘ of a report … nothing to get overly excited about here. ZZZZZZZZzzzzzzz.
Earlier Wednesday, the FED released minutes from their last meeting. Records show that officials were clearly lamenting the fact that the inflation rate has not come down as quickly as they had hoped. I agree. As we’ve discussed numerous times in prior blogs, many consumer prices are high and moving higher.
Which is why I believe corporate profits are a very likely beneficiary over time. And as those profits increase, stock values should do the same. My 2 cents, folks. 🙂
<:> Terry Liebman


