
SHI 5.8.24 – No, It’s Not Your Imagination

SHI 5.1.24 – Look Out Below, The Yen is Falling
May 1, 2024
SHI 5.22.24 – Dow 60,000?
May 23, 2024
Post-pandemic, inflation became a real thing. Price levels are up significantly.
The CPI is an mediocre index. But it’s the index we have. And as I’ve said many times before, at least the index has been in consistent use for decades and the methodology is relatively consistent. It’s not definitive, but it is indicative. Especially when we look at some of the individual components and compare price levels in January of 2020 to today.
When you do, you’ll see prices for new autos, auto maintenance and auto insurance are up 21%, 34% and 45% during that period.
“
Some price levels are way up.“
“Some price levels are way up.“
Yes, auto insurance is up 45%. It’s not your imagination.
“Food at home” is another CPI component. It is up about 26% since January of 2020. Electricity? Up about 31%. Clothing costs are flat. That’s good.
But not the “shelter” or housing component. That one — the largest single CPI component, comprising more than 36% of the total CPI index — is up a whopping 108% since January of 2020.
Welcome to this week’s Steak House Index update.
If you are new to my blog, or you need a refresher on the SHI10, or its objective and methodology, I suggest you open and read the original BLOG: https://www.steakhouseindex.com/move-over-big-mac-index-here-comes-the-steak-house-index/
Why You Should Care: The US economy and US dollar are the bedrock of the world’s economy. But is the US economy expanding or contracting? Expanding …. By the end 2023, in ‘current-dollar‘ terms, US annual economic output rose to an annualized rate of $27.94 trillion. After enduring the fastest FED rate hike in over 40 years, America’s current-dollar GDP still increased at an annualized rate of 4.8% during the fourth quarter of 2023. Even the ‘real’ GDP growth rate was strong … clocking in at the annual rate of 3.3% during Q4.
According to the IMF, the world’s annual GDP expanded to over $105 trillion in 2022. Further, IMF expects global GDP to reach almost $135 trillion by 2028 — an increase of more than 28% in just 5 years.
America’s GDP remains around 25% of all global GDP. Collectively, the US, the European Common Market, and China generate about 70% of the global economic output. These are the 3 big, global players. They bear close scrutiny.
The objective of this blog is singular.
It attempts to predict the direction of our GDP ahead of official economic releases. Historically, ‘personal consumption expenditures,’ or PCE, has been the largest component of US GDP growth — typically about 2/3 of all GDP growth. In fact, the majority of all GDP increases (or declines) usually results from (increases or decreases in) consumer spending. Consumer spending is clearly a critical financial metric. In all likelihood, the most important financial metric. The Steak House Index focuses right here … on the “consumer spending” metric. I intend the SHI10 is to be predictive, anticipating where the economy is going – not where it’s been.
Taking action: Keep up with this weekly BLOG update. Not only will we cover the SHI and SHI10, but we’ll explore “fun” items of economic importance. Hopefully you find the discussion fun, too.
If the SHI10 index moves appreciably -– either showing massive improvement or significant declines –- indicating growing economic strength or a potential recession, we’ll discuss possible actions at that time.
The Blog:
Looking at the numbers above, it is no mystery why Americans, when asked, are NOT “happy with the economy.” I get it. Across the board, almost without exception, prices are up. A lot.
But the housing number is troubling. Just about every economist I read or follow agrees: The CPI methodology for shelter doesn’t work correctly. It overstates the increase in shelter cost. Remember, the CPI does not track home price increases. That’s a whole different can of worms. Essentially, the CPI is tasked with accurately measuring the price levels of items all Americans consume — not the value of their investments. And your home, by all definitions, is an investment.
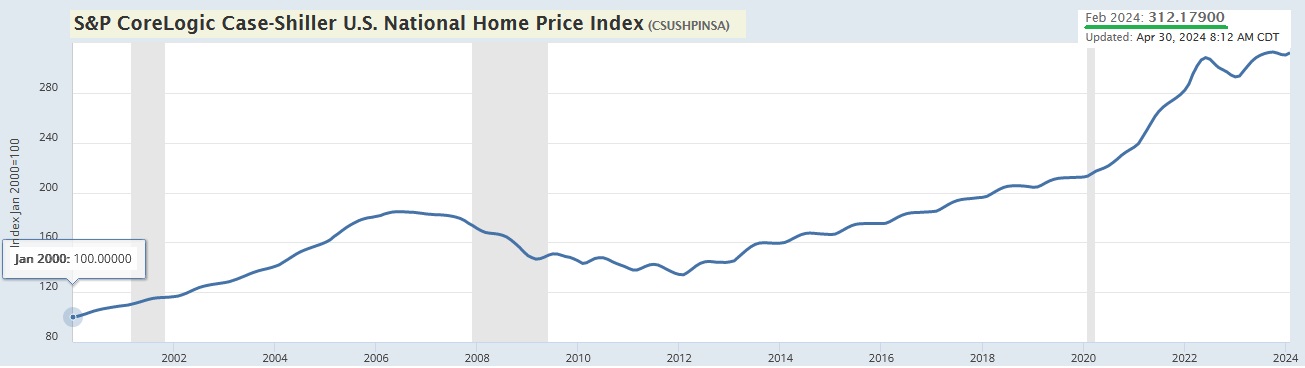
But for a brief moment, let’s take a tangent. The ‘S&P CoreLogic Case-Shiller US National Home Price Index’ measures home price changes. Pegging January of 2020 at a ‘reading’ of 100, we see that in February 2024, the investment value of homes, in the aggregate, across American had increased over 212%.
The house cost increase is a whole different issue. We’ll tackle that one again in a future blog.
For now, let’s get back to the cost of shelter in the CPI. It’s up 108% since the pandemic began. Or is it?
Yardeni doesn’t agree. His comments from a recent economic update:
A big contributor to inflation remains owners’ equivalent rent, a bizarre concept that is an estimate of how much rent homeowners would have to pay themselves if they were their own landlords.
Without it, the inflation rate is already down almost to the Fed’s 2.0% target?
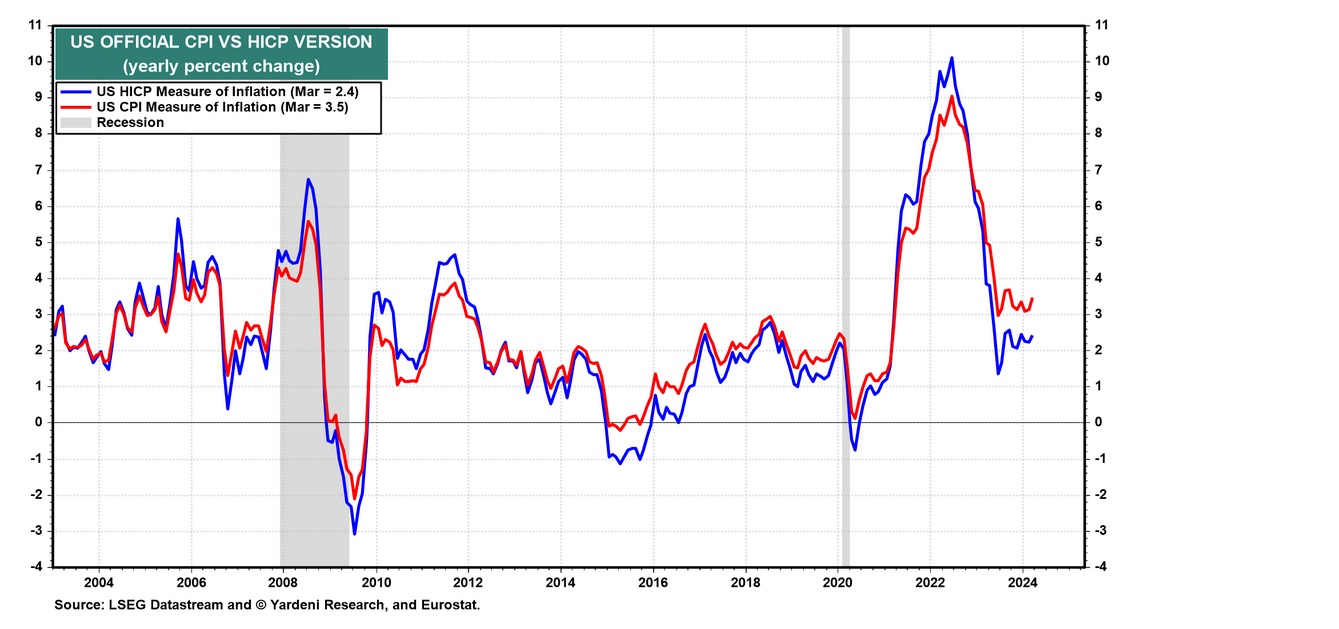
The Harmonized Index of Consumer Prices (HICP) is a measure of inflation in the Eurozone and the European Union. On its website, the Bureau of Labor Statistics (BLS) states: “The HICP differs from the U.S. Consumer Price Index (CPI) in two major respects. First, the HICP includes the rural population in its scope. Second, and probably more importantly, the HICP excludes owner-occupied housing. To construct the R-HICP, the CPI was narrowed to remove the owner-occupied housing costs that the HICP excludes from its scope. The CPI does not collect prices in rural areas, and the R-HICP uses price data collected for the CPI-U population, so this research index does not exactly match the population coverage of the HICP.”
The R-HICP measure of inflation has been closely tracking the headline CPI measure since the start of 2023 (chart). The former has been hovering between 2.1%-2.6% y/y since August 2023, while the latter has been hovering around 3.0%-3.7%.
Interesting. Yardeni created a cool graphic to compare the two indices:
Paul Krugman, the Nobel prize-winning economist, agrees. Krugman’s comments on the same topic:
And shelter is a special problem. The Bureau of Labor Statistics measures the price of shelter by looking at rents — the actual rents that people pay if they’re renters, and an estimate of what they would be paying as renters if they own their own homes. But most renters have fairly long-term leases, so the average rent people are paying can lag far behind what new tenants pay, which is a better indicator for policy.
In the past, this wasn’t much of an issue. But there was a huge rent surge in 2021-22, probably driven by the rise in working from home. Estimates of new tenant rental rates show that this surge is well behind us, and rents may actually be falling, but the official numbers still have rents rising rapidly:

So it makes sense to drop housing from the core inflation measure, too.
Now, is what’s left after these exclusions a perfect measure of underlying inflation? Of course not. And one problem with excluding significant components of inflation is that what’s left may be driven by prices that we know are measured badly, like the cost of health insurance. But there are problems with index shopping, too; if you keep looking for better measures of underlying inflation, there’s always the temptation to pick the measures that tell you what you want to hear. Actually, one reason I made a point of posting about this measure is that I’ve used it before, so I wanted to stay consistent.
Fortunately, at this point most measures of underlying inflation are telling the same story: We’re way down, probably under 3%, although maybe not all the way to the Fed’s target of 2%.
My point here? Essentially this: Economic experts all seem to agree. The ‘shelter’ component in the CPI is is a very poor metric. The methodology is questionable at best. And since this ‘housing’ component of the entire CPI represents more than 36% of the final number, this fact is problematic. Yes, housing costs are definitely up — like all other costs of living. But not by as much as the CPI housing component suggests. In fact, most economic experts believe the actual inflation rate is likely already very near the FEDs 2.0% target.
But it’s worth restating this fact: While the inflation rate may be back near 2% per year, price levels are up across the board when compared to those same price levels pre-pandemic. Significantly. It is not your imagination — prices are very, very high. And that’s why many Americans, when asked how they feel about the economy, reply with a negative reading.
Let’s check in with the steakhouses.
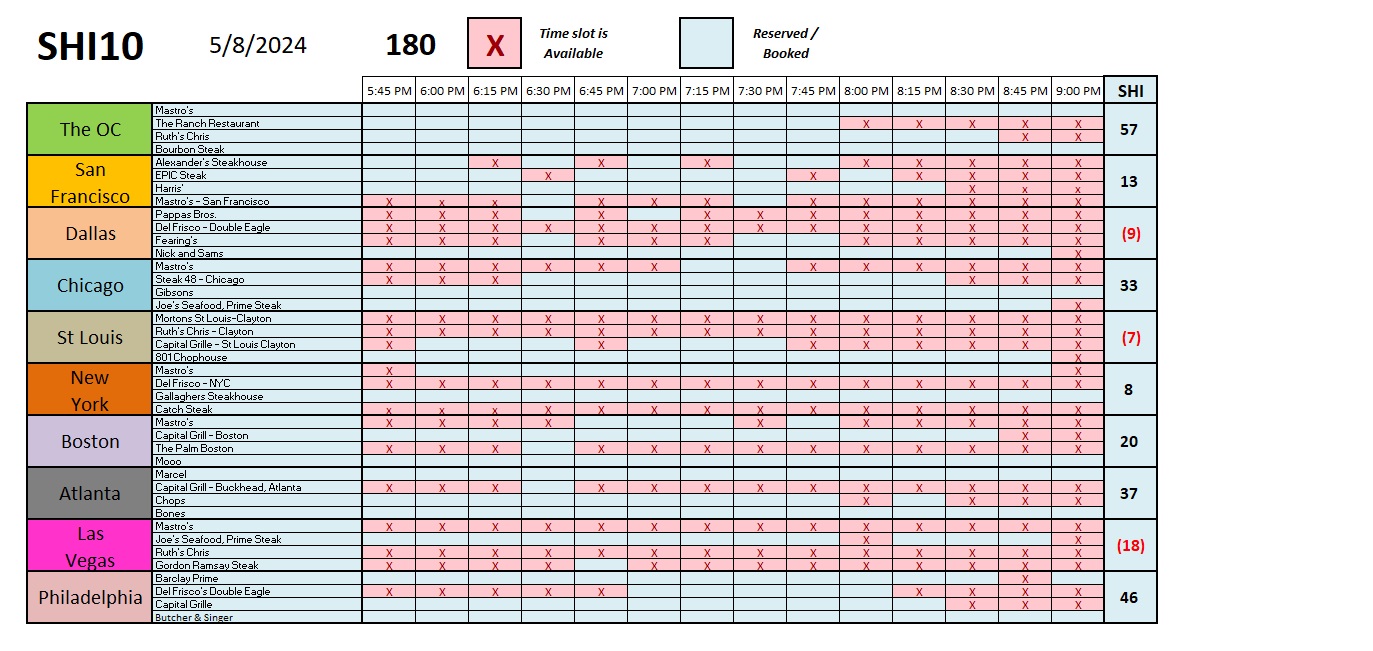
Take a look at Las Vegas — reservation demand in that city fell off a cliff this week. Last week, the SHI reading for ‘Vegas was a positive 28. This week, a negative 18. That is a huge drop.
Has ‘Vegas suddenly become undesirable? What’s happening here? I suspect ‘Mothers Day’ is the answer. And, frankly, I suspect that might be the reason behind the reservation demand bump other SHI markets are seeing this week:
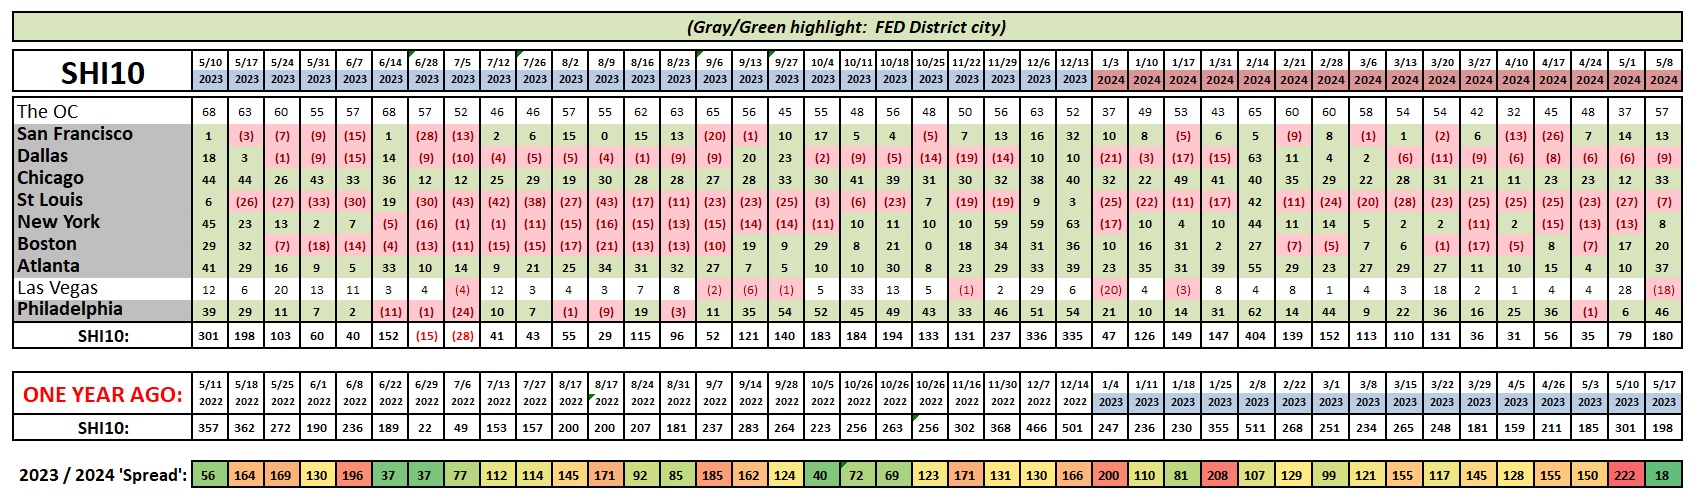
It’s interesting to see the seriously negative reading last week is quite positive this week. No trend here. 🙂
Oh, there will be no blog next week. I’m heading to the islands, ‘mon. That’s right: As they say, ‘Here today, gone to Maui.” Aloha!
<:> Terry Liebman


