
How is Your Pension Fund Performing?
‘Steak House Index’ Update – July 20, 2016
July 20, 2016‘Steak House Index’ Update – July 27, 2016
July 27, 2016Well, if you’re a member of CalPERS or CalSTRS, not so hot.
Why You Should Care: By total assets, CalPERS and CalSTRS are the two largest public pension funds in the US. Last week, these two announced their investment returns for the prior fiscal year. They were horrible; the worst showing since 2008. And we all know how bad 2008 was.
I suspect their results are representative and indicative of most public pension funds. How did your pension fund do last year?
Taking Action: Be informed. Investigate the performance of your retirement and/or pension funds. Some day, you may rely on these accounts for income.
Are there alternative decisions you can make today to improve the future results for you? Quite possibly…but to make better pro-active decisions, you must first have information.
The Blog: According to Moody’s Investors Service, in their ‘CreditOutlook‘ dated July 25th, CalPERS and CalSTRS are struggling. Their comment:
“Last week, the two largest US public pension funds announced their respective investment returns for fiscal 2016, showing their worst performances in seven years.
On Monday, California Public Employees’ Retirement System (CalPERS) said its (2016) return was 0.6%; on Tuesday, California State Teachers’ Retirement System (CalSTRS) (Aa2 stable) said its return was 1.4%. Their dismal returns follow New York State Common Retirement Fund’s similarly low 0.19% return for its most recent fiscal year ended 31 March.”
Clearly, this is not good news for the two funds that oversee a combined $484 billion for 2.6 million public workers and retirees.
Of course, a picture is worth a thousand words:
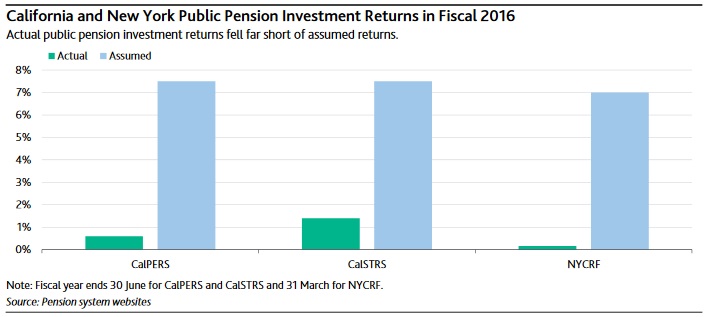
For fiscal 2016, the California plans had “assumed” investment return targets of 7.5%; New York, 7%.” Not good. Actual results, as we see, were far below the assumed target.
What does this mean? Moody’s comments further:
“For state and local public pensions as a whole, we estimate that a 1% actual investment return would produce a $230 billion shortfall to budgeted investment income…”
The FED estimates the total “defined benefit public pension assets” are $3.6 trillion and the average “assumed” investment return is 7.5%. Per year. Hmmm…
Which states have the largest public pensions? California, New York, Florida, Illinois and Texas. All of which are already struggling to meet their pension obligations.
What’s causing this problem? To a significant extent, ultra-low interest rates. And, of course, public pension funds aren’t alone. Everyone’s in the same boat … and the boat is huge.
In April, Japanese investors purchased 5 trillion yen (about $47 billion) of US Treasuries. With negative bond yields in their own country, they came to the US to find yield. Investors are able to eliminating currency risk thru a hedging strategy, and, as a result, find a positive yield.
How does this hedge work? Effectively, the Japanese investor ‘sells’ the yen/dollar currency movement risk to another investor willing to shoulder the FX risk in exchange for the rate difference between the true 10-year Treasury rate and the ‘hedged’ rate at the moment of the transaction. For example, on June 3, 2016, the 10-year Treasury yield (CMT) was 1.80%. Below we can see the ‘hedged 10-year Treasury yield was about 0.2% on that date. Thus, in exchange for accepting the yen/dollar FX risk, the ‘buyer’ receives the yield difference of 1.60% on the total amount of the exchange. The Japanese bond buyer, as a result, obtains a small positive yield without currency risk.
Then the unexpected happened: The market collapsed because the hedge cost increased significantly. The result: the hedged 10-year US yield fell precipitously and moved into negative territory:

Notice how the white line above has now gone negative? Robust activity has driven hedging cost up, and the hedged-yield down. Resulting in what is now a much less desirable yield…and lower demand for the US 10-year Treasury.
It should come as no surprise that 10-year Treasury yields began to rise right about the same time the Yen-hedged 10-year yield dipped to zero:
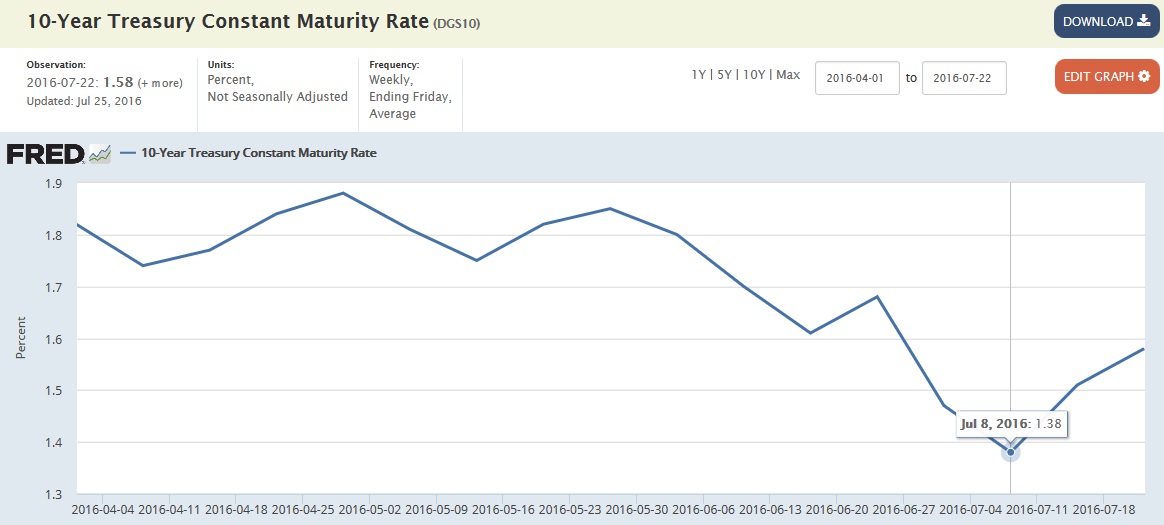
On July 8th, we saw the recent bottom in the 10-year Treasury. Today, it’s back around 1.58%. From the “Running out of Options” chart above, you can see that’s when the Yen-hedged yield fell to – and thru – zero percent.
For the average investor, investment yield is extremely difficult to find these days. For the public pension fund that must achieve about a 7% (or more) ROI, the situation is even more dire. But, ultimately, if they cannot achieve their income goals, the state must step in and fund the shortfall.
How long will today’s global ultra-low interest rates last? A great question. Take a look at this 15-year chart of 10-year yields:

Japan’s 10-year rates has been between 1 and 2% for decades. The rest of the players above are recent entrants. But look at the overall 15 year trend. It’s pretty clear: Yields have clearly been falling for years … and continue to fall.
What might reverse this long term trend? Or is this the new normal? Public pension funds – and every other entity designed around higher, ‘normalized‘ yields – are asking the same questions.
So far, none are very happy with the answers.
Two things might reverse this trend. One, much higher inflation rates. Across all developed nations. Two, a supply/demand imbalance where a significant increase in bond supply overwhelms demand.
At this moment, I see both as extremely unlikely. I believe we’re seeing the new normal … and I think we all need to reformulate our financial and pension plans incorporating very low investment yields.
- Terry Liebman


