
SHI 3.7.18 STEAKONOMICS

SHI 2.28.18: Fears and Beliefs
February 28, 2018
SHI 3.14.18 Trump, Tariffs, and Trade
March 14, 2018
Like its brother, the ‘Big Mac index,’ the Steakhouse Index predicts the future based on observed conditions. Both Burgernomics and Steakonomics are empirical in nature.
But this makes them no less valid as predictive metrics. For example, take a look at the Economist chart below. Notice the 6-month movement in just about all the currencies listed.
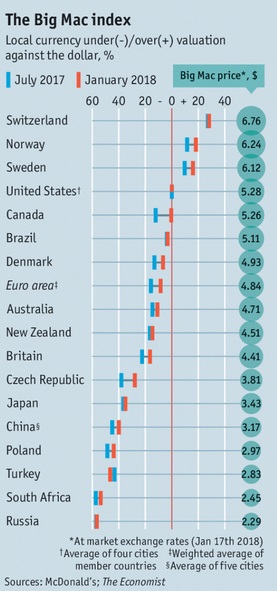
The Big Mac is available in 120 countries around the globe. Here in the US, a Big Mac will set you back $5.28. In Russia, you can get 2 Big Macs for that price … and have rubles left over. But you’ll pay $6.76 in Switzerland.
Look at the chart. The BLUE mark reflects the Big Mac index (BMI) value from July of last year. The SALMON colored mark, from January of 2018. Notice that in almost every country, the Big Mac became more expensive when priced in US dollars.
Which is precisely the outcome the BMI is predicting. In fact, according to the BMI, the US dollar is still over-valued. An interesting statement given the near 10% erosion in the ‘dollar index’ during the same time period. The BMI is suggesting the US dollar has further to fall against other currencies.
“Cheaper” currencies around the globe have narrowed the gap with the dollar — or, said another way, the dollar has depreciated against these currencies. According the Burgernomics, only the currencies of Switzerland, Norway and Sweden are overvalued against the dollar.
And the euro? How does the Big Mac suggest the euro stacks up against the dollar?
Undervalued. According to the BMI, the euro will continue to appreciate against the dollar. You had better book your summer trip now, or expect to pay more later!
The US Dollar Index is a “measure of value” of the dollar against a “basket” of other currencies, selected because they are trading partners with the US. The top 4 currencies in the basket are the euro (13.6%), the Japanese Yen (13.6%), the English pound (11.9%), and the Canadian dollar (9.1%).
All 4 have become stronger against the US dollar — just as the BMI predicted.
Summarizing: The Big Mac index is forecasting the US dollar will become even weaker against the currencies of our trading partners. If this prediction is right, there’s a chance we’ll be importing a bit more inflation from overseas. Something to keep in mind.
What is Steakonomics telling us this week? Keep reading … I think you’ll find this update quite interesting.
Welcome to this week’s Steak House Index update.
If you are new to my blog, or you need a refresher on the SHI10, or its objective and methodology, I suggest you open and read the original BLOG: https://www.steakhouseindex.com/move-over-big-mac-index-here-comes-the-steak-house-index/
Why You Should Care: The US economy and US dollar are the bedrock of the world’s economy. This has been the case for decades … and will continue to be true for years to come.
Is the US economy expanding or contracting?
According to the IMF (the ‘International Monetary Fund’), the world’s annual GDP is almost $80 trillion today.
During the calendar year 2017, US nominal GDP increased by $833 billion … by an amount approximately equal to the market capitalization of Apple. At the end of 2017, US ‘current dollar’ GDP was almost $20 trillion — about 25% of the global total. Other than China — a distant second at around $11 trillion — no other country is close.
The objective of the SHI10 and this blog is simple: To predict US GDP movement ahead of official economic releases — an important objective since BEA (the ‘Bureau of Economic Analysis’) gross domestic product data is outdated the day it’s released.
Historically, ‘personal consumption expenditures,’ or PCE, has been the largest component of US GDP growth — typically about 2/3 of all GDP growth. In fact, the majority of all GDP increases (or declines) usually results from (increases or decreases in) consumer spending. Consumer spending is clearly a critical financial metric. In all likelihood, the most important financial metric.
The Steak House Index focuses right here … on the “consumer spending” metric. I intend the SHI10 is to be predictive, anticipating where the economy is going – not where it’s been.
Taking action: Keep up with this weekly BLOG update. Not only will we cover the SHI and SHI10, but we’ll explore related items of economic importance.
If the SHI10 index moves appreciably -– either showing massive improvement or significant declines –- indicating growing economic strength or a potential recession, we’ll discuss possible actions at that time.
The BLOG:
One of my dedicated readers, and a huge help with the data collection for the SHI10, Kyle Anderson, asked a great question last week:
“How does the SHI10 ‘experience’ in 2018 compare to the SHI during the same period in 2017?”
In 2017, you’ll recall the SHI only tracked the expensive eateries in Orange County, CA. By comparison, the SHI10 tracks pricey steakhouses in 10 cities across the US. Now that we’re 10 weeks into 2018, how is this year’s experience comparing to the first 10 weeks of 2017? Let’s take a look:
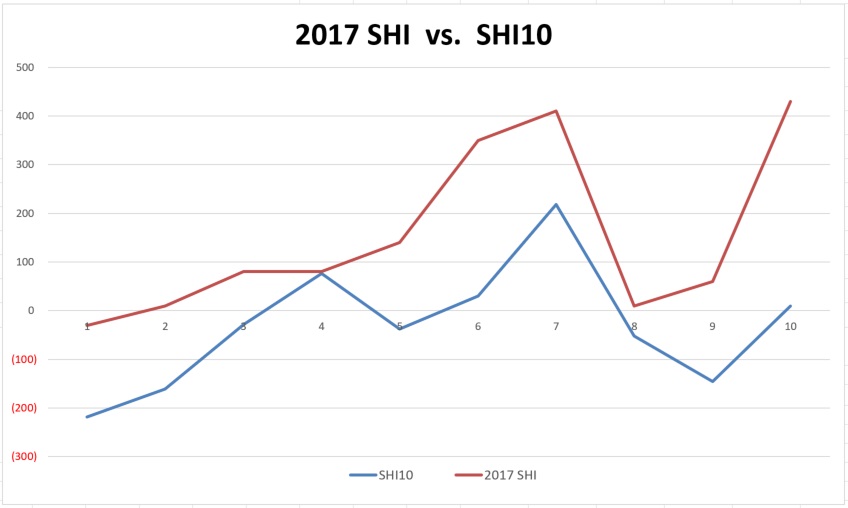
The general trend of both the SHI10 and the SHI, interestingly, are highly correlated. Both indicies start off the year slowly. And both show the “love” with a Valentines Day jump … and a valley in the subsequent two weeks. Makes sense. Credit cards were probably maxed-out on Valentines Day. 🙂
The SHI10 and the SHI both showed sharp improvement this week. Our 10-city reading is a positive 9 today. Here’s the grid:
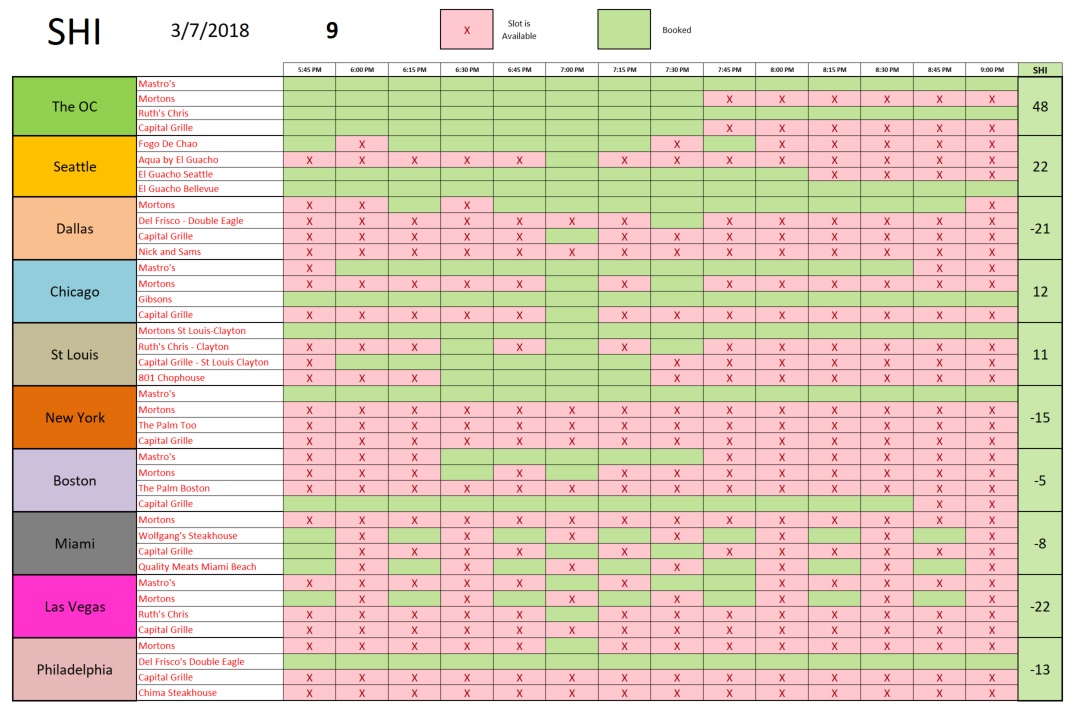
Check out the OC! Steaks for everyone! But open tables are hard to come by.
You’re probably aware of the massive storm slamming into the northeast, blanketing the entire area in snow. From Philly to NYC, it’s cold and white outside. But that isn’t stopping folks hankering for a juicy Filet at Mastro’s in NYC or Del Frisco’s “Double Eagle” in Philly. Those shops are booked. I don’t know how they plan to get to the restaurant … but I respect their optimism!
Here’s the longer term trend:
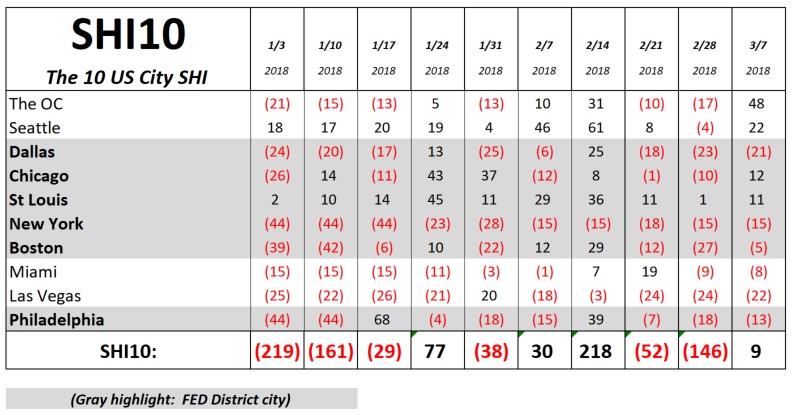
Every market, with the exception of NYC (flat), improved this week. It’s hard to believe that Boston, NYC and Philly are able to book tables for Saturday. On the other hand, perhaps we fair-weather Californians (guilty) simply can’t conceive of braving a snowstorm for a steak. Even a great steak! 🙂
The SHI10 is suggesting our economy continues to fire on all cylinders. Ironically, the FED “Beige Book” was released earlier today. Here are a few highlights from the report:
- “Economic activity expanded at a modest to moderate pace across the 12 Federal Reserve Districts in January and February.”
- “Prices increased in all Districts, and most reports noted moderate inflation.”
- “Across the country, contacts observed persistent labor market tightness and brisk demand for qualified workers, as well as increased activity at staffing placement services. Several Districts reported continued worker shortages across most sectors.”
Of course, the 32 page report contains many more nuggets. If you’re interested: https://www.federalreserve.gov/monetarypolicy/files/BeigeBook_20180307.pdf
The most interesting comment from the Beige Book, in light of all the “tariff talk,” was this:
“Four Districts saw a marked increase in steel prices, due in part to a decline in foreign competition.”
Remember, the Beige Book is reporting on conditions from January and February. A decline in foreign competition? Hmmmmm….. Fascinating.
Times are turbulent, but the economy remains robust. Burgernomics may be forecasting further declines in the dollar, but Steakonomics is predicting a sizzling US economy. I think both are accurate.
- Terry Liebman


