
SHI 4.10.24 – Jobs

SHI 3.27.24 – $27,511,234,577,616.74
March 27, 2024
SHI 4.17.24 – Wine and EVs
April 17, 2024
Jobs
It’s a small word, but a big topic.
Especially from an economic perspective here in the US. ‘Job openings’ remain significantly elevated by historic standards. For decades, the number of job openings hovered around the 5 million level each month the BLS completed the JOLTs survey. Then, in 2015, things began to change. From then, and up to the pandemic start, improving GDP growth pushed the number up until it peaked mid-2018 at around 7.6 million openings. By November of that year, America was seeking about 7.6 million folks to fill available positions. In November of that year, the unemployment rate was identical to today’s unemployment rate: 3.8%. While the unemployment rate creeped marginally lower in future months, this level is a 5-decade low. Unemployment remains at that 5-decade low rate today.
But job opening levels are not. They went the other direction. For the first time ever, during the pandemic they rose to the unprecedented level of over 12.1 million in May of 2022. Since the time of that high-water mark, the openings level has steadily declined.
“
Our labor force is growing fast.“
“Our labor force is growing fast.“
Historically, job openings decline when GDP growth declines. A slowing economy has fewer jobs to fill. And when GDP growth slows, or goes negative, that’s typically when employment levels fall, too.
But not this time. No, this time job openings fell for a completely different reason.
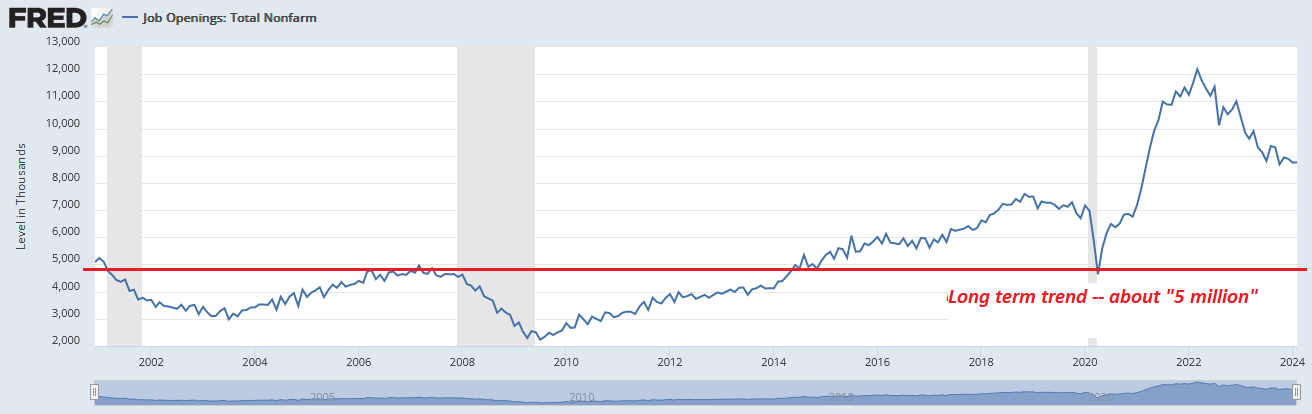
This time, job openings steadily declined from their May of 2022 peak, 20-months later, to about 8.7 million for February of 2024. While this number remains far above the historic norm, directionally it is normalizing. But there’s nothing normal – again from an economic perspective – about America’s concurrent GDP resilience and expanding labor force. This is very unusual. In fact, I would say this outcome is almost inexplicable. Immigration restrictions, demographic challenges, and outsized retirement trends suggest this outcome is impossible. Yet reality is reality.
How did this happen? How was this possible?
Welcome to this week’s Steak House Index update.
If you are new to my blog, or you need a refresher on the SHI10, or its objective and methodology, I suggest you open and read the original BLOG: https://www.steakhouseindex.com/move-over-big-mac-index-here-comes-the-steak-house-index/
Why You Should Care: The US economy and US dollar are the bedrock of the world’s economy. But is the US economy expanding or contracting? Expanding …. By the end 2023, in ‘current-dollar‘ terms, US annual economic output rose to an annualized rate of $27.94 trillion. After enduring the fastest FED rate hike in over 40 years, America’s current-dollar GDP still increased at an annualized rate of 4.8% during the fourth quarter of 2023. Even the ‘real’ GDP growth rate was strong … clocking in at the annual rate of 3.3% during Q4.
According to the IMF, the world’s annual GDP expanded to over $105 trillion in 2022. Further, IMF expects global GDP to reach almost $135 trillion by 2028 — an increase of more than 28% in just 5 years.
America’s GDP remains around 25% of all global GDP. Collectively, the US, the European Common Market, and China generate about 70% of the global economic output. These are the 3 big, global players. They bear close scrutiny.
The objective of this blog is singular.
It attempts to predict the direction of our GDP ahead of official economic releases. Historically, ‘personal consumption expenditures,’ or PCE, has been the largest component of US GDP growth — typically about 2/3 of all GDP growth. In fact, the majority of all GDP increases (or declines) usually results from (increases or decreases in) consumer spending. Consumer spending is clearly a critical financial metric. In all likelihood, the most important financial metric. The Steak House Index focuses right here … on the “consumer spending” metric. I intend the SHI10 is to be predictive, anticipating where the economy is going – not where it’s been.
Taking action: Keep up with this weekly BLOG update. Not only will we cover the SHI and SHI10, but we’ll explore “fun” items of economic importance. Hopefully you find the discussion fun, too.
If the SHI10 index moves appreciably -– either showing massive improvement or significant declines –- indicating growing economic strength or a potential recession, we’ll discuss possible actions at that time.
The Blog:
As of March of 2024, America’s ‘civilian labor force’ (CLF) was up to 167.9 million people. Of this total, 161.5 million held jobs. Just 2 years ago – in March of 2022 – the CLF was 164.2 million, and the number employed was 158.2 million. At those levels, the CLF and number employed had almost regained their pre-pandemic highs from the end of 2019.
It’s easy to see today’s numbers are significantly higher. In the past 2 years, 3.3 million more people were hired. In the past 2 years, 3.7 million more people joined the US labor force.
The cause of the bump was not demographic. Retirement rates have actually accelerated post-pandemic, shrinking the number of working Americans. During Covid, the US ‘labor force participation rate’ (LFPR) fell from 63.3% to 60.1% – in just 2 months – a 3.2% decline that was the largest on record. It never fully recovered, although it is now back up to 62.7%. This chart tells the retirement story:
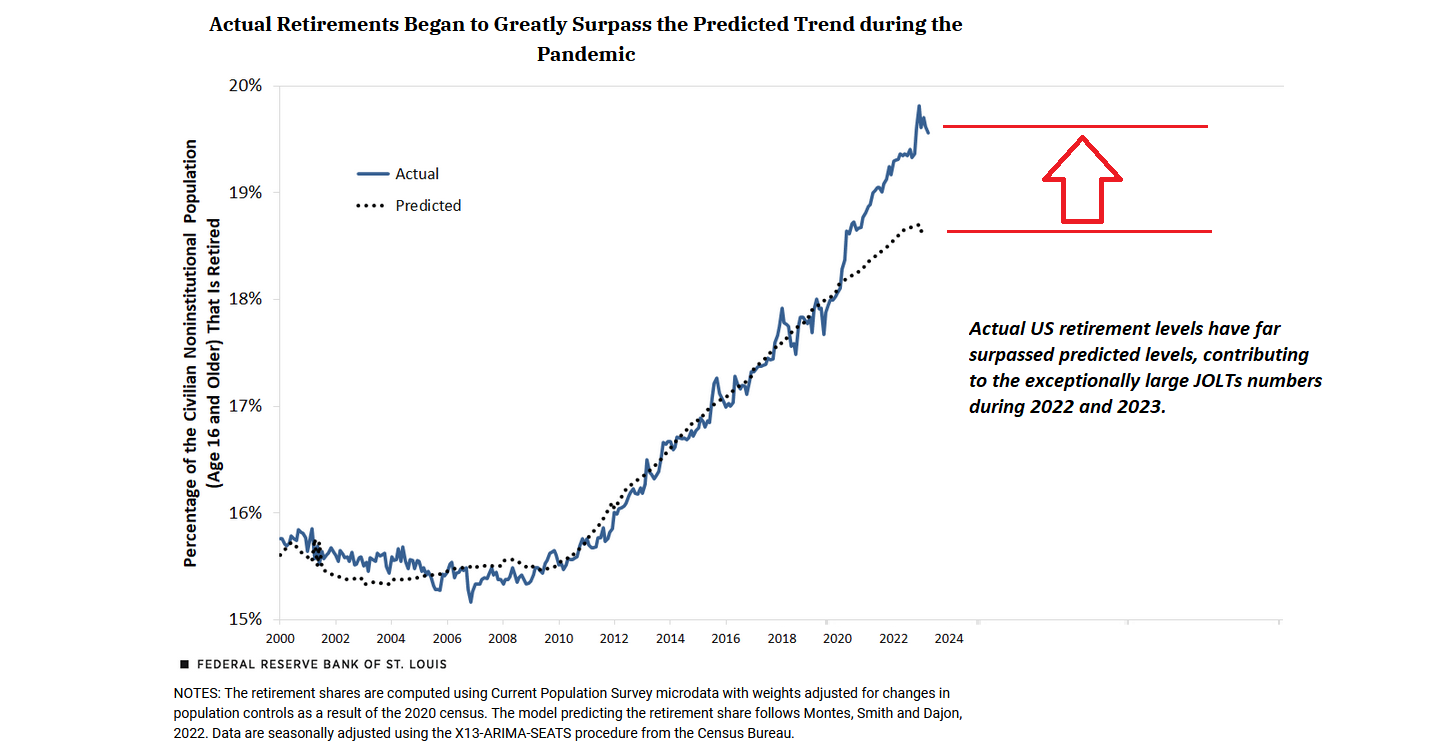
This year, the number of Americans “not in the labor force” eclipsed 100 million for the first time in history. Retirees increased by more than 5 million since January of 2020. Hello Boomer!
Consider this: “Native-born” employment levels in the US are falling today. Significantly. After peaking in July of 2023 at about 132.2 million folks, native-born employment is down. Native-born employees within the US labor force are down by more than 2 million in the past 10 months.
Which begs the question: If more native-born Americans are leaving the labor force than ever before, what is the source of the expanding US labor force? Where did the new workers come from?
Abroad.
The image below is a combo – on the top we have “native-born” employment. On the bottom, “foreign-born” employment numbers. The trends are clear and obvious:
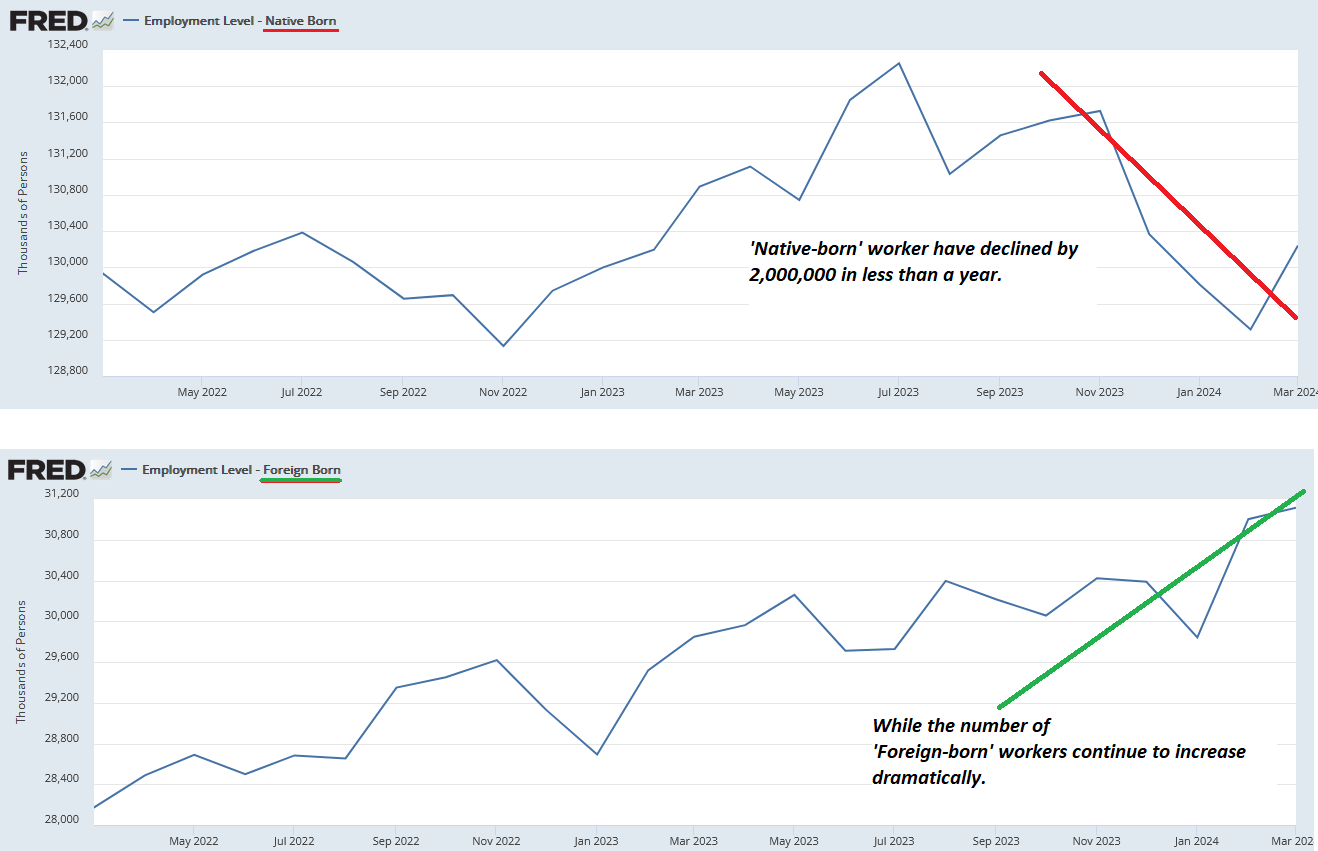
Clearly, our native-born American worker cohort is shrinking. Equally clearly, our foreign-born labor force is growing.
Employment numbers are up almost exclusively due to immigration. Without the immigrant surge over the past few years, our job market would be facing even more severe challenges today. The number of job openings would be much higher; the CLF would be much smaller; wages (and probably inflation) would be higher; and, GDP growth would likely be lower.
Immigration. Economically speaking, I’m a fan. 🙂
Now, you may be wondering, as I was, if the immigration, in this case, is ‘legal’ or ‘illegal’. Are these migrants legally able work in the US?
The answer, perhaps like the issue itself, is complex. The short answer is, generally, yes, many of these immigrants are legally entitled to work in the US. However, at the same time, data suggests the vast majority entered the country illegally.
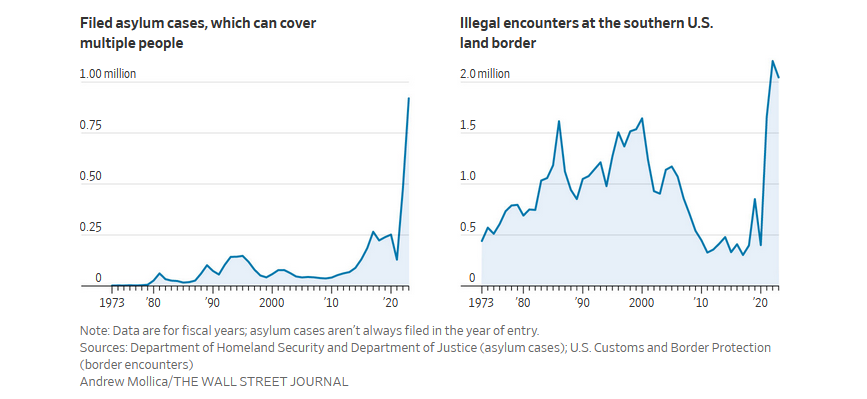
Once here, with boots on our American soil, many applied for asylum. An asylum seeker may only file an application for asylum if they are physically present in the US. Records indicate more than 920,000 asylum applications were filed during its 2023 fiscal year. Compare this to the number 10-years earlier: Only 76,000 applications. And as a single application can cover multiple members of a family, the figures significantly underestimate the actual numbers of people seeking asylum. It is likely double of triple the number of applications.
30 days after filing for asylum, the asylum seeker may apply for ‘Employment Authorization and Documentation’, or EAD, which permits the seeker to legally work in the US while their asylum claim is being processed. And processing will take a while: US courts are inundated with these cases. My research suggests many years – four, five, or a decade or more – may pass until asylum adjudication. At this moment, immigration courts have a backlog of 3.4 million cases, of which more than 1 million are asylum claims. According to the Department of Homeland Security, their case officers have current capacity to handle 50,000 asylum cases per year.
In the interim, armed with a work permit an asylum seeker is legally able to work.
Where are these folks coming from? Consider these comments from a recent Wall Street Journal article”
“About 7.7 million Venezuelans have left their country in the past decade, making them the world’s biggest refugee group ahead of Ukrainians and Syrians, according to R4V, a platform created by the United Nations and non-government organizations that tracks Venezuelan migration. Venezuelans struggle with inflation that tops 400% amid rampant corruption and political repression. The U.S. is an appealing option despite the journey’s hardship: Jobs are plentiful and pay well, allowing migrants to send money back to relatives in Venezuela.”
Indeed.
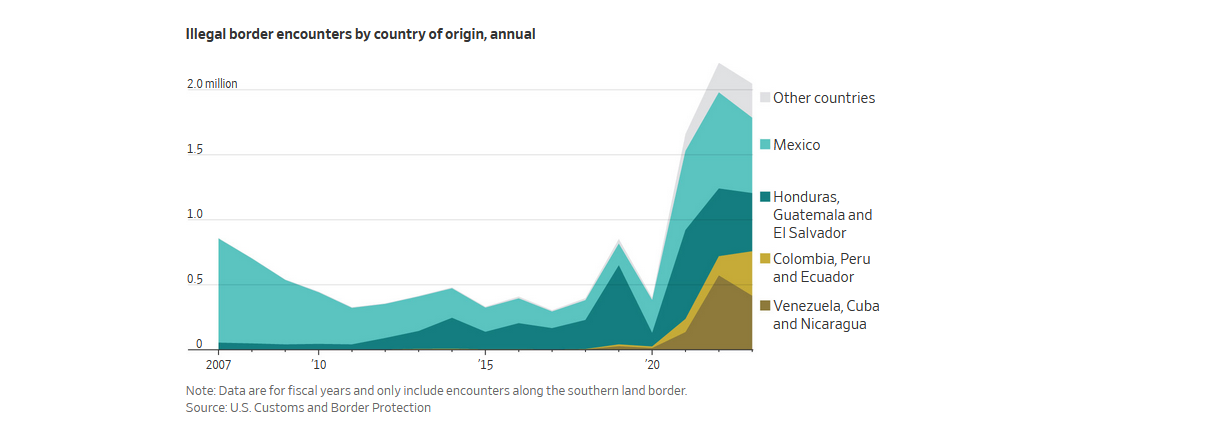
Economic collapse in Venezuela and Nicaragua are definitely fueling some portion of the asylum seekers.
I am not an expert on immigration law. I may have some the details above wrong. And I’m certain a person would find navigating the US immigration and asylum systems more difficult and complex than my words above suggest. But what does seem factual is this: Even though they entered the country illegally, many if not most of these people are now legally working in the US.
I believe this is the source of the sizable bump we’re seeing in the civilian labor force numbers:
Of course, all migrants do not have legal work permits. Another WSJ article suggests “… Some migrants have crossed the border illegally and evaded capture, relying on underground networks of friends and relatives to find work. Many others have asked for asylum upon entering the country, triggering a multiyear court process that eventually allows them to get work permits — which result in higher wages — while they wait. Still others have been granted seasonal work visas, but employers say there aren’t nearly enough of these visas to meet demand.”
As I’ve said numerous times before, I write an economic blog. Not political. Not social. People can and will continue this debate as the presidential election looms large in the near future. However, thru the economic lens only, our economy is a very clear economic beneficiary from this migration wave.
This fact is irrefutable. It happened. More interesting to me, at this point, is whether or not it will continue into 2024, 2025 and beyond.
Historically, a strong and growing US economy has had strong gravitational pull on workers across the southern border. In the past, however, most of that labor illegally crossed the border and did not have a legal right to work in the US. Today, a pathway to a legal work permit, and and asylum claim permitting the application to legally remain in the country, create a very different scenario. Will it continue? Or will US laws change, causing immigration and work in the US to become illegal once again?
Accelerating retirement is a serious economic headwind for the US. This is a relatively new, very dynamic, very long-term situation. Immigration in 2022 and 2023 helped fill in the employment gaps left by retirees. No, immigrants did not fill the same jobs vacated by retirees … but they did raise the overall level of employment within our system and labor force. It will be interesting to see how this evolves in years to come.
To the steakhouses?
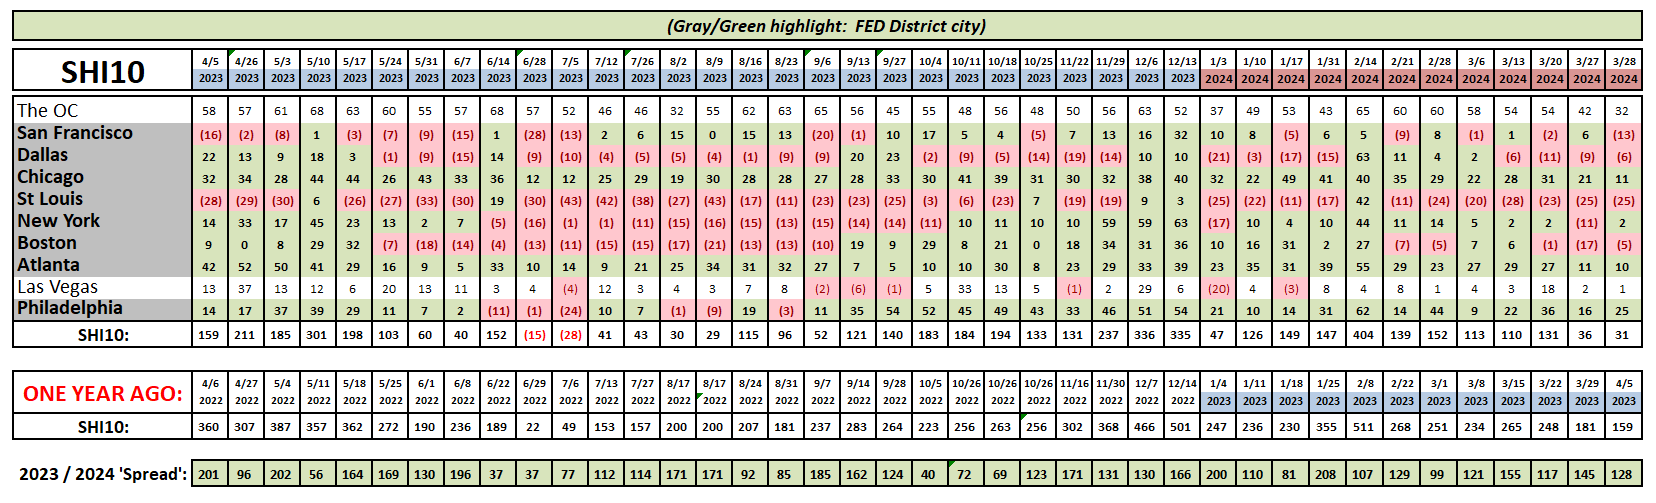
Not much has changed. This week’s SHI10 is very consistent with the last reading. The ‘Spread’ between 2023 and 2024 SHI10 readings is also consistent.
There was an interesting article in today’s Wall Street Journal about St Louis. The article was titled, “The Real Estate Nightmare Unfolding in Downtown St. Louis.”
We’ve been talking for years about weak expensive eatery reservation demand in St Louis. Apparently, the city’s ‘downtown’ area has been struggling for years. After the pandemic emptied out office buildings due to the ‘work from home’ movement, the city has spiraled down further. The article is worth a read — and is a bit of a cautionary tale. Here’s the link (right click, open in new tab):
https://www.wsj.com/real-estate/commercial/doom-loop-st-louis-44505465
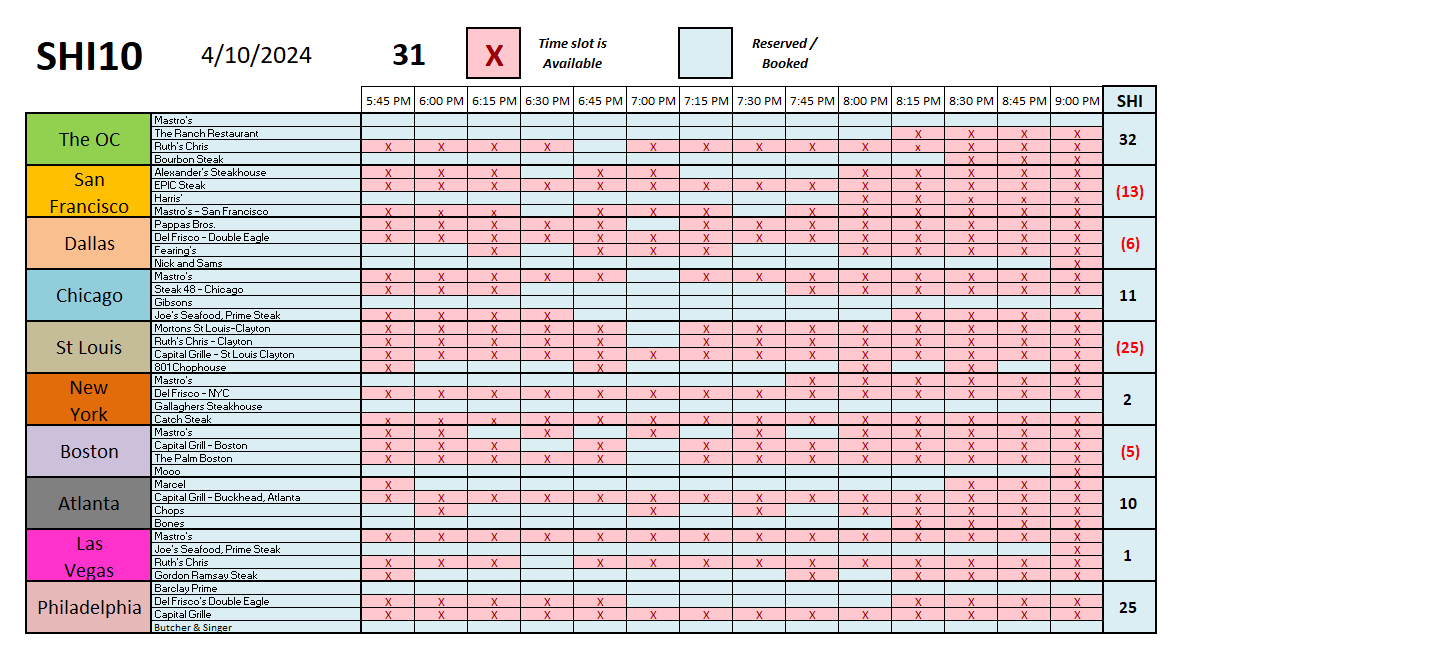
Here is the weekly SHI10 grid. Yes, at a negative (25), St Louis is once again the weakest of our 10 SHI markets.
I’ll close today with a few more Boomer comments.
Yes, Boomers are retiring and leaving the labor force at an increasing rate. They now comprise almost half of the 100 million folks “no longer in the labor force.” However, this is the wealthiest cohort of senior citizens in US history. Of the record and documented $156.2 trillion total American net worth I discussed in a recent blog, they hold almost half – $76.2 trillion according to Yardeni — belongs to Baby Boomer households.
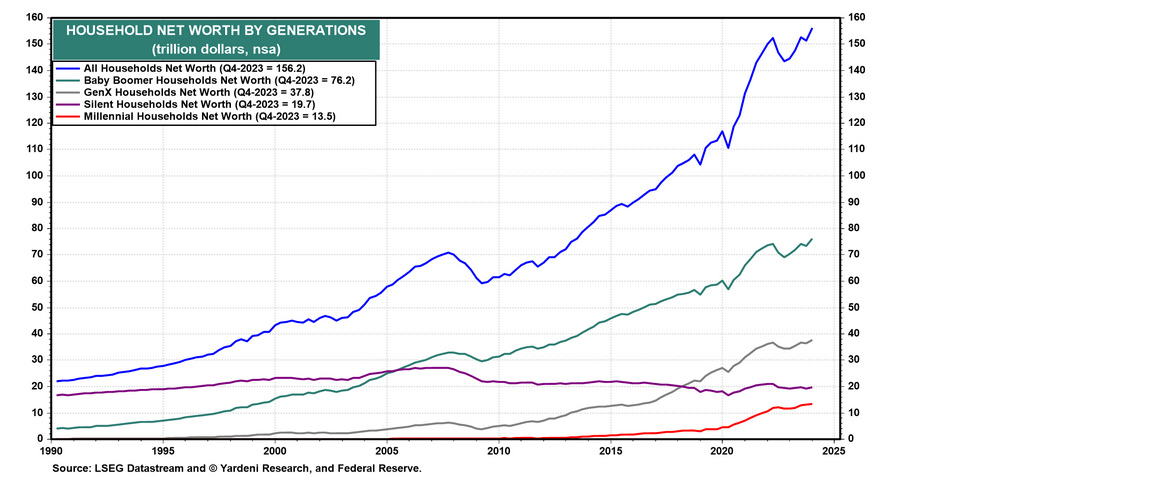
So, on one hand, Boomers are straining Social Security and Medicare budgets. But on the other, according to Yardeni, Boomers are spending their wealth — and will for years to come.
Spending on travel, airlines, hotels, food, and elective health care services all have been soaring to new or near record highs. Yardeni believes much of that is because seniors are traveling more, dining out more, and visiting their health care providers more. As a result, payroll employment in all these industries continues to rise to record highs. More jobs.
In our $28 trillion economy, if Boomers spend just 2 or 3% of their long-saved bounty – say another $2 trillion each year – consumer spending, and by extension US GDP growth, will continue to receive quite the tailwind. For years to come.
It’s all very complex, economically. Whether we’re talking about Boomers or immigrants, for every cloud, there appears to be a corresponding silver lining. Good? Bad? I’ll leave the judgement to you.
Me? I’ll continue to relax and ponder with a glass of my favorite Chateau Margaux and a medium-rare aged NY strip. After all, I’m a Boomer too. I need to do my part and spend, spend, spend on expensive eateries and expensive wines!
<:> Terry Liebman

