
SHI 3.27.24 – $27,511,234,577,616.74

SHI 3.20.24 – The Value of The Buck
March 20, 2024
SHI 4.10.24 – Jobs
April 10, 2024
The US Treasury has a website called ‘Debt to the Penny.’
That number in the blog title? That is the amount of US Treasury “debt held by the public” down to the penny, as of 3/21/24. Typed out, that’s twenty seven trillion, five hundred eleven billion, two hundred thirty four million, five hundred seventy seven thousand, six hundred sixteen dollars and 74 cents.
Did you think the number was larger? A related number is. The figure for “total public debt outstanding” is higher. This amount exceeds $34.5 trillion.
“
How much is too much?“
“How much is too much?“
What’s the difference between the two numbers? We’ll discuss that below.
But, for now, this question: How much is too much? Is there a tipping point when the Treasury would no longer be able to sell new US Treasury debt? A point in time when prospective buyers no longer feel US Treasury debt is a solid, risk-free investment?
These are all good questions. And, of course, we just don’t know. It is precisely that unknown that concerns me … and likely you as well. We’ve never been here before. Since the first debt auction in 1929, the US Treasury has always successfully sold debt. Each auction attracted adequate buyers. But what would happen if they did not? What would happen if a debt auction failed? Can a Treasury debt auction fail?
Welcome to this week’s Steak House Index update.
If you are new to my blog, or you need a refresher on the SHI10, or its objective and methodology, I suggest you open and read the original BLOG: https://www.steakhouseindex.com/move-over-big-mac-index-here-comes-the-steak-house-index/
Why You Should Care: The US economy and US dollar are the bedrock of the world’s economy.
But is the US economy expanding or contracting?
Expanding …. By the end 2023, in ‘current-dollar‘ terms, US annual economic output rose to an annualized rate of $27.94 trillion. After enduring the fastest FED rate hike in over 40 years, America’s current-dollar GDP still increased at an annualized rate of 4.8% during the fourth quarter of 2023. Even the ‘real’ GDP growth rate was strong … clocking in at the annual rate of 3.3% during Q4.
According to the IMF, the world’s annual GDP expanded to over $105 trillion in 2022. Further, IMF expects global GDP to reach almost $135 trillion by 2028 — an increase of more than 28% in just 5 years.
America’s GDP remains around 25% of all global GDP. Collectively, the US, the European Common Market, and China generate about 70% of the global economic output. These are the 3 big, global players. They bear close scrutiny.
The objective of this blog is singular.
It attempts to predict the direction of our GDP ahead of official economic releases. Historically, ‘personal consumption expenditures,’ or PCE, has been the largest component of US GDP growth — typically about 2/3 of all GDP growth. In fact, the majority of all GDP increases (or declines) usually results from (increases or decreases in) consumer spending. Consumer spending is clearly a critical financial metric. In all likelihood, the most important financial metric. The Steak House Index focuses right here … on the “consumer spending” metric. I intend the SHI10 is to be predictive, anticipating where the economy is going – not where it’s been.
Taking action: Keep up with this weekly BLOG update. Not only will we cover the SHI and SHI10, but we’ll explore “fun” items of economic importance. Hopefully you find the discussion fun, too.
If the SHI10 index moves appreciably -– either showing massive improvement or significant declines –- indicating growing economic strength or a potential recession, we’ll discuss possible actions at that time.
The Blog:
The US Treasury website “Debt to the Penny” is worth a look.
(right click, open in new tab)
https://fiscaldata.treasury.gov/datasets/debt-to-the-penny/debt-to-the-penny
There you will see an image looking something like this:
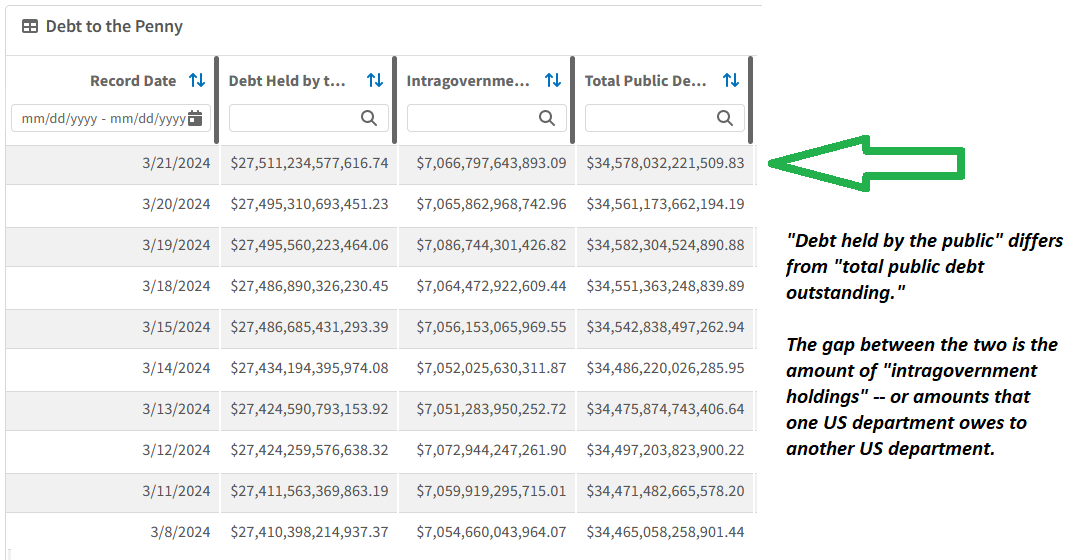
I added the green arrow to the right … and the commentary. Inasmuch as ‘intergovernmental holdings’ are essentially a bookkeeping metric, I feel the “debt held by the public” is the more meaningful number when discussing — or fretting about — the amount of outstanding US government debt.
And as of Monday, that number was about $27.5 trillion.
Three and a half years ago, I wrote the blog post below. Take a look. (Right click, ‘open in a new tab.’)
SHI 9.23.20: Scarier than a Halloween Haunted House
https://steakhouseindex.com/shi-9-23-20-scarier-than-a-halloween-haunted-house/
The blog post is worth a re-read.
Today, of course, we know the winners of the the Covid vaccine contest. In record speed, Pfizer and Moderna came to the rescue.
As is often the case, the CBO forecast in the blog was off the mark. In my experience, this is not unusual for CBO forecasts. The 10-year Treasury yield today is not 2.80% as they expected. As you know, today the 10-year yield is about 1.5% higher.
However, I do find the logic behind the CBO projection more interesting. Essentially, the CBO believes, and to some extent I agree, that the 10-year yield is likely to move higher, over time, as the debt load increases. In other words, an ever-increasing national debt does put pressure on rates — both from a ‘supply’ perspective and term-premium pressure. Uncertainty about the future tends to increase term premium, thereby putting upward pressure on rates.
In theory, there is some level of US debt when the Treasury would be unable to finance any additional Treasury bonds. In theory, this would occur when newly-issued US Treasury debt crowds out all other debt issuance. In other words, there is a level of debt where all new debt issued across the globe was Treasury debt alone.
Of course, this is nonsense and could never happen. Markets don’t work that way.
Further,
It is irrational to believe the US Treasury can sell new debt into perpetuity.
Far before that time, as the US debt load grew larger and larger, rating agencies and investors would have decided US Treasury debt was no longer ultra-safe. Slowly at first, but picking up steam, debt investors would back away from buying new Treasury debt. In this eventuality, to attract buyers, the Treasury would be forced to continuously increase the interest rate paid on Treasury debt … which would exacerbate the problem because the higher rate would accrue more interest even faster … further triggering additional rate increases to attract new buyers. Thus, far before a time when Treasury bond sales crowded out all other bond sales, T-bond interest rates would be so high, the debt itself rated so low by the credit agencies, as to render it uninvestable. In theory.
Which, again, is nonsense.
However, the nuance here is this: The gross amount of debt held by the public increases every time the US engages in deficit spending. The deficit must be financed … and that’s precisely what the Treasury does. It finances the deficit, auctioning off both new and maturing Treasury debt. But maturing Treasury debt is a refinance. More likely than not, the holder of that debt simply rolls it over into a new Treasury instrument. The challenge in this scenario is the new debt. New debt requires new capital. So really, in the margin, we’re talking about funding the deficit. About $1.6 trillion this year. Can the world rustle up another $1.6 trillion this year? Sure.
If new deficits are financed year after year, total debt owed increases. Once again, in theory, over time buyers may become more scarce; eventually, in theory, the US crosses the tipping point where the interest rate on new debt is driven higher simply due to supply.
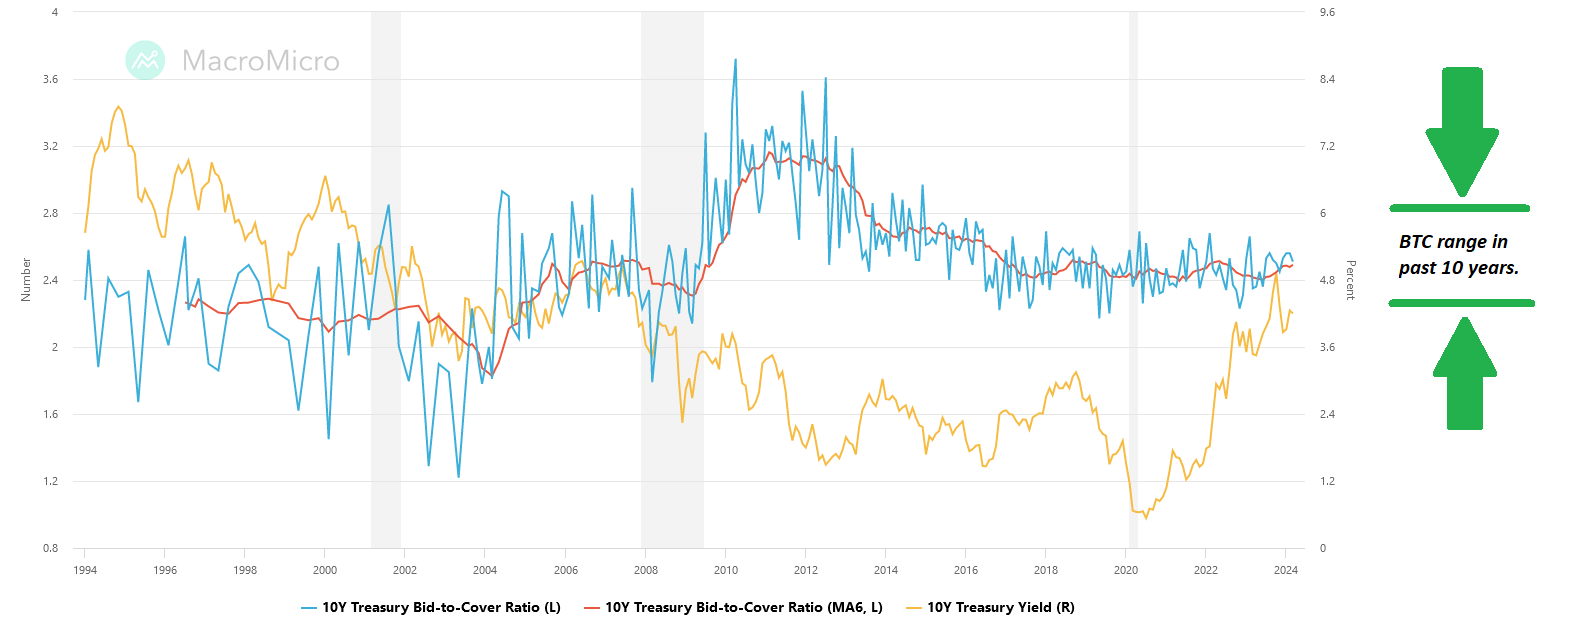
That proverbial tipping point we discuss above, if it ever actually does come to pass, will not happen at once. No, first there will be rumblings of difficult in the treasury bond markets. One or more weekly treasury auctions might, in theory, “fail” — meaning, the debt offered for sale may meet with insufficient buyers. In this scenario, the “bid-to-cover” ratio would be less than 1. Meaning, less than 100% of the bonds offered for sale by the Treasury had a bid.
Could this happen? In theory, it is possible, I guess, but as a matter of fact, the FED is likely the backstop to prevent this outcome. Presumably, if the BTC dropped below 1, the FED would step in and buy the remaining, unsold Treasury bonds.
Today, the BTC ratio is far above 1.
The FED is truly the buyer-of-last-resort for Treasury debt. Fortunately, for now, they are not needed in this capacity. The US debt financing system seems to be working just fine. The market mechanics aside, however, the questions remain. How much is too much? If the US debt owed to the public continues to rise, and surpasses this tipping point what would happen?
For these answers, let’s consult with a few experts.
Ken Rogoff and Carmen Reinhart literally wrote the book on this topic back in 2009, titled “This Time is Different: Eight Centuries of Financial Folly”.
As I said in my earlier blog, they summarized with this comment:
“Essentially, after studying 800 year of data from 66 countries, they concluded that up to a 90% “debt-to-GDP” ratio, a country feels no ill effects. Up to that 90% debt ratio, history proves a country’s GDP growth is not adversely impacted. But beyond that level, history has shown that long-term GDP growth can fall by 1% or more as debt levels continue to rise.”
The current US debt-owed-to-the-public is, already greater than 90%. In fact, it is right about 100% — and growing.
US GDP growth is actually quite robust these days. But Rogoff and Carmen at talking long-term — meaning over decades, I suspect, at the minimum. Not today.
6-years later, in 2015, a Rogoff co-worker at Harvard named Johathan Shaw wrote a piece called “Dealing with Debt.” In that article, he discussed “some of the tools that advanced economies have used in the past to lessen their obligations.”
Hmmm … that’s interesting. How does one “lessen their obligation?” Pay it back? Nope, not necessarily. Some of Shaws suggestions include, (1) raising taxes [this might help pay some back], (2) reduced government spending, (3) “privatize” government assets — essentially selling them to private companies. Anyone interested in buying Camp Pendleton?
Finally, (4) selecting a “heterodox approach to debt reversal.” What the heck is that, you ask? Default or erosion of debt thru higher levels of inflation. Or wealth taxes. But he feels the most “interesting” is “financial repression” which occurs when interest rates are consistently negative.
Here’s a link to the article if you wish to read the entire text.
More recently, in July of 2023, Rogoff and associates added more on this topic, in an NBER article titled, “LONG-RUN TRENDS IN LONG-MATURITY REAL RATES 1311 – 2022.” If you’re dying for the link, shoot me an email. 🙂
Here’s the ‘abstract’ summary from the paper:
“Taking advantage of key recent advances in long-run financial and economic data, this paper analyzes the statistical properties of global long-maturity real interest rates over the past seven centuries. In contrast to existing consensus, which has overwhelmingly concentrated on short samples for short-maturity rates, we find that long-maturity real interest rates across advanced economies are in fact trend stationary, with moderately rapid convergence speeds, and exhibit a persistent downward trend since the Renaissance.”
Yes, that Renaissance. The one in Europe many hundreds of years ago.
Could an ever-increasing national debt pile reverse the downward rate trend in place for hundreds of years? Unfortunately Dr. Rogoff doesn’t directly address this fundamental question. Here are a few of the more interesting points he does make, however:
“We are aware of the debate in the econometrics literature on the difficulties in distinguishing trend breaks from unit roots. However, the glaring downward trend in our 700-year real interest rate series is so consistent and clear it is hard to imagine not allowing for a trend, and in fact, and 30 even for the series where we detect a statistically significant trend break, the stationarity results still hold without allowing for one. Of course, further research is needed, though we are doubtful alternative approaches would radically change our novel finding that long-term real interest rates are stationary. We are also keenly aware that extrapolating our negative trend line another two centuries even at the pace of around two basis points per annum, would imply that the global trend real interest rate proceeds linearly, and ultimately reaches levels well below zero. A more likely possibility, perhaps, is that it will asymptote to a lower bound (positive or negative), though we do not see evidence of that yet and leave this issue to further study.”
Well below zero. Interesting.
His final comments:
“Finally, the recent literature has given a great deal of attention to demographics and productivity as drivers of today’s real interest rates.
Our research in no way rules this out, since it is possible there has been a modern structural break that has not yet lasted long enough to be statistically significant in the 700-year time series. Nevertheless, again making use of substantial recent advances in quantitative economic history, we can employ much-improved long-term demographic and real output data, which over most of our sample have been rising, not falling, yet the sovereign long-term real interest rate has trended down consistently. Specific alternative explanations for the very slow trend decline include decreasing default risk and increasing liquidity, both of which are likely to be important contributing variables and merit exploration in future research, though we do not presume an answer here. Hence, although we absolutely cannot conclude that the post-2008 epoch of seemingly very low real rates will eventually unwind back to a (declining) trend, we would argue that our data gives a valuable new perspective that should have important implications for understanding a broad range of modern macroeconomics and asset pricing issues.”
I’m ready for a glass of wine. 🙂
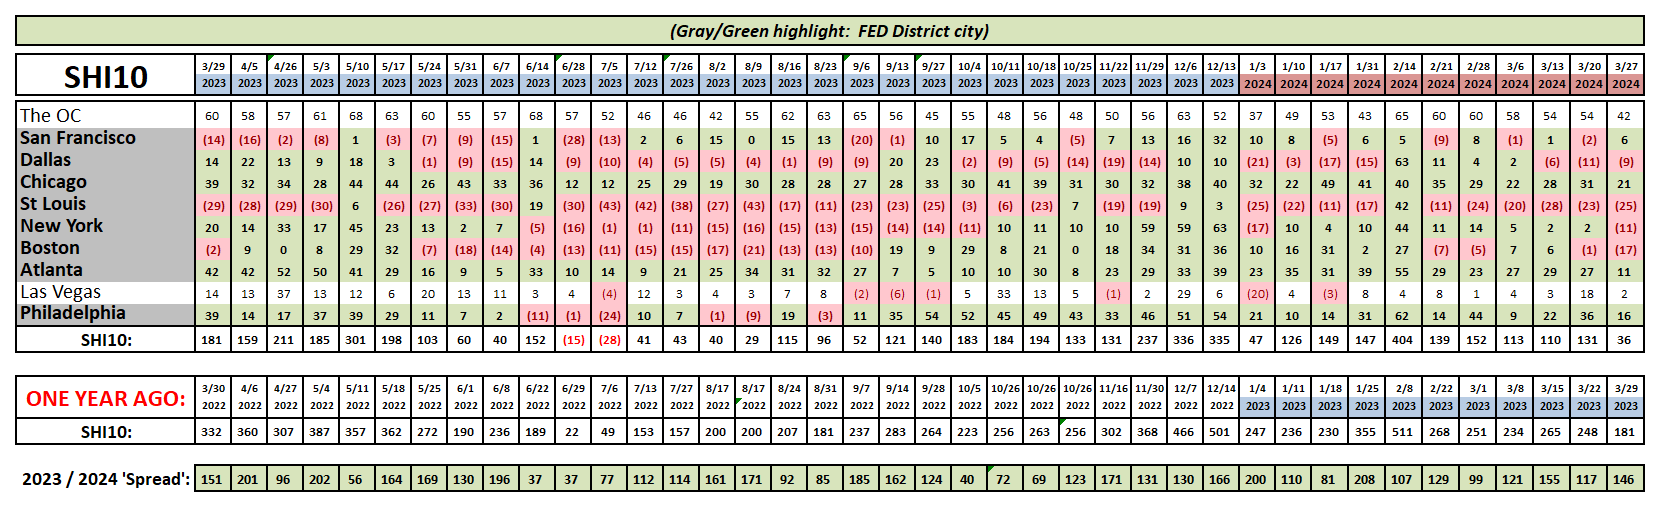
The SHI10 has fallen to 36 this week. That’s a lower read … but in context with last year, it remains consistent. Reservation demand is lower this week, but not appreciably, and this reading alone does not suggest any change in the economic picture.
Let me finish the Treasury debt conversation with a few final comments.
Over the years, I’ve had many discussions with some very smart and learned people on the topic of “how much is too much” US debt. Of course, no one knows. Many fear some inevitable future tipping point when the amount of public debt overwhelms the financial system and causes some sort of break or failure. Might this happen? No doubt, it is possible. Did you know that all European countries defaulted on their national debt following World War 1, with the sole exception of Finland? Countries do default. Many have over the years.
But there are equally likely alternative future scenarios that might play out.
Productivity growth could go vertical as AI fully integrates into our economy in the next decade. Conceivably, we might “grow our way out of it.” This happens when GDP growth is so exceptionally robust that tax collections eventually grow larger than annual spending. I know, I’m an optimist. Could happen.
Federal estate and inheritance taxes might also get us there, too, as baby boomers go the way of the Dodo. Remember: America in the aggregate has a $156 trillion net worth, and with a 40% (maximum) estate tax rate, Uncle Sam might collect quite a bit of that in taxes. The current US debt is less than 20% of that $156 trillion figure. Hmmm….
As to the long term direction of interest rates, I have to believe Rogoff and associates are right. I believe the long-term trend remains downward … current experience notwithstanding. If I have to pick between the CBO prediction and Rogoff’s, I’m going with Rogoff.
In fact, I already have. In that blog from 3.5 years ago, I commented:
“I contend the 10-year T — like the 10-year debt yields of other developed nations around the world — will remain near zero far into the foreseeable future.”
I will stick with this prediction. How soon? It may be a few years before we get there … but I agree with Rogoff that o% rates are, in the long run, inevitable.
Far more likely, I feel, than a US economic collapse due to a debt crisis.
US debt remains the most secure, most coveted, safest investment on the planet. In the history of finance, no other financial instrument has ever been considered safer. Now that we owe about 100% of our annual GDP in public debt, concerns about the future are reasonable. And while the future is unwritten, so long as US and global financial markets have the capacity to absorb new issuance, US Treasury debt will remain the safest investment.
Notice I used the word “new” in the paragraph above. Remember, this word is important. The $27.5 trillion of existing debt is already financed. Those holders are likely to roll-over their debt when it matures. So really, in the margin, we’re talking about funding the deficit. About $1.6 trillion this year. Yes, $1.6 trillion is a lot of money. But, in context, it’s not that large.
Sure, there’s the reason for concern. No doubt. Drink more wine and you’ll worry less. 🙂
: <> : Terry Liebman


