
SHI 9.23.20: Scarier than a Halloween Haunted House

SHI 9.16.20 – Let’s Talk About Debt
September 16, 2020
SHI 9.30.20: The Recession is Over!
September 30, 2020
The Congressional Budget Office (CBO) just updated a report they call “The 2020 Long-Term Budget Outlook” for the United States.
This report is downright scary. Really scary. In fact, as I know you to be a savvy economic expert yourself, I suspect the following graph will send shivers down your spine:
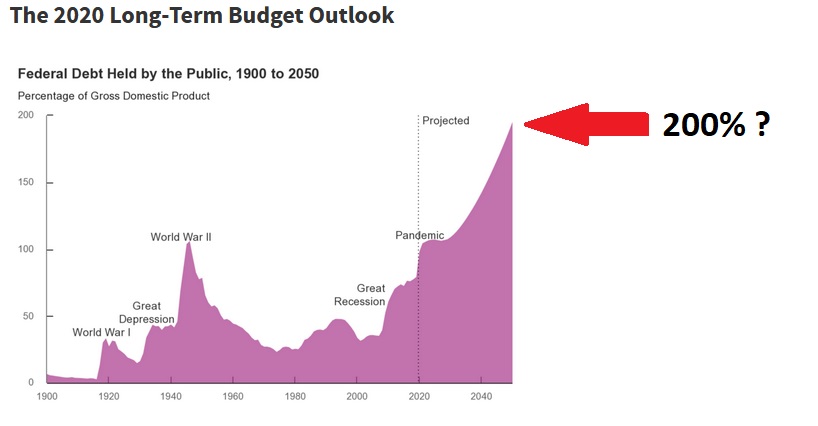
This is a 150 year chart showing the US debt-to-GDP ratio from 1900 thru today … and the CBO projection over the next 30 years. Until now, the highest ration ever was during the WW2 era. You can see that mountain top entitled “World War II” above. After WW2, the ratio declined, and remained fairly low — around 50% of GDP — for decades. Until the Great Recession of 2008. And then the Pandemic of 2020. When it exploded to about 90% of GDP.
“
The CBO is projecting a US debt-to-GDP ratio of almost 200% by 2050!”
“The CBO is projecting a US debt-to-GDP ratio of almost 200% by 2050!”
Holey cannoli! Is the future truly this dismal? Perhaps. But as with most economic forecasts, the proverbial devil is in the details. Read on, my expert friends, read on.
Welcome to this week’s Steak House Index update.
If you are new to my blog, or you need a refresher on the SHI10, or its objective and methodology, I suggest you open and read the original BLOG: https://www.steakhouseindex.com/move-over-big-mac-index-here-comes-the-steak-house-index/
Why You Should Care: The US economy and US dollar are the bedrock of the world’s economy.
But is the US economy expanding or contracting?
Before COVID-19, the world’s annual GDP was about $85 trillion. No longer. It will shrink thanks to ‘The Great Lockdown.’ I did not coin this phrase — the IMF did. The same folks who track global GDP. Until recently, annual US GDP exceeded $21.7 trillion. Again, no longer. But what has not changed is the fact that together, the U.S., the EU and China still generate about 70% of the global economic output.
The objective of this blog is singular.
It attempts to predict the direction of our GDP ahead of official economic releases. Historically, ‘personal consumption expenditures,’ or PCE, has been the largest component of US GDP growth — typically about 2/3 of all GDP growth. In fact, the majority of all GDP increases (or declines) usually results from (increases or decreases in) consumer spending. Consumer spending is clearly a critical financial metric. In all likelihood, the most important financial metric. The Steak House Index focuses right here … on the “consumer spending” metric. I intend the SHI10 is to be predictive, anticipating where the economy is going – not where it’s been.
Taking action: Keep up with this weekly BLOG update. Not only will we cover the SHI and SHI10, but we’ll explore related items of economic importance.
If the SHI10 index moves appreciably -– either showing massive improvement or significant declines –- indicating growing economic strength or a potential recession, we’ll discuss possible actions at that time.
The BLOG:
Sorry if my blog feels repetitive. Last week I talked about global debt levels…and this week I’m talking about massive public debt. It’s almost like I’m obsessed with this stuff!
Probably because I am. A little. Debt can be a wonderful thing … a great tool … if used correctly. But in the hands of the inexperienced or the foolish, it can be deadly. So when the CBO takes the time to update their long-term public debt forecast, I feel we should all at least listen to what they’re saying. They study this stuff closely, so their comments are worth hearing.
The message is bleak: Absent some significant changes, the the CBO is suggesting that US public debt of the future might get so large that it becomes an uncontrollable monster.
About 10 years ago, just after The Great Recession, two brilliant economists — Carmen Reinhart and Ken Rogoff — published a book called, “This Time is Different: Eight Centuries of Financial Folly. I read the book years ago and actually wrote a blog about it. It’s not an easy read, but worthwhile. And it’s only 512 pages! 🙂
Here’s the “pitch” from Amazon Books:
“Throughout history, rich and poor countries alike have been lending, borrowing, crashing―and recovering―their way through an extraordinary range of financial crises. Each time, the experts have chimed, “this time is different”―claiming that the old rules of valuation no longer apply and that the new situation bears little similarity to past disasters. With this breakthrough study, leading economists Carmen Reinhart and Kenneth Rogoff definitively prove them wrong. Covering sixty-six countries across five continents, This Time Is Different presents a comprehensive look at the varieties of financial crises, and guides us through eight astonishing centuries of government defaults, banking panics, and inflationary spikes―from medieval currency debasements to today’s subprime catastrophe. Carmen Reinhart and Kenneth Rogoff, leading economists whose work has been influential in the policy debate concerning the current financial crisis, provocatively argue that financial combustions are universal rites of passage for emerging and established market nations. The authors draw important lessons from history to show us how much―or how little―we have learned.”
Let me save you some time and summarize their findings:
Essentially, after studying 800 year of data from 66 countries, they concluded that up to a 90% “debt-to-GDP” ratio, a country feels no ill effects. Up to that 90% debt ratio, history proves a country’s GDP growth is not adversely impacted. But beyond that level, history has shown that long-term GDP growth can fall by 1% or more as debt levels continue to rise.
The CBO forecast aside, we’re already expecting well over a 100% debt-to-GDP ratio from the 2020 pandemic fiscal spending. Well over. And the CBO feels we’re heading to 195% ratio by 2050. Ouch. If Carmen and Ken are right, and the lessons of the past are a recipe for the future, then the United States is in deep yogurt. In fact, the authors conclude that highly indebted nations tend to “engineer default” through some combination of rapid inflation or outright repudiation of the debt. Think Argentina.
So, while it’s hard to argue with 800 years of history … let’s give it a try. Here’s a counter-argument.
In 4,000 years, interest rates have never been this low. Here’s a chart of the US 10-year treasury rate going back to about 1913:
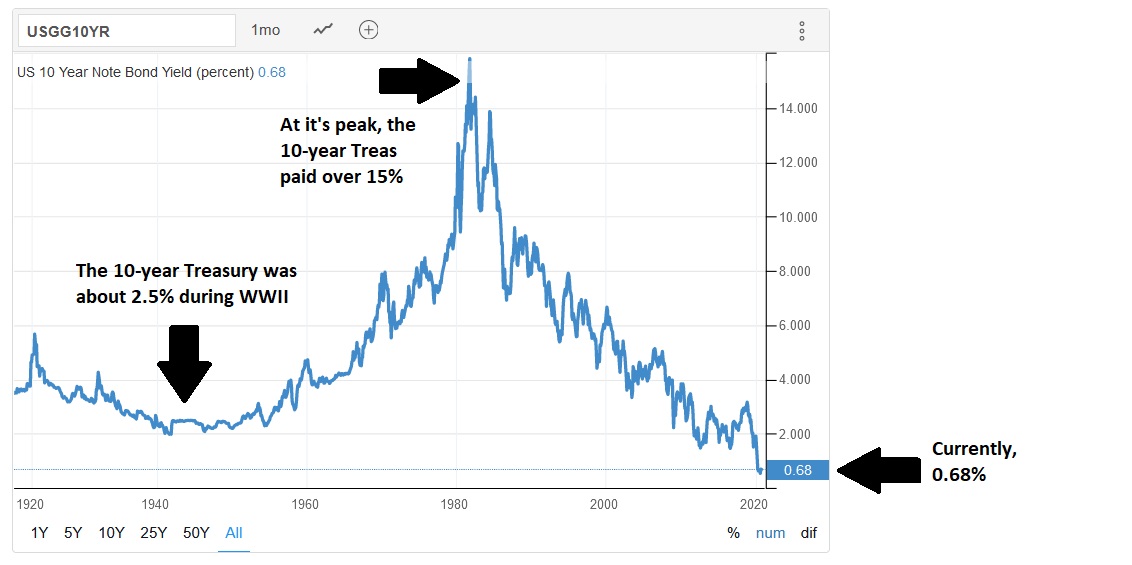
Which means the cost to service the debt has never been this low either. Paying interest at 0.68% is a whole lot easier than at over 15%. Don’t misunderstand me: Carrying a large debt load — especially one with a variable interest rate — can be dangerous. Especially if rates rise precipitously. Which is precisely what the CBO is forecasting. They believe rates will continue to rise … until the the 10-year Treasury reaches 4.8% in 2050. From their report:
“(The) CBO expects interest rates to rise as the economy recovers and then continues to expand, particularly in the latter half of the coming decade. The agency expects the interest rate on 10-year Treasury notes to average 1.3 percent over the 2020–2025 period and 2.8 percent over the 2026–2030 period. Beyond 2030, the interest rate on 10-year Treasury notes is projected to rise steadily, reaching 4.8 percent by 2050. In CBO’s extended baseline projections, net outlays for interest grow from 1.6 percent of GDP in 2020 to 2.2 percent in 2030 and then continue to rise over the next two decades to more than 8 percent by 2050.”
Ouch. This is the basis for their “195% debt ratio by 2050” forecast. Sure, I agree, if the 10-year T climbs up to 4.8%, the US debt carrying cost will get out of control. That would definitely be a problem. Will it? Will the US 10-year T rise significantly from its current low levels? That, my esteemed friends, is the million dollar question. Or trillion dollar question.
I contend it will not because it cannot. I contend the 10-year T — like the 10-year debt yields of other developed nations around the world — will remain near zero far into the foreseeable future. I’ve explained my logic in prior blogs … so I won’t repeat it here.
The bottom line: If the CBO forecast is correct, years before 2050, the US will likely follow the path Carmen and Ken illustrate in their book. Inflation or default. But if I’m right, and developed nations around the globe can carry much larger debt loads because structural interest rates will remain near zero for years to come, then the US will be fine. Time will tell.
In the interim, if you want a scare worthy of a Halloween haunted house, read the CBO report:
https://www.cbo.gov/publication/56598#_idTextAnchor003
Let me end today’s blog with a brief comment on Coronavirus vaccine progress. According to the London Financial Times, with data sourced at the WHO, in total there are more than 300 vaccine candidates in various stages of development. About 40 are “being tested on humans.” (I’m not sure what’s happening with the other 240.) And nine (9) have reached the final stage before a vaccine can be distributed and given to humans.
Here is a list of the 9:
-
- AstraZenica at Oxford University
- Pfizer in partnership with Germany’s BioNTech
- Moderna, here in the US
- China has four (4) including Sinovac Biotech, CanSino Biologies, and Sinopharm, which has 2 different vaccines in testing.
- Johnson & Johnson, a US multi-national
- Gamaleya Research Institute in Russia
All nine programs have already signed purchase agreements with governments around the world. And all 9 vaccines are being tested around the world. This is truly a global effort:
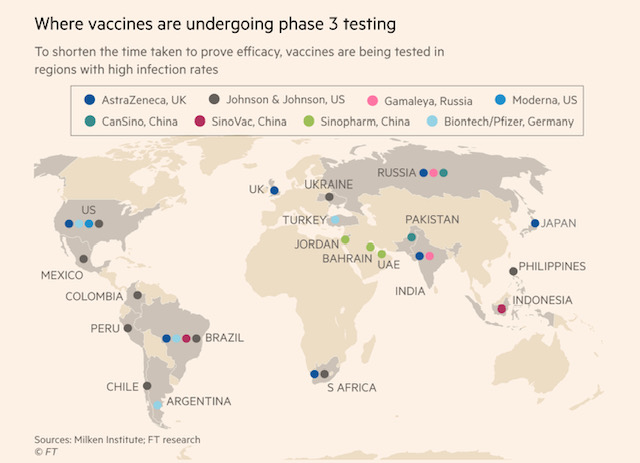
I believe we’ll have one or more vaccines in the not too distant future. Unlike the CBO report, this is good news for people across the globe.
- Terry Liebman


