
SHI 9.30.20: The Recession is Over!

SHI 9.23.20: Scarier than a Halloween Haunted House
September 23, 2020
SHI 10.7.2020: Who’s Buying the Toilet Paper?
October 7, 2020
Woo Hoo! I got your attention with that one, right? After last week’s blog, I thought I should inject a little “positivity” into today’s post, lest I be accused of being a complete and perpetual downer. But first, let me start with some not-so-good news: The ‘final estimate’ of Q2 GDP was posted by the Bureau of Economic Analysis (BEA) earlier today. The bottom line:
Current-dollar GDP decreased 32.8 percent, or $2.04 trillion, in the second quarter to a level of $19.52 trillion. In the first quarter, GDP decreased 3.4 percent, or $186.3 billion.
Ouch. That’s harsh. Pre-pandemic, annual US GDP exceeded $21.7 trillion. Today, the US annualized GDP figure is under $20 trillion. Double ouch. But here’s the good news: The recession ends today. Today is the last day of the third quarter.
“
Q3 will be a blow-out quarter … the first of many.”
“Q3 will be a blow-out quarter … the first of many.”
I expect Q3 GDP numbers — when reported — to be quite impressive. And I expect continued economic improvement from there. Why? Let me explain.
Welcome to this week’s Steak House Index update.
If you are new to my blog, or you need a refresher on the SHI10, or its objective and methodology, I suggest you open and read the original BLOG: https://www.steakhouseindex.com/move-over-big-mac-index-here-comes-the-steak-house-index/
Why You Should Care: The US economy and US dollar are the bedrock of the world’s economy.
But is the US economy expanding or contracting?
Before COVID-19, the world’s annual GDP was about $85 trillion. No longer. It shrank. Until recently, annual US GDP exceeded $21.7 trillion. Again, no longer. According the the Q2 final numbers, annual US GDP is down to $19.5 trillion. We can thank the Great Lockdown for this one. But what has not changed is the fact that together, the U.S., the EU and China still generate about 70% of the global economic output.
The objective of this blog is singular.
It attempts to predict the direction of our GDP ahead of official economic releases. Historically, ‘personal consumption expenditures,’ or PCE, has been the largest component of US GDP growth — typically about 2/3 of all GDP growth. In fact, the majority of all GDP increases (or declines) usually results from (increases or decreases in) consumer spending. Consumer spending is clearly a critical financial metric. In all likelihood, the most important financial metric. The Steak House Index focuses right here … on the “consumer spending” metric. I intend the SHI10 is to be predictive, anticipating where the economy is going – not where it’s been.
Taking action: Keep up with this weekly BLOG update. Not only will we cover the SHI and SHI10, but we’ll explore related items of economic importance.
If the SHI10 index moves appreciably -– either showing massive improvement or significant declines –- indicating growing economic strength or a potential recession, we’ll discuss possible actions at that time.
The BLOG:
Let’s start with the final GDP reading for Q2, 2020. Here’s a graphic from today’s BEA report:
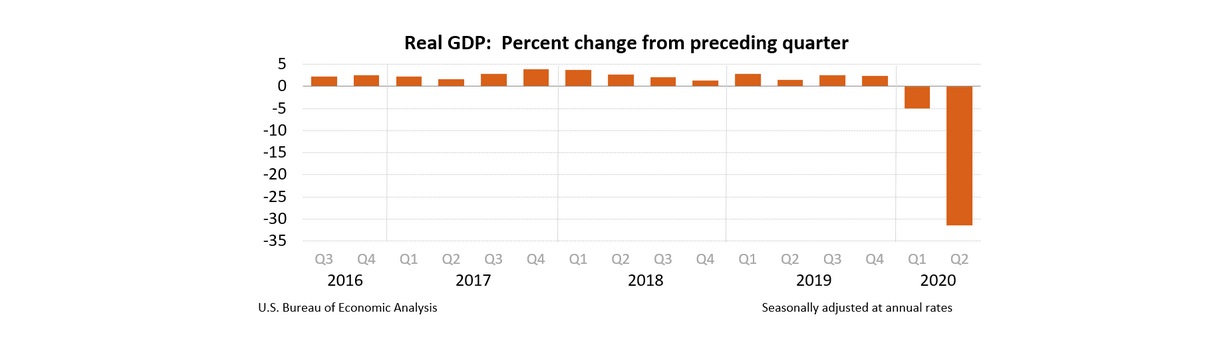
Economically speaking, that’s a depressing chart. 2020 has not been kind to the US GDP. In fact, this is the single largest quarterly decline since the St. Louis FED began tracking GDP records back in 1948.
Conversely, I think Q3 will be the single largest increase in history. The Atlanta FED agrees. According to their forecast (https://www.frbatlanta.org/cqer/research/gdpnow) Q3 GDP growth will be huge: The GDPNow model estimate for real GDP growth (seasonally adjusted annual rate) in the third quarter of 2020 is 32.0 percent on September 25. THAT-IS-STAGGERING.
I find it interesting that the longest-ever economic expansion will be followed by the shortest-ever recession. Long-time readers will recall that the National Bureau of Economic Research (NBER) is the official government agency that tracks the beginning and end of recessions, all the way back to 1857. Until now, the shortest recession — measured in months — was back in January of 1980. 6 months. The second shortest, coming in at 7 months, was back in 1919. Interesting, right? Do you remember what else happened in 1919? Right. The Spanish Flu pandemic was coming to a close … it officially ended in April of 1920. And do you remember what happened after that? Yep! The Roaring ’20s!
Of course, the 1920’s did end with a massive financial crash and decade long depression. So we’ll hope that doesn’t happen again. 🙂
I’ve described the catalyst for this quick recovery in my past few blogs. As I’ve said before, current hyper-low interest rates are a big contributor. We don’t have to look much beyond the latest headlines in the housing industry:
-
- “Pending home sales rose 8.8% in August, reaching a record high pace, according the the National Association of Realtors survey which dates to 2001.”
- “(Home) Sales were 24.2 percent higher than August 2019.
- “US New-home sales surge to fastest pace since 2006 as housing market shines thru pandemic.”
- “Sales of new US homes accelerated by 4.8% in August, to an annual rate of 1 million units, the Census Bureau reported Thursday, the highest since 2006 and marked four consecutive months of increasing sales.”
New homes are flying off the shelf. Graphically, here’s what the new home sales numbers look like:
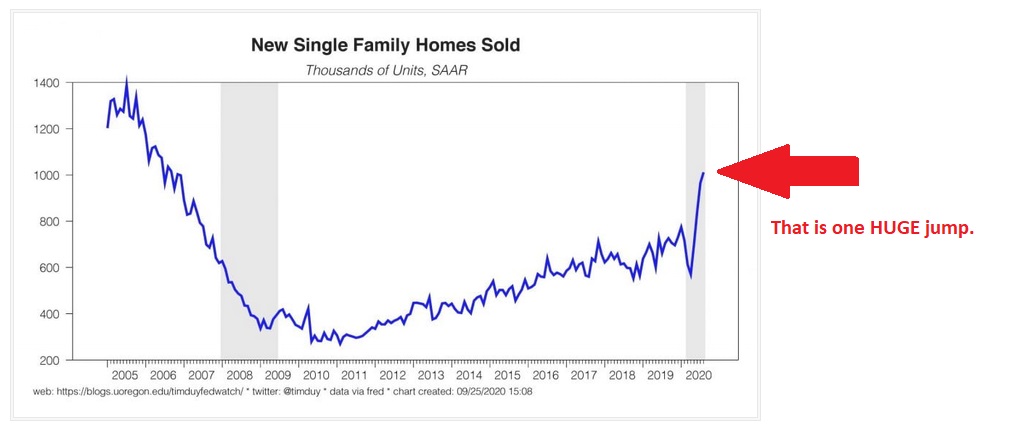
Of course, housing is not our entire economy. But other indicators are all pointing up too:
- Manufacturer’s new orders — way up.
- Industrial production — way up.
- Non-farm payrolls — up significantly and the unemployment rate is meaningfully lower at 8.4%.
The Great Lockdown stopped the economy in its tracks. About 6 months have now passed. I believe the Q3 numbers will be quite positive and in early 2021 the NBER will report that the recession of 2020 lasted for 3 months. Yes, 3 months.
Of course, our troubles are not all behind us. We all know we still face many challenges. But I don’t believe GDP growth remains one of those.
- Terry Liebman


