
SHI 3.20.24 – The Value of The Buck

SHI 3.13.24 – The Wind Beneath our Wings
March 13, 2024
SHI 3.27.24 – $27,511,234,577,616.74
March 27, 2024
A $1 million house used to be rare.
A few decades ago, a home sale-price over $1 million was a news event. No longer. Today, in many US housing markets, finding a home at a price below $1 million is a news event.
“
The ‘net worth’ of American households
now exceeds $156 trillion.“
“The ‘net worth’ of American households
now exceeds $156 trillion.“
Yes. That is ‘trillion’ with a capital T.
I suspect this number, by itself without context, may be hard for you to conceptualize. Below, I’ll take a stab at creating a clearer picture, one I hope makes the data more meaningful for you.
Welcome to this week’s Steak House Index update.
If you are new to my blog, or you need a refresher on the SHI10, or its objective and methodology, I suggest you open and read the original BLOG: https://www.steakhouseindex.com/move-over-big-mac-index-here-comes-the-steak-house-index/
Why You Should Care: The US economy and US dollar are the bedrock of the world’s economy.
But is the US economy expanding or contracting?
Expanding …. By the end 2023, in ‘current-dollar‘ terms, US annual economic output rose to an annualized rate of $27.94 trillion. After enduring the fastest FED rate hike in over 40 years, America’s current-dollar GDP still increased at an annualized rate of 4.8% during the fourth quarter of 2023. Even the ‘real’ GDP growth rate was strong … clocking in at the annual rate of 3.3% during Q4.
According to the IMF, the world’s annual GDP expanded to over $105 trillion in 2022. Further, IMF expects global GDP to reach almost $135 trillion by 2028 — an increase of more than 28% in just 5 years.
America’s GDP remains around 25% of all global GDP. Collectively, the US, the European Common Market, and China generate about 70% of the global economic output. These are the 3 big, global players. They bear close scrutiny.
The objective of this blog is singular.
It attempts to predict the direction of our GDP ahead of official economic releases. Historically, ‘personal consumption expenditures,’ or PCE, has been the largest component of US GDP growth — typically about 2/3 of all GDP growth. In fact, the majority of all GDP increases (or declines) usually results from (increases or decreases in) consumer spending. Consumer spending is clearly a critical financial metric. In all likelihood, the most important financial metric. The Steak House Index focuses right here … on the “consumer spending” metric. I intend the SHI10 is to be predictive, anticipating where the economy is going – not where it’s been.
Taking action: Keep up with this weekly BLOG update. Not only will we cover the SHI and SHI10, but we’ll explore “fun” items of economic importance. Hopefully you find the discussion fun, too.
If the SHI10 index moves appreciably -– either showing massive improvement or significant declines –- indicating growing economic strength or a potential recession, we’ll discuss possible actions at that time.
The Blog:
Take another look at the house image at the top of page.
According to the NY Times, the moderate home featured above is located in Santa Barbara. It was built in 1979, has 4-bedrooms, 3-bathrooms and a 0.3 acre lot. Today’s value for this home? $3.75 million.
“Inflation” has a different meaning to different people. Chairman Powell over at the FED uses a more institutional definition, often talking about the CPI or the PCE when discussing inflation levels. Those definitions and discussions, however, do not address the ‘inflation,’ or value increase, all Americans (collectively) have experienced in both assets and net worth. The FED is working hard to “bring the annual consumer price inflation level back to 2%.” Asset value inflation, on the other hand, is not within the FED‘s purview. Getting consumer price inflation “under control” is one of the FEDs two primary mandates. Keeping a lid on home and other asset values, however, is not.
Yet, ironically, these two, very different metrics — the consumer price index and the ‘home price index’ — actually meet up and overlap in a very interesting way. I’ll get to that below.
My dad bought his first home in 1959. It cost $15,000. His down-payment? Nothing. Zero. As a veteran, he qualified for ‘VA financing’ which required no down-payment and a very reasonable 5.75% interest rate. Rest assured, that house is worth a lot more than $15,000 today. Probably over $1 million, although frankly I really don’t know. But I do know it looked a lot like that Santa Barbara house shown above. Is that house “worth” $3.75 million today?
I guess. Things are worth what people will pay for them. Giving a nod to the nomenclature in the GDP report, this “value” is nominal — meaning it is unadjusted for inflation. Someone buying this house for $3.75 million dollars will be using “current dollars,” not inflation adjusted dollars.
The FED assiduously tracks the net worth of Americans, only in the aggregate, as it moves calendar quarter to calendar quarter. In their most recent report, hyperlink provided below, they share that “the net worth of households …” rose to $156.2 trillion during Q4 of 2023. During the 4th quarter, the value of corporate equities held by Americans increased by $4.7 trillion. In one quarter. Real estate values declined during the quarter, attributable, I’m certain, to declines in commercial real estate.
https://www.federalreserve.gov/releases/z1/20240307/z1.pdf
The FED has published the Z.1 report for decades. I thought it would be interesting to compare the historical values for America’s “household net worth” against the “consumer price index” for each calendar year beginning in 2001. I wanted know if the value of the CPI has kept up with increases in asset values; and in this case, I’m using household net worth as a proxy for asset values.
Have “asset values” and the consumer price index moved identically? Or has one metric “inflated” far beyond the other? Let’s take a look.
I set the CPI-U value for 2001 at “1” — and did the same for household net worth in that year. The chart below shows how these two metrics evolved between 2001, when the comparison begins, thru the end of 2023. Take a look:
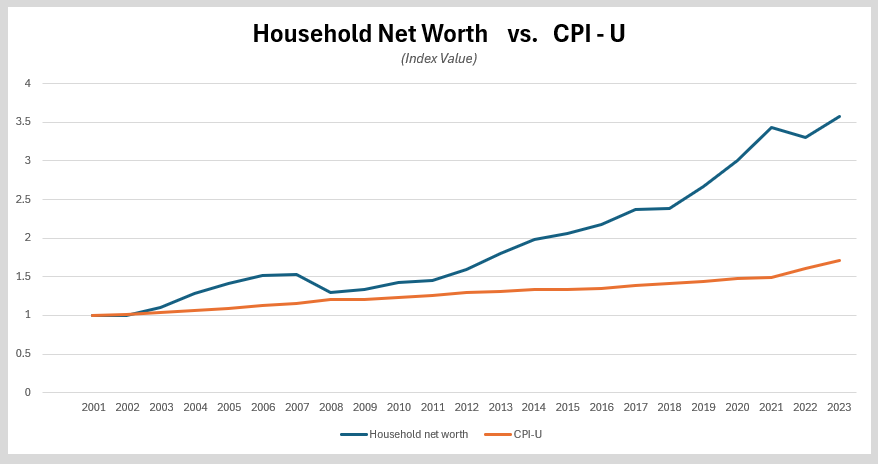
It’s easy to see: Household net worth “inflation” has far surpassed increases in the CPI. In fact, America’s net worth has increased at double the rate of the CPI. Asset inflation, it appears, has been 2X that of consumer prices.
I will repeat that I’m using household net worth as a proxy for asset values. I feel this is an appropriate use, as the net worth figure is calculated by subtracting America’s growing debt load from asset value increases. Asset values, without adjustment for debt, are actually much higher. If you’re interested, open the Z.1 report and scroll down to page 140, a page titled “B.101 Balance Sheet of Households and Nonprofit Organizations.” There you will see total American asset values are closer to $177 trillion.
Isn’t the increasing cost of housing captured in the CPI? Yes, it is. In fact, about 40% of the CPI is impacted by changes in America’s housing expense. But not the change in home values. No, the CPI includes a metric called “owner’s equivalent rent.” This is a calculation derived from home rental data tracked by the US Bureau of Labor Statistics. Home ownership data is not tracked in the CPI. Ownership is considered an “investment” whereas rent is considered “consumptive.” Therein lies the difference. According to the official calculation, rent is ‘consumption.’ ‘Ownership’ is an investment. There you go.
Let me summarize with these comments. This century, asset values have increased at a rate more than double that of consumer prices. Yes, consumer prices have consistently increased. But at the same time, asset values have increased much more. Why is this important?
Well, our economy is consumption based. About 70% of all economic growth is consumer consumption. And when asset values increase to the lofty levels we’re seeing today — and at a rate more than double CPI increases — the “wealth effect” provides a solid, consistent tail-wind for the economy and future GDP growth. And, of course, for our expensive eateries.
To the steakhouses!
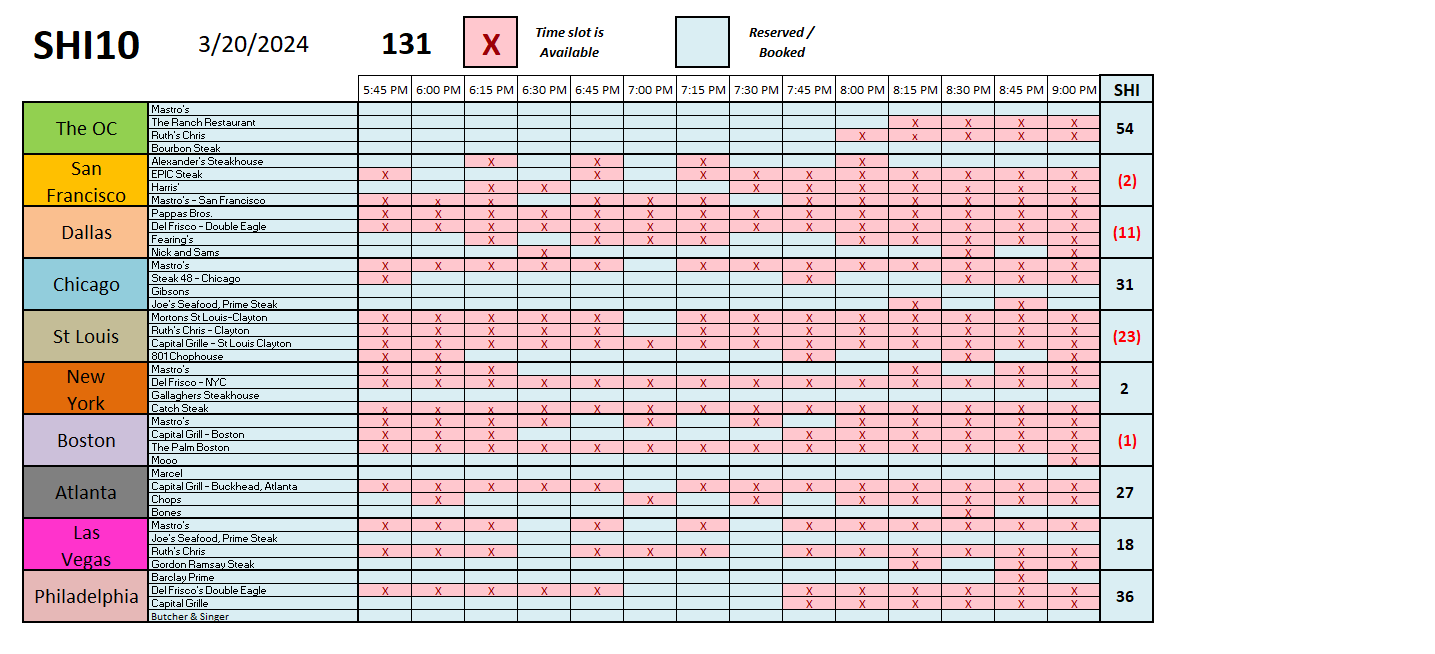
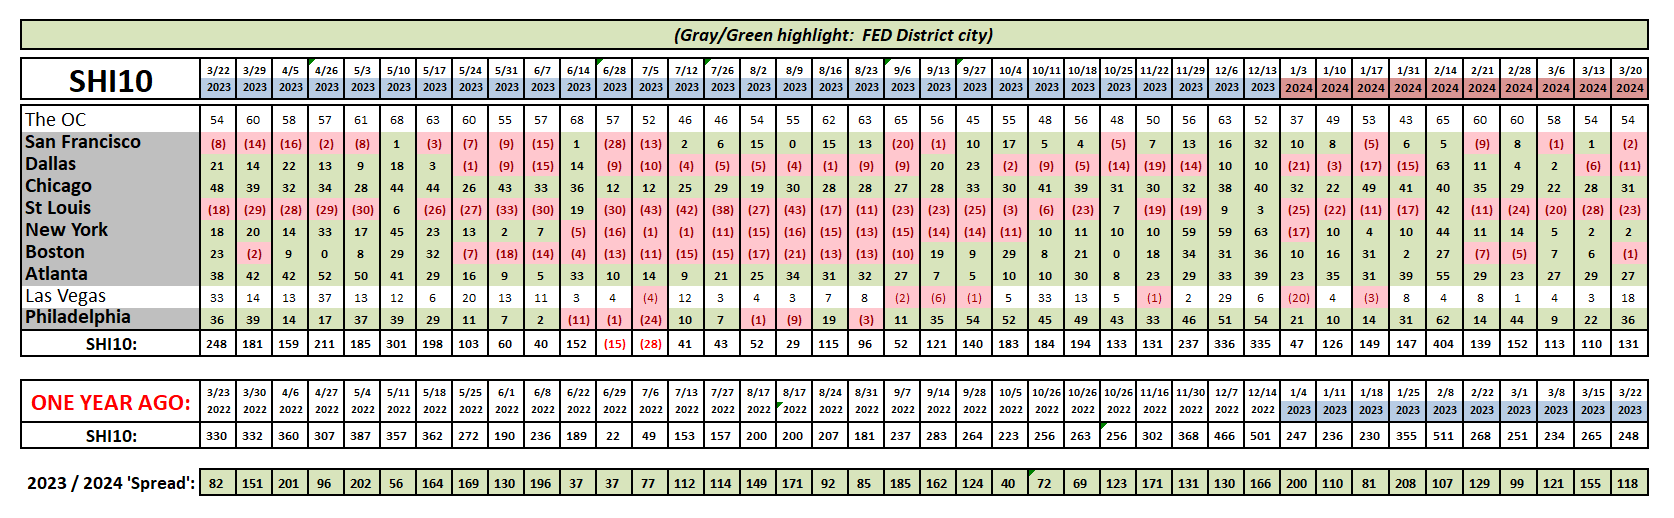
Frankly, there’s not much new to report on this front. The SHI10 remains consistent … reservation demand is robust and American’s are buying expensive steaks and bottles of wine. Here’s the longer term chart:
The FED completed their 2-day meeting earlier today. As widely expected, interest rates remain unchanged. I do expect the FED will lower short-term rates this year — my opinion is they will make a 25 basis point move down in their meeting at the end of July — as the CPI continues to moderate toward their 2% target.
<> Terry Liebman


