
SHI 3.13.24 – The Wind Beneath our Wings

SHI 3.6.24 – China Redux
March 7, 2024
SHI 3.20.24 – The Value of The Buck
March 20, 2024
The US economy continues to soar.
About a week ago, the Atlanta FED forecasted Q1 2024 GDP growth would be 2.5%. The NY FED ‘nowcast’ is predicting 2.14%. Remember … both readings are ‘real’ — meaning nominal US GDP growth could exceed 5% in Q1. If achieved, once again these numbers are soaring.
“
What is lifting the US economy?“
“What is lifting the US economy?“
One answer, in my humble opinion, is the US labor market. Consider these facts:
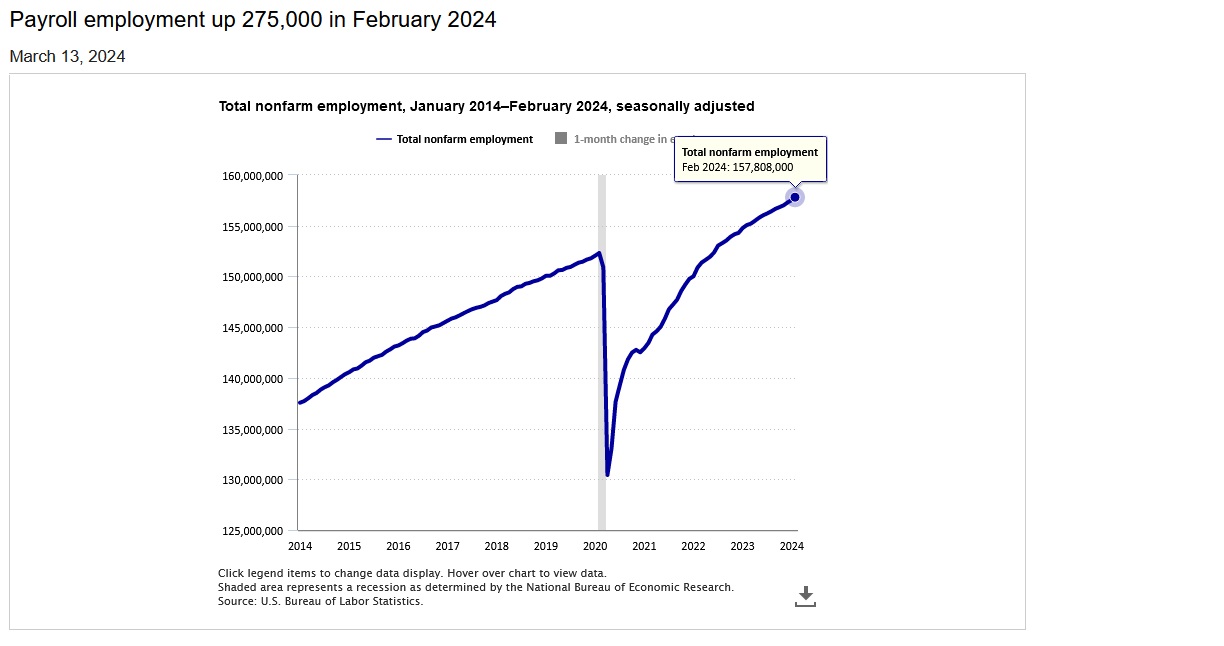
<> Pre-pandemic, in January of 2020, US non-farm employment was just over 152 million strong.
<> Last month, in February of 2024, the Bureau of Labor Statistics reported that number increased to
over 157.8 million folks — an increase of almost 6 million people.
<> Total private “average hourly earning” were $33.15 for an “average weekly” hours number of 34.5
… meaning every additional employed person, on the average, earns a bit over $1,144 per week, and just
about $59,470 for the year.
If we do the math … and multiply $59,470 per person by the 5.8 million newly employed … we see America’s workers are earning $345 billion more per year than they were when the pandemic began.
Remember, that’s just the increase in earnings since 2020. America’s GDP is soaring because earned income is soaring.
Welcome to this week’s Steak House Index update.
If you are new to my blog, or you need a refresher on the SHI10, or its objective and methodology, I suggest you open and read the original BLOG: https://www.steakhouseindex.com/move-over-big-mac-index-here-comes-the-steak-house-index/
Why You Should Care: The US economy and US dollar are the bedrock of the world’s economy.
But is the US economy expanding or contracting?
Expanding …. By the end 2023, in ‘current-dollar‘ terms, US annual economic output rose to an annualized rate of $27.94 trillion. After enduring the fastest FED rate hike in over 40 years, America’s current-dollar GDP still increased at an annualized rate of 4.8% during the fourth quarter of 2023. Even the ‘real’ GDP growth rate was strong … clocking in at the annual rate of 3.3% during Q4.
According to the IMF, the world’s annual GDP expanded to over $105 trillion in 2022. Further, IMF expects global GDP to reach almost $135 trillion by 2028 — an increase of more than 28% in just 5 years.
America’s GDP remains around 25% of all global GDP. Collectively, the US, the European Common Market, and China generate about 70% of the global economic output. These are the 3 big, global players. They bear close scrutiny.
The objective of this blog is singular.
It attempts to predict the direction of our GDP ahead of official economic releases. Historically, ‘personal consumption expenditures,’ or PCE, has been the largest component of US GDP growth — typically about 2/3 of all GDP growth. In fact, the majority of all GDP increases (or declines) usually results from (increases or decreases in) consumer spending. Consumer spending is clearly a critical financial metric. In all likelihood, the most important financial metric. The Steak House Index focuses right here … on the “consumer spending” metric. I intend the SHI10 is to be predictive, anticipating where the economy is going – not where it’s been.
Taking action: Keep up with this weekly BLOG update. Not only will we cover the SHI and SHI10, but we’ll explore “fun” items of economic importance. Hopefully you find the discussion fun, too.
If the SHI10 index moves appreciably -– either showing massive improvement or significant declines –- indicating growing economic strength or a potential recession, we’ll discuss possible actions at that time.
The Blog:
Individual earnings drive consumer spending. Consumer spending drives the US economy.
Sure, it’s not exactly that simple. But these are high-level, conceptual ‘truths’ your can count on. The simple fact is that employment income gains like these propel our economy higher. Remember: That $345 billion of additional earnings is either spent or saved. Right now, only about 4% is saved. So 96% is spent — on “stuff” or taxes. Income taxes fund a portion of US government spending (yes, we still have a massive annual deficit) and the rest is spent on goods or services.
Both consumer spending and government spending propel corporate earnings, which are currently over $3 trillion on an annualized basis, based on numbers released on 12/21/23.
You may have heard the unemployment rate ticked up last month. It did. Up to 3.9% … from 3.7% the prior month … and 3.6% back in February of 2023. Yes, an increasing unemployment rate is concerning. It bears watching. But, in this case, the unemployment rate is not increasing because fewer people are employed. No, the unemployment rate increased because between February of 2023 and and February of 2024, the labor force increased by almost 1.2 million people. During this same 1-year period, employed folks increased by 667 thousand.
People are employed at record numbers. Consumer spending — upon which 70% of our economy is based — will lift as a result. Employment compensation is the wind beneath the wings or our economy.
To the steakhouses?
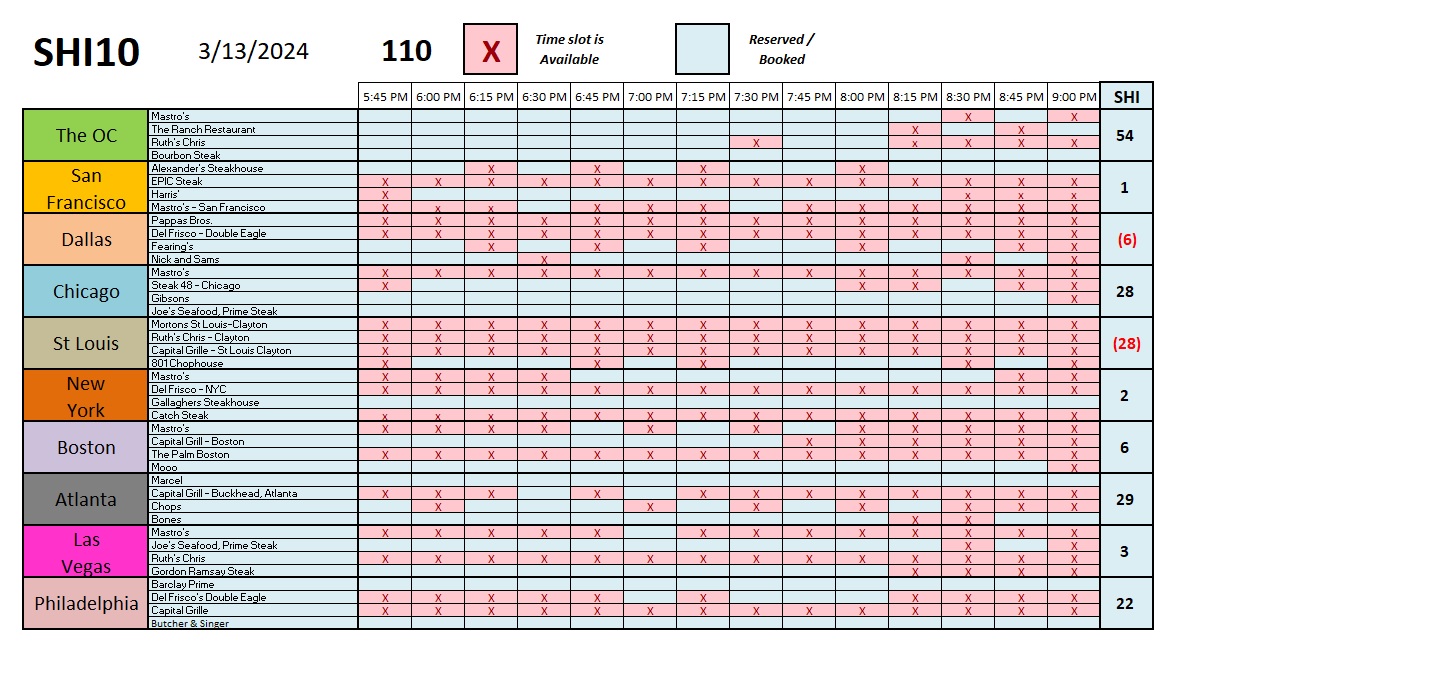
Expensive steakhouse reservations remain in high demand this week. St Louis, our perennial vegan city, continues to struggle … and could Dallas, the only other negative SHI reading this week, be following in their footsteps? Is Dallas going vegan, too? Be still my heart. 🙂
I doubt it. Let’s consider the longer-term chart:
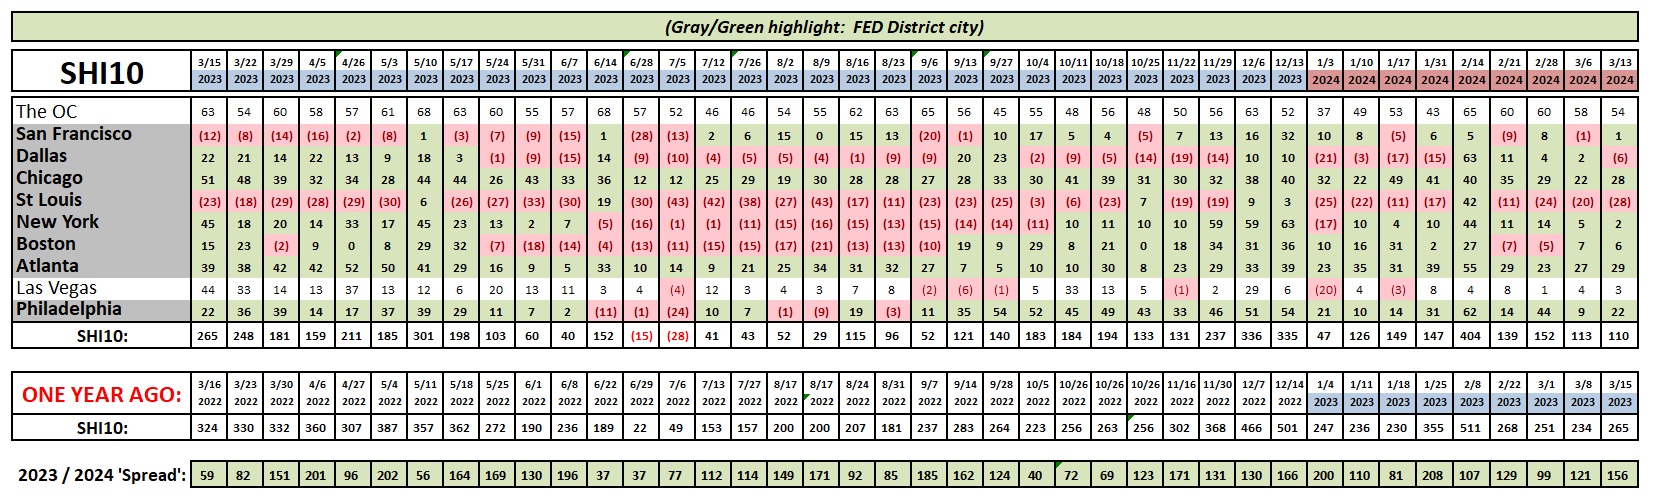
Dallas is certainly showing more ‘red’ than many of the other SHI cities. But ask any Texan if they’re going vegan and you may get punched. I suspect this is a momentary lapse. Ask any Texan, and they’ll say ‘red’ is a rare steak. Nothing more, nothing less. Thanks for tuning in.
<> Terry Liebman


