
SHI 5.1.19 – The SHI is the Place!

SHI 4.24.19 – And The Winner Is ….
April 24, 2019
SHI 5.8.19 – No Steak for You
May 8, 2019
“The Liebman SHI is the winner!”
OK, maybe not. Being perfectly frank, the SHI came in second. But the SHI forecasted a GDP growth rate that was closer to the actual reading than the ‘Nowcast’ prediction from the New York FED! They came in last … so the way I look at it, second place is a win! The SHI beat the NY FED! Woo Hoo! 🙂
If this competition was a horse race, where “win, place and show” are the three possible outcomes, the SHI took ‘place’. Not bad, considering my competitors, right? But with the actual GDP number outpacing all estimates, coming in at a growth rate of 3.2% for the first quarter of 2019, we have to ask the question: Why did everyone miss the mark by such a wide margin? Let’s break it down.
Welcome to this week’s Steak House Index update.
If you are new to my blog, or you need a refresher on the SHI10, or its objective and methodology, I suggest you open and read the original BLOG: https://www.steakhouseindex.com/move-over-big-mac-index-here-comes-the-steak-house-index/
Why You Should Care: The US economy and US dollar are the bedrock of the world’s economy. This has been the case for decades … and will be true for years to come.
But is the US economy expanding or contracting?
According to the IMF (the ‘International Monetary Fund’), the world’s annual GDP is about $80 trillion today. US ‘current dollar’ GDP now exceeds $21 trillion. In Q1 of 2019, nominal GDP grew by 3.8%…following a 4.1% increase in Q4, 2018. We remain about 25% of global GDP. Other than China — a distant second at around $12 trillion — the GDP of no other country is close. We can’t forget about the EU — collectively their GDP almost equals the U.S. So, together, the U.S., the EU and China generate about 2/3 of the globe’s economic output. Worth watching, right?
The objective of the SHI10 and this blog is simple: To predict US GDP movement ahead of official economic releases — an important objective since BEA (the ‘Bureau of Economic Analysis’) gross domestic product data is outdated the day it’s released. Historically, ‘personal consumption expenditures,’ or PCE, has been the largest component of US GDP growth — typically about 2/3 of all GDP growth. In fact, the majority of all GDP increases (or declines) usually results from (increases or decreases in) consumer spending. Consumer spending is clearly a critical financial metric. In all likelihood, the most important financial metric. The Steak House Index focuses right here … on the “consumer spending” metric. I intend the SHI10 is to be predictive, anticipating where the economy is going – not where it’s been.
Taking action: Keep up with this weekly BLOG update. Not only will we cover the SHI and SHI10, but we’ll explore related items of economic importance.
If the SHI10 index moves appreciably -– either showing massive improvement or significant declines –- indicating growing economic strength or a potential recession, we’ll discuss possible actions at that time.
The BLOG:
The ‘advance reading’ of Q1, 2019 GDP surprised pretty much everyone. Perhaps with the exception of Larry Kudlow and President Trump. 🙂
At first, I was shocked. But when you begin to peel away some of the layers, a few interesting facts emerge:
- While the GDP growth rate was 3.2% for the quarter, only 0.85% was contributed by consumer consumption. Said another way, consumption, whicy is typically responsible for between 65% and 70% of GDP growth, contributed only about 27% of the total in Q1. Hmmm….this is concerning.
- The GDP component called ‘Gross private domestic investment,’ (below we will call this metric ‘Investment’) which is a measure of how much individuals and companies ‘invested’ with the intent to enhance, improve or increase future economic results added 0.92%, or 29% of the total. Conceptually, this is a very good thing. As structural investment in plant, facilities, equipment, buildings, structures, etc., can help boost economic productivity and, ultimately, speed up GDP growth. But in Q1, a large increase in “private inventories” was responsible for most of the increase. Unfortunately, this type of growth is typically a one-quarter bump which will have little if any impact on future productivity, or future economic results.
- Net exports accounted for 1.03% of the 3.2% growth rate. About 1/3 of the total. Remember ‘net exports’ is a net of exports over imports. And typically the US imports a TON of stuff. So this is rare … and likely caused by the ongoing trade disputes. So it — too — is unlikely to repeat anytime soon.
Make no mistake: I’m a huge fan of robust GDP growth. And an annual run rate of 3.2% is fantastic! But I’m pragmatic enough to ask if it is sustainable. Will it repeat next quarter? Or is this reading more of a “one and done” phenomenon?
Unfortunately, I believe it’s more of the latter. As the SHI predicted, and as discussed above, actual Q1 growth in ‘consumer consumption’ was fairly anemic. History suggests we can assume the inventory build will not repeat in Q2. And assuming the “import/export” balance will shift (remember: with a negative trade balance, we usually import much more than we export) more toward neutral, the “sustainable” run rate for the Q1 GDP reading is closer to the growth rate I predicted last week. Closer to 1.65% … than 3.2%
I’ve previously mentioned Tim Duy’s blog called ‘Fed Watch.’ He does a good job, and often has some excellent graphics. Two of which I’ve copied and used below.
The first of the graphics below offers an excellent visual picture of how the four (4) GDP components positively and negatively contribute to the quarterly GDP growth reading. The graphic shows quarterly results going back to 2014.
As you can see, all four components added to Q1, 2019 GDP growth. But two (2) quarters ago — more specifically Q3 of 2018 — we see a large negative contribution from ‘Net Exports.’ And a large positive contribution from ‘Investment.’ Each quarter is different. As the image shows. And in this most recent quarter, the red, gray, blue and green segments all add up, positively, to a robust 3.2% annual growth rate.
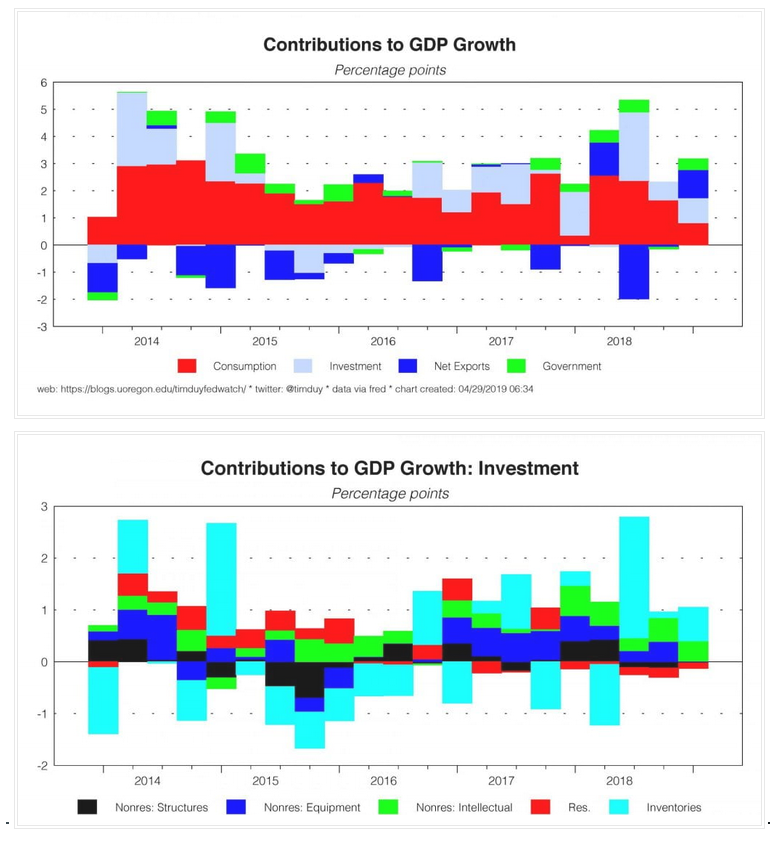
The second image digs a bit deeper, focusing on one of those 4 components — Investment. Investment added .92% of the 3.2% growth in Q1. Once again, the graph above shows a series of colored bars that show either positive and negative contributions to the ‘Investment’ component of GDP growth, again going back to 2014. In Q1, 2019, only ‘Residential’ (in red) was negative. But ‘Non-residential’ structures and equipment were absent. No investment was noted in either of these two sub-categorizes in the last quarter. Intellectual property investment (tech) added a bit to GDP growth (in green) and Inventory growth (in blue) added the most. This image makes it easy to see how volatile the Inventory contribution can be. Now, have no doubt, intellectual property should pay dividends, over time, in productivity improvement, but inventory growth will not.
The bottom line: The GDP reading for Q1, 2019 was sizzling hot! Far higher (clearly) than I expected. And while I’m discounting some of the growth by my comments above, growth is growth. The metrics and methodologies are consistent quarter over quarter, so we must take the excellent reading at face value: The United Stated had a barn-burner Q1 GDP growth rate! Good. I’m just concerned it may not be repeatable in Q2 and beyond … unless consumption improves.
Speaking of consumption, anyone hungry?
Folks in NYC apparently are hankering for some grilled beef! Other than the perennially ‘sunny’ Seattle, NYC is the only SHI10 city in the black today. Here the chart for this week:
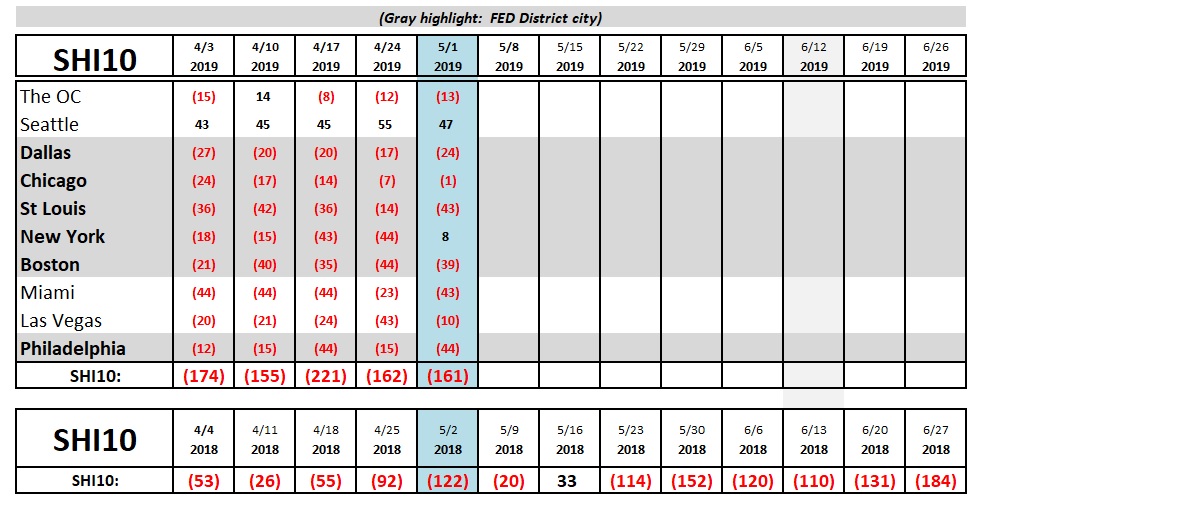
As you can see, the gap between the current SHI10 and last year’s reading has narrowed a bit. We’ll have to keep an eye on this development and see if a trend emerges. But the big-picture trend remains clear: The SHI10 continues to demonstrate weaker restaurant reservation demand in our pricey eateries. And as we consider diminished reservation as a barometer for consumer spending, by extension consumer spending likely continues to be weak. The ‘consumption’ number in the Q1 GDP reading confirmed demand is weak at best … and our SHI10 appears to be telling the same story.
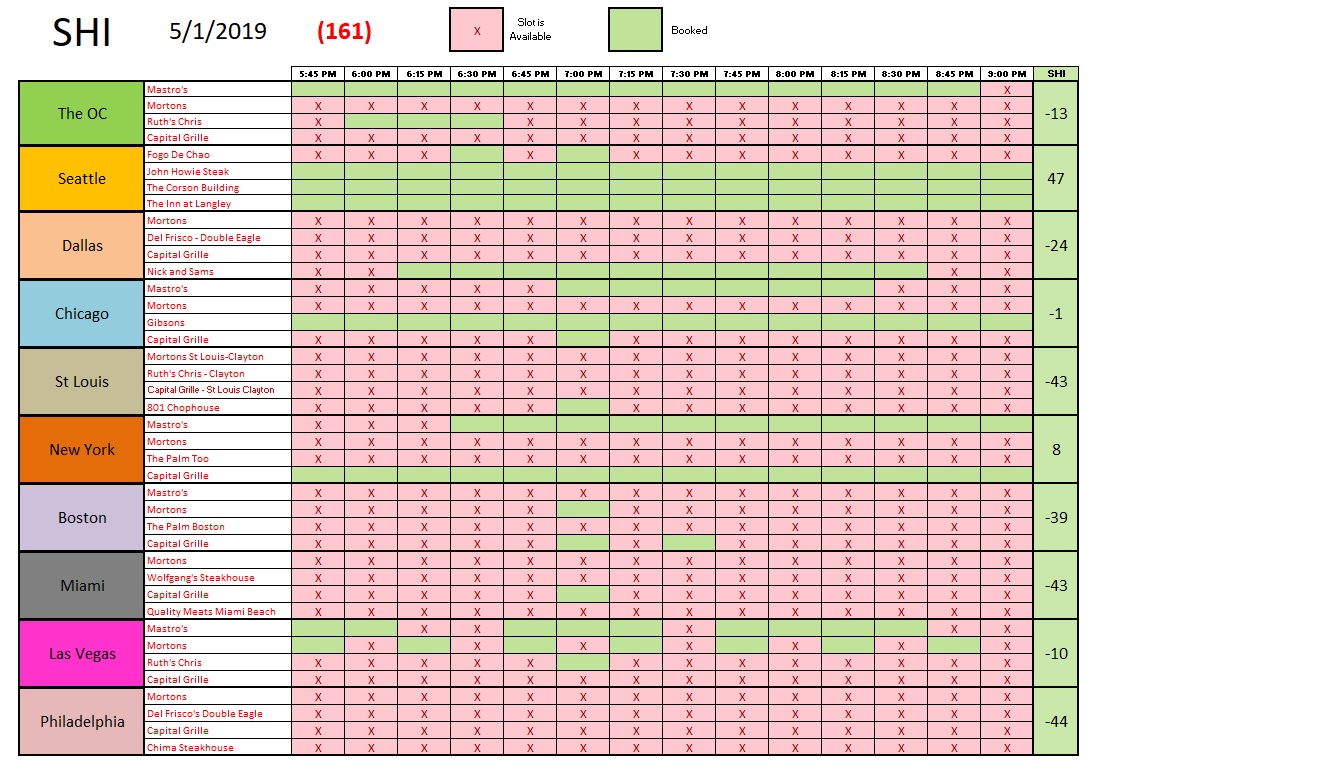
Here are this week’s individual restaurant results:
The FED just finished their May 1st meeting. Here is the first paragraph of the FEDs press release:
“Information received since the Federal Open Market Committee met in March indicates that the labor market remains strong and that economic activity rose at a solid rate. Job gains have been solid, on average, in recent months, and the unemployment rate has remained low. Growth of household spending and business fixed investment slowed in the first quarter. On a 12-month basis, overall inflation and inflation for items other than food and energy have declined and are running below 2 percent. On balance, market-based measures of inflation compensation have remained low in recent months, and survey-based measures of longer-term inflation expectations are little changed.”
Got it. Pretty much what I said above. After the press release, Powell held his typical press briefing. At the briefing, Powell commented the FED expects that “inflation will return to 2% over time.”
I have to tell you , I don’t share his optimism.
Inflation is a tricky thing. It’s quite easy to identify on specific items — for example, the cost to rent a home/apartment. We all know how to tell if rents are rising. And we can all see how competition in, say, the cell-phone space drives prices and inflation down.
But in the aggregate of all goods and services, inflation can easily camouflage itself. It can be very hard to spot. Which is one reason we have so many different models, methodologies and authors that monitor inflation:
- The CPI is the most widely distributed;
- PCE and PCE deflators;
- The Atlanta FED ‘Sticky CPI’ and ‘Flexible CPI’ ( https://www.frbatlanta.org/research/inflationproject/stickyprice.aspx )
- Yardeni’s ‘Price Inflation Indicators’ (https://www.yardeni.com/ )
Further, we have models measuring inflation expectations and investor ‘break even’ interest rate forecasts. The list goes on and on.
The models themselves often disagree. What’s the difference between the PCE and CPI? Here’s a great article by the Cleveland FED on that topic:
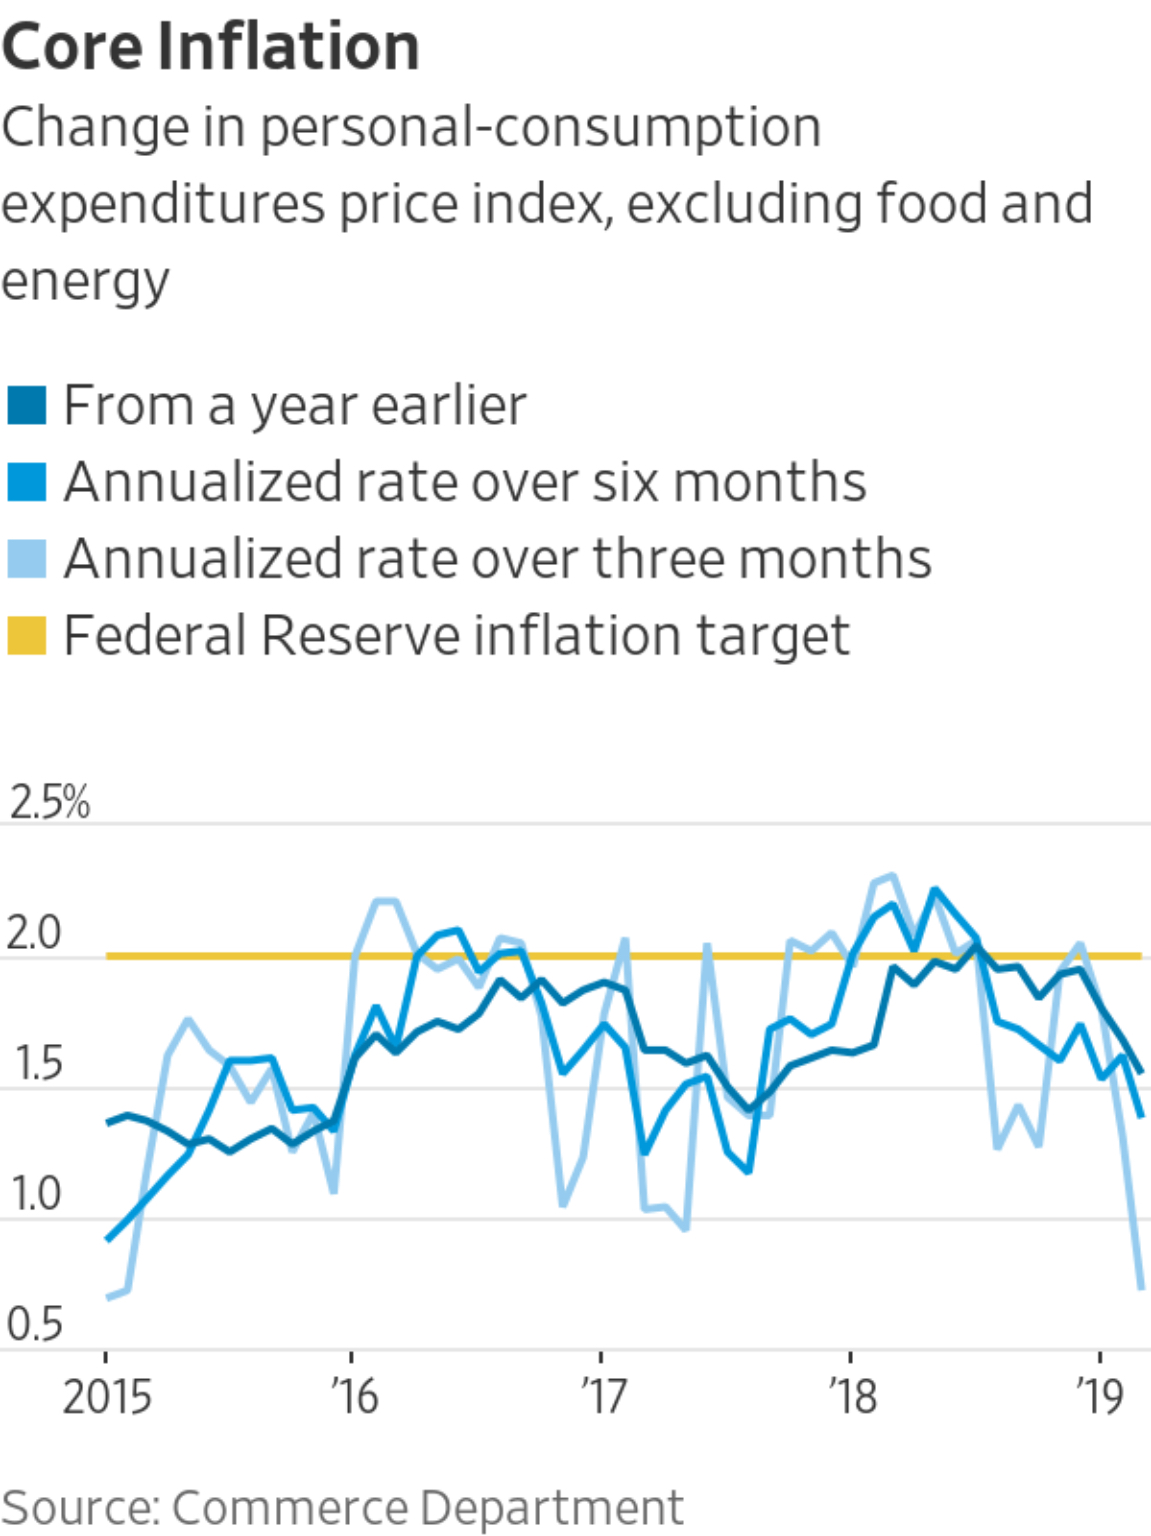
At the end of the day, however, the FED uses only one index: The PCE. And they typically focus more on the PCE after excluding movement caused by food and energy prices, which tend to be volatile month over month. This metric is called the “Core PCE.”
The great chart to the right, provided by our friends at the WSJ, show’s the problem. The Core PCE is declining. And it is declining at a precipitous rate. Your first thought might be, “So what?”
I covered the “so what” in my blog about a month ago. At the time, my concern was more of a “what if” … but today, my concern is heightened. At the rate core PCE is declining, the U.S. could, possibly, soon enter a bout of protracted deflation. That would not be good. And I’m sure this is a serious concern of the FED. Here’s a link to my blog on inflation:
https://www.steakhouseindex.com/shi-3-27-19-why-inflation-matters/
Finally, adding more fuel to the “deflation” fire is a recent, and very comprehensive, working paper on the impact of the internet and E-commerce on goods price inflation written by Austan Goolsbee and Peter Klenow, two economists working at the NBER (National Bureau of Economic Research). Here is a their conclusion:
“We use Adobe Analytics data on online transactions for millions of products in many different categories from 2014 to 2017 to shed light on how online inflation compares to overall inflation, and to gauge the magnitude of new product bias online. The Adobe data contain transaction prices and quantities purchased. We estimate that online inflation was about 1 percentage point lower than in the CPI for the same categories from 2014–2017. In addition, the rising variety of products sold online, implies roughly 2 percentage points lower inflation than in a matched model/CPI-style index.”
Wow. The already-low inflation readings may actually be even lower. By 1%. That is a huge difference … this is troubling, if accurate.
As always, we have plenty of things to worry about. Me? I’m gonna go enjoy a beautifully grilled NY steak and a bottle of 2007 Beaulieu Vineyard “Georges de Latour Private Reserve” Napa Valley Cabernet Sauvignon.
- Terry Liebman


