
SHI 5.8.19 – No Steak for You

SHI 5.1.19 – The SHI is the Place!
May 1, 2019
SHI 5.15.19 – The Truth About This Trade Thing
May 15, 2019
“Sorry, but there will be no SHI this week.”
Unfortunately, I’ll be “out” most of the day Wednesday and will be unable to compile the data. Sorry. But permit me a few comments nonetheless. Economics was never intended to be simple. It can be as dense and opaque as a thick NY strip steak. But these days, even the simple seems incredibly complex and confusing.
Welcome to this week’s Steak House Index update.
If you are new to my blog, or you need a refresher on the SHI10, or its objective and methodology, I suggest you open and read the original BLOG: https://www.steakhouseindex.com/move-over-big-mac-index-here-comes-the-steak-house-index/
Why You Should Care: The US economy and US dollar are the bedrock of the world’s economy. This has been the case for decades … and will be true for years to come.
But is the US economy expanding or contracting?
According to the IMF (the ‘International Monetary Fund’), the world’s annual GDP is about $80 trillion today. US ‘current dollar’ GDP now exceeds $21 trillion. In Q1 of 2019, nominal GDP grew by 3.8%…following a 4.1% increase in Q4, 2018. We remain about 25% of global GDP. Other than China — a distant second at around $12 trillion — the GDP of no other country is close. We can’t forget about the EU — collectively their GDP almost equals the U.S. So, together, the U.S., the EU and China generate about 2/3 of the globe’s economic output. Worth watching, right?
The objective of the SHI10 and this blog is simple: To predict US GDP movement ahead of official economic releases — an important objective since BEA (the ‘Bureau of Economic Analysis’) gross domestic product data is outdated the day it’s released. Historically, ‘personal consumption expenditures,’ or PCE, has been the largest component of US GDP growth — typically about 2/3 of all GDP growth. In fact, the majority of all GDP increases (or declines) usually results from (increases or decreases in) consumer spending. Consumer spending is clearly a critical financial metric. In all likelihood, the most important financial metric. The Steak House Index focuses right here … on the “consumer spending” metric. I intend the SHI10 is to be predictive, anticipating where the economy is going – not where it’s been.
Taking action: Keep up with this weekly BLOG update. Not only will we cover the SHI and SHI10, but we’ll explore related items of economic importance.
If the SHI10 index moves appreciably -– either showing massive improvement or significant declines –- indicating growing economic strength or a potential recession, we’ll discuss possible actions at that time.
The BLOG:
The unemployment report — like the GDP report just days before — was a barn-burner: The unemployment rate fell to 3.6%, an exceptionally low rate last seen in 1969 — 50 years ago. Here’s where the data gets a bit murky:
- FACT ONE: Total non-farm payrolls increased by 263,000 people during. (BLS News Release 5/3/19)
- FACT TWO: The number of people employed decreased by 103,000 by the end of that same month! (Employment Situation Summary Table A.)
How does that happen?
It’s been said, “Truth is stranger than fiction.” Clearly. I don’t make this stuff up. The unemployment rate change makes sense: The labor force shrunk by 490,000 folks — retirement, I suspect — and the resultant math dictates the unemployment rate of 3.6%. But how can the number of employed people decrease in the same month the size of the payroll increased? I’m baffled. Clearly I’m missing something … so feel free to offer your thoughts.
I had the chance to watch Jeffery Gundlach interviewed on CNBC Monday morning. Known as “the Bond King,” he has always been a fount of information and strong opinions. And, as a result, he has become a lightning rod for incendiary comments from colleagues and detractors. He’s an entertaining guy!
But two of his comments caused me pause … and a lot of thought. Let me paraphrase what I heard Gundlach say:
- All GDP growth in the last year is the direct result of our deficit spending.
- When the next recession hits, deficit spending will reach $4 trillion per year, or about 20% of GDP.
Holy Canole! No, the first comment, while an interesting perspective, isn’t giving me heartburn.
That second one does. Could he right? Sure, anything is ‘possible.’ But is it ‘probable?’ Let’s take a look.
Arguably, the ‘Great Recession of 2008’ (GR08) was the worst American recession since the Great Depression almost 80 years before. The conditions that lead too, and triggered, the GR08 are unlikely to repeat in our lifetime. And so, in my opinion, the negative financial flows experienced by the US during the GR08 likely establish a worst-case scenario. Said another way, the next recessions won’t be anywhere near as bad as the GR08, and, by extension, the adverse outcomes will be smaller. Make sense? So, let’s see if we can establish the worst case scenario. And we’ll use real data (none of that “fake” stuff for you, my friends!) from our friends at FRED and the St Louis Federal Reserve Bank:
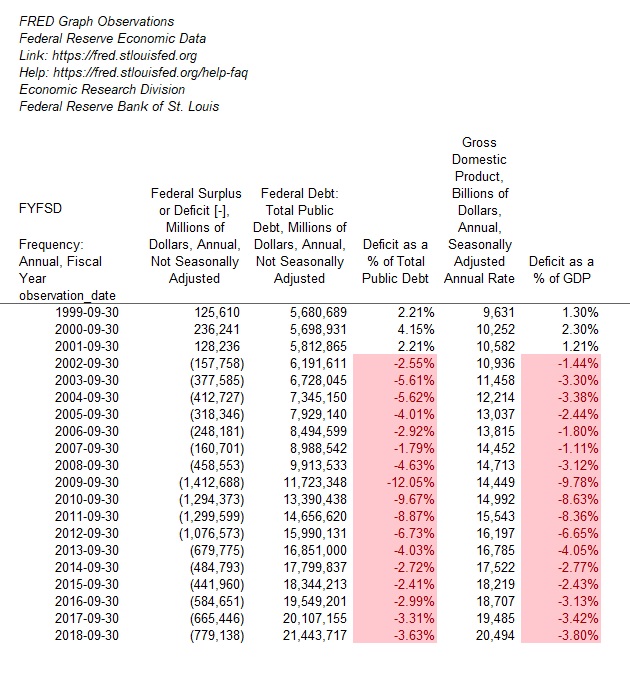
I included data back to 1999 … because it’s interesting to see there was a time when the US had a SURPLUS! For three years, the US Treasury took in more in taxes than the US government spent. It can be done!
But typically not during a recession. Tax collections can drop precipitously, and government spending — a la the Keynesian theory of “priming the pump” — usually increases. With lower collections and increased spending, deficits widen. Look at 2009. That year, the US deficit almost reached 10% of GDP. Wow. Staggering.
Let’s see how bad the deficit got during previous recessions:
- 2001: We experienced no deficit. The US actually had a surplus during the recession.
- 1990 – 1991: The deficit, as a percentage of GDP, peaked at 4.3% in 1991.
- 1973 – 1975: The deficit peaked at almost 4% — actually, during the year following the end of the recession.
- 1969-1970: 1969 showed a small surplus and deficit spending a year or two after the recession ended peaked at just under 2% of GDP.
The data tells a pretty convincing story: The deficit during the GR08 was far and away the deepest the US has ever experienced. And it remained very deep for a number of years, quickly driving our “public debt” from about $10 trillion in 2008 to over $20 trillion about 10 years later (see the chart above.)
Could the next recession drive the US deficit to 20% of GDP — or over $4 trillion in a year? Again, anything is possible. But I think this outcome is improbable. What outcome would I expect?
Well, let’s assume the US “structural” deficit, right now, is about $1 trillion. Unfortunately, our annual deficit is currently running about 5% of GDP. Ouch. This is where we start.
In 2009, according to FRED, the “Federal Government Current Receipts” declined by a bit over 13%. Wow. Let’s go back a bit further: The year following the 2001 recession, receipts fell by almost 8%. But in 1992, receipts by the Treasury actually increased. So will collections decline in the next recession? Let’s assume they decline by 5%. As current Treasury collections run about $3.5 trillion, a 5% reduction in collections would add $175 billion to the deficit. And let’s assume government spending increased by another $300 billion.
Adding it all up, the US could likely see a $1.5 trillion annual deficit during the next recession. Meaning the deficit would reach about 7% of GDP during one year.
Gundlach’s concern is simple: How would the US government finance this deficit? Will this additional ‘supply’ of Treasury debt for sale require a sizable interest rate increase to attract buyers/investors? And how about a multi-year deficit in this same range? What problems might this create? Great questions.
In the final analysis, I would offer this comment: Gundlach is right to be concerned about recession-triggered deficit spending. However, I don’t believe the outcome will be as ominous as he suggests … but multi-year deficits of this magnitude could begin to make US Treasury debt a little less desirable, a little more risky in the eyes of investors. Something to watch … and we shall.
Next week, we’ll return with the SHI10. Sorry again. Go grab a steak!
- Terry Liebman


