
Steak House Update: August 3, 2016
Japan Warning: Don’t Step in a Bear Trap!
August 2, 2016Home Prices around the Globe
August 4, 2016It’s time for our next SHI update! This Friday at 5:30am CA time the BLS will release the July non-farm payroll report; thus, we’ll update the SHCI next week.
Why You Should Care: The US BEA publishes the most recent GDP figures the instant they’re available. Unfortunately for us, it is a trailing index. The late release isn’t overly helpful if we’re trying to stay ahead of the curve.
Year to date in 2016, the real US GDP is trending at only 1.0%. A lackluster reading at best. Will Q3 be better? I’d sure like to know in advance, wouldn’t you? 🙂
Personal consumption expenditures, or PCE, was the strongest component of the last GDP reading. In fact the vast majority of the latest 1.2% GDP increase came from consumer spending. Clearly this is an important metric to track.
The SHI may help us do just that. I intend the SHI is to be predictive, to anticipate when the economy is going to ‘turn’ and give you the ability to take action early – not when changes are too late.
Taking action: Just keep up with the weekly column. If the index changes appreciably – either showing massive improvement or significant declines – indicating expanding economic strength or a potential recession, we’ll discuss possible actions at that time.
Trending is very important…and we’ll watch the trend.
THE BLOG: The 2016: Q2 GDP reading was, well, disappointing. Even worse, Q1 was downgraded to only 0.8%. Combined, the first half of 2016 saw only a 1.00% GDP increase. Remember this number has been adjusted (reduced) by a price deflator, so in ‘current-dollar’ terms, it’s not as bad as it looks. This year, current-dollar GDP has increased by $212.2 billion – about a 2.3% annual increase. So, not too bad.
Here’s an interesting question: Of the $212.2 billion current-dollar GDP increase, what percentage of this increase came from consumer spending? All of it. Every single dollar. In fact, 117% of it came from consumer spending increases. How is this possible? Well, other components of the GDP were degressive, actually reducing US economic output.
Clearly, consumer spending is of paramount importance to the GDP! Today more than ever!
Without further ado, let’s sink our teeth into this weeks SHI! It’s not as tasty as a medium-rare filet, but, hey, it’s more interesting!
Once again, we can get a table at 9:00 pm at Mastros. But not before. And at the other end of the spectrum, you can get any time-slot you desire at the Capital Grille. Nothing new here. Morton’s is about as busy as last week…but tables at Ruth’s Chris are harder to come by this week. Take a look:

This week our index reading is a positive 2. Looking at the SHI trend below, we see that the 4/27 reading of a negative 23 was the low point, and our positive 22 on 3/9, the high point. A reading of +2 is pretty much right in the middle. Here is our trend analysis:

This week, as promised, I’m introducing a graph of SHI results since inception. Here it is:
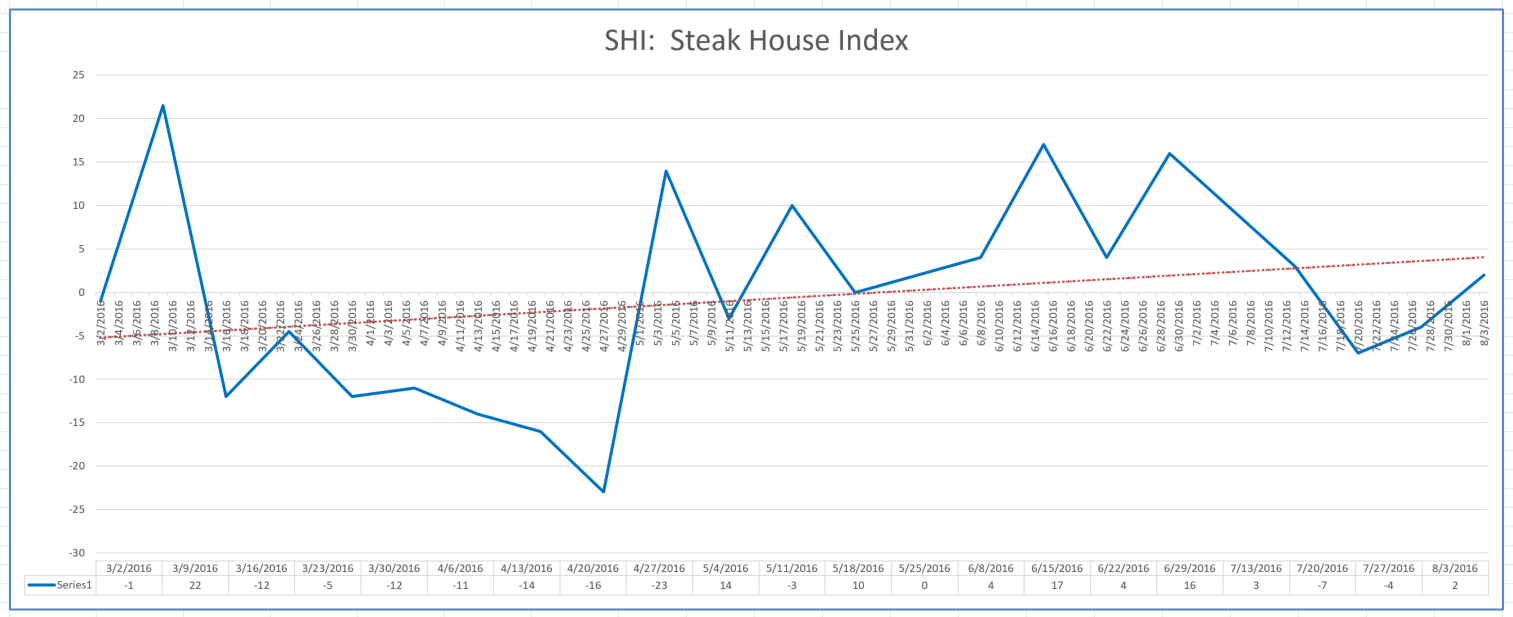
The blue line shows index movement from our first reading on 3/2 thru today. The red line is the trend, also since inception. It’s interesting to note the trend is improving. This fact would suggest that consumer sentiment, as measured by the SHI, is also improving.
This finding seems to align well with the stellar YTD performance of the PCE and its 117% contribution to GDP growth. While it’s too early to tell if a sustained decline in the SHI would correlate with a decline in PCE, at this point in our experiment it appears that they are highly correlated.
Thanks for taking the time to follow this blog. As always, feel free to toss any questions my way.
- Terry Liebman


