
The Employment Situation
Long Bonds
June 5, 2016SHI Update – June 8, 2016
June 8, 2016Our federal government, and all their departments, publish a massive amount of data. More than any one person can possibly consume. Rest assured, I try! Some of the data is critically important when tracking the economic pulse of our economy, as we do.
The data discussed in this blog is precisely that type.
Why you should care: In my opinion, the greatest risk to my prediction of continued low inflation is wage inflation. Inflation that might be caused by a labor imbalance, where the ‘demand’ for labor exceeds its ‘supply,’ thereby causing excessive competition for labor, setting into motion a cycle of increasing wages and, ultimately, inflation.
Taking action: Keep up with the blog…keep thinking about the implications.
THE BLOG: In my recent blog, “Voodoo Math” I shared that the unemployment rate fell, this month, to the unlikely rate of only 4.7%. Here’s that blog post:
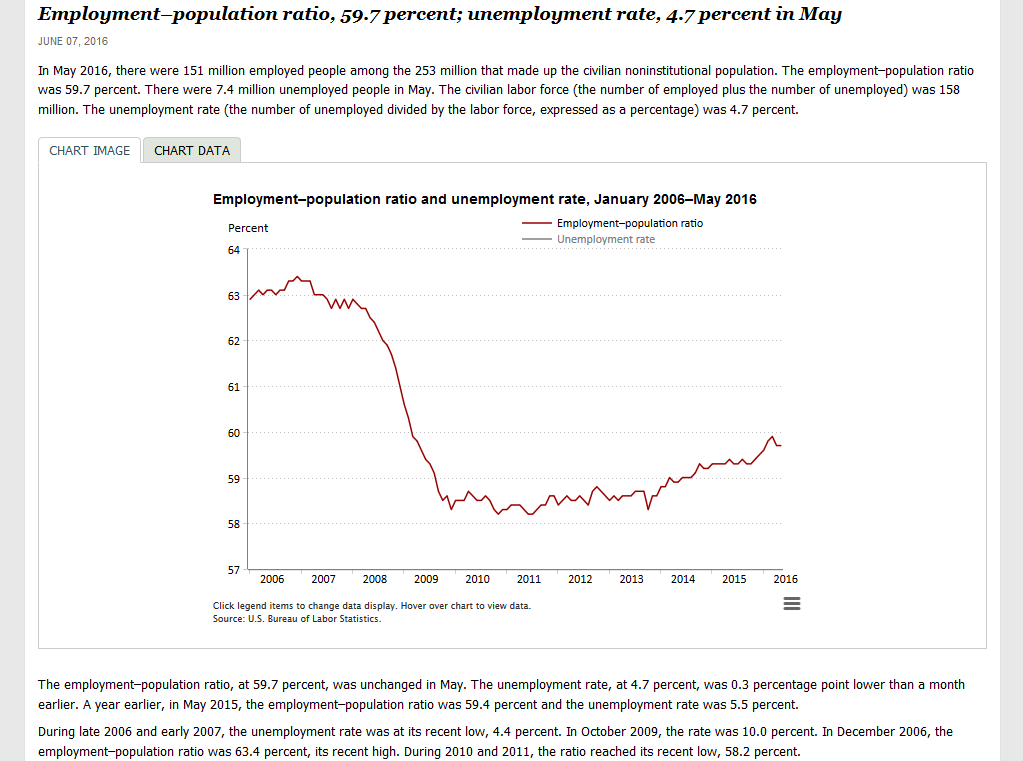
Today, the BLS released a great graphic which shows just how problematic this number is. Here’s the graphic (please click to enlarge):
Let’s take a look at the numbers.
Employment/Population Ratio: At 59.7% today, this means that 40.3% of the ‘Civilian Noninstitutional Population’ (CNP) is not working. Remember, the CNP includes all folks 16+ years and older, not in an institution, who could work if the spirit moved them. This includes my 86 year old father… and Goldie Michelson, who at 113 is the oldest living American. She is also a member of the CNP. She could get a job, right?
So, all the folks in the CNP are not ‘unemployed,’ nor are they all employable. They’re simply not working for a variety of reasons. Some are unemployed, some are retired, some are incapacitated, but regardless, this non-working group equals about 102 million people.
Employed and Unemployed: This totals about 158 million people. Of which, by the BLS definition, 7.4 million are unemployed. OK…let’s keep digging.
Labor Force Participation Rate: According the the Census Bureau back in 2011, in the aggregate 20.7% of men and 12.7% of women over the age of 65 remain fully employed. Of course, the employment percentage drops off precipitously as both groups age:

Folks between 16 and 65: In 2010 the CB said the US had 243 million folks over 16 years old. As we see above, today we have 253 million. 10 million more.
Of the 243 million, about 40 million were 65 and older, or about 16.5%. This percentage had moved up just slightly from about 16% in 2000.
Let’s assume it’s 17% today. Which means 17% of the 253 million folks in the CNP are 65 and older – about 43 million. And that means the rest are under 65 – and are, in theory, working age.
OK…a bit more math:
253 million minus 158 million (which number includes the ‘unemployed’) equals 95 million folks in the “non-working” group. Subtracting 43 million of folks who are 65 and older (even though a small percentage still work), we have 52 million people who are not gainfully employed and are not unemployed by the BLS definition.
52 million people. Above and beyond the 7.4 million ‘unemployed.’ That’s an awful lot.
Sure, this number exaggerates the problem. After all, the civilian population/employment ratio reached it’s all-time high of 64.7% in April of 2000. So even if the number of able-bodied folks who would love a job is equal to 64.7% minus 59.7% – or 5% – this means about 12.6 million people above and beyond the 7.4 million ‘unemployed’ are not working.
According the the BLS, they’re not looking for a job. But they’re not working nonetheless. To me, by this metric, we still have a fair amount of slack in the labor force.
We’ll continue to watch and see.
- Terry Liebman


