SHI 8.25.21 – The Steakhouse, Hawaii and Delta

SHI 8.18.21 – Looking Back to See the Future
August 18, 2021
SHI 8.31.21 – Looking for Inflation
September 1, 2021
The Delta variant is causing a lot of problems. Globally.
The Governor of Hawaii has asked us to cancel any non-essential trips to his island paradise. “Now is not the time to visit the islands,” he told us on Monday. The island country of New Zealand, with a population of just under 5 million, after discovering one (1) Covid case on the 17th went even further — they went into a “Level 4 lockdown” until the end of August, which requires all New Zealanders to stay at home unless exercising, food or medical shopping, or getting a Covid test. Ouch.
“
Is Delta affecting reservation demand?“
“Is Delta affecting reservation demand?“
But has Delta blunted the demand for reservations in our expensive US eateries? How about in the “hard hit” cities in the southeast? How is Delta affecting the US economy vis-à-vis our pricey steak houses?
Welcome to this week’s Steak House Index update.
If you are new to my blog, or you need a refresher on the SHI10, or its objective and methodology, I suggest you open and read the original BLOG: https://www.steakhouseindex.com/move-over-big-mac-index-here-comes-the-steak-house-index/
Why You Should Care: The US economy and US dollar are the bedrock of the world’s economy.
But is the US economy expanding or contracting?
The short answer? Expanding. By a staggering measure. In fact, during Q1 and Q2, annualized 2021 ‘real’ growth averaged about 6.4%. In nominal terms, our US economy averaged almost 12% growth — adding $1.245 trillion of economic activity during the first half of the year. Forever more, COVID-19 will be mentioned concurrently with any discussion about 2020 GDP. Collectively, the world’s annual GDP was about $85 trillion by the end of 2020. But I am confident all 2021 GDP discussions will start with a nod to the blowout 1st quarter GDP growth number, because our ‘current dollar’ GDP grew at the annual rate of 10.7%! Annualized, America’s GDP blew past $22 trillion during the quarter, settling in at $22.72 trillion. The US, the euro zone, and China continue to generate about 70% of the global economic output.
The objective of this blog is singular.
It attempts to predict the direction of our GDP ahead of official economic releases. Historically, ‘personal consumption expenditures,’ or PCE, has been the largest component of US GDP growth — typically about 2/3 of all GDP growth. In fact, the majority of all GDP increases (or declines) usually results from (increases or decreases in) consumer spending. Consumer spending is clearly a critical financial metric. In all likelihood, the most important financial metric. The Steak House Index focuses right here … on the “consumer spending” metric. I intend the SHI10 is to be predictive, anticipating where the economy is going – not where it’s been.
Taking action: Keep up with this weekly BLOG update. Not only will we cover the SHI and SHI10, but we’ll explore related items of economic importance.
If the SHI10 index moves appreciably -– either showing massive improvement or significant declines –- indicating growing economic strength or a potential recession, we’ll discuss possible actions at that time.
The Blog:
The simple answer: It is not. Our SHI10 restaurants remain packed to the gills.
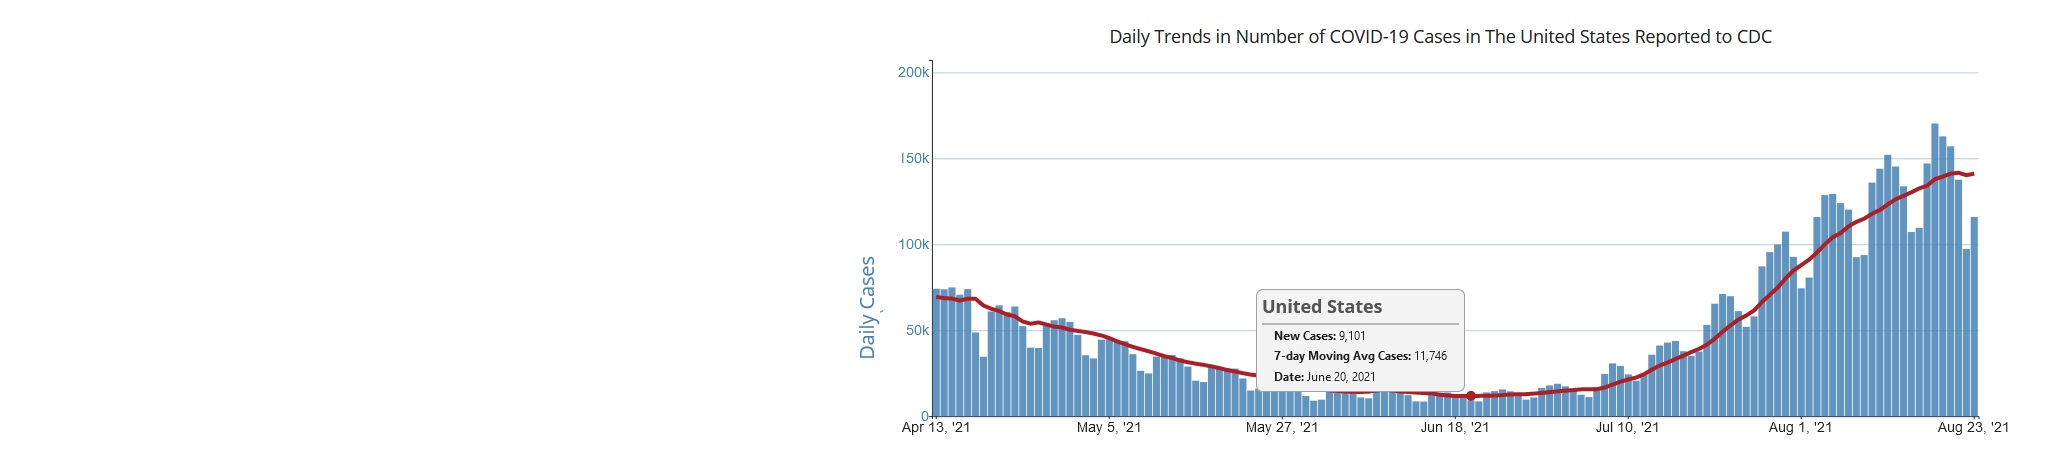
The 7-day moving average of “New Cases” reported to the CDC bottomed below 12,000 in mid-June. As you can see from the chart below, the 7-day average appears to have peaked earlier this month … and is now declining. However, at its peak, the daily average almost hit 140,000. This chart measures nationwide data — so we can’t glean anything about Atlanta vs. San Francisco with this data set, but in the aggregate we can see that cases have moved up dramatically in the past few months. A lot. In fact, measured Covid cases are up more than 10X since the low point back in mid-June:
I’m sure restaurant reservation demand in Hawaii is way down. In New Zealand, I suspect reservation demand is down 100%. But as Paul Simon said years ago, “One man’s ceiling is another man’s floor.” New Zealand may be closed, but the Cook Islands are open! In fact, the Kiwis have single handedly helped that tourism in that small island nation to reach almost pre-pandemic levels! 🙂
How about here in the US? Has the Delta variant caused well-heeled diners to cancel reservations and stay home? Nope.
I’ve lined up the weekly dates for the charts above and below. The ‘4/14’ data below closely aligns with a similar date above. And the same for the 8/25 data. Even as Delta cases increased 10X between mid April and now, expensive steak house reservation demand has remained fairly constant:
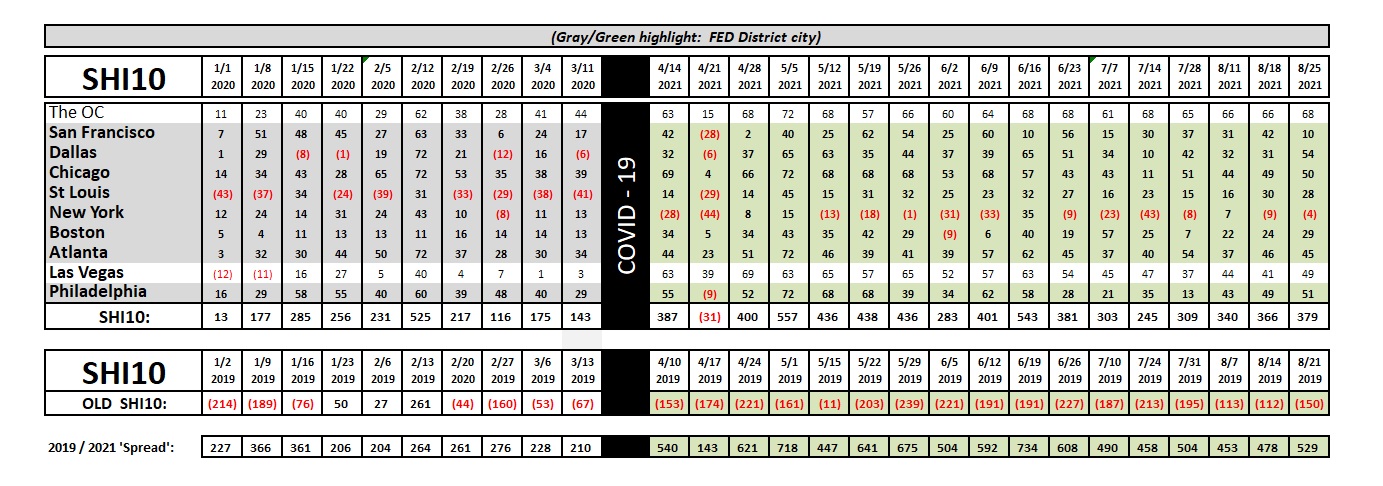
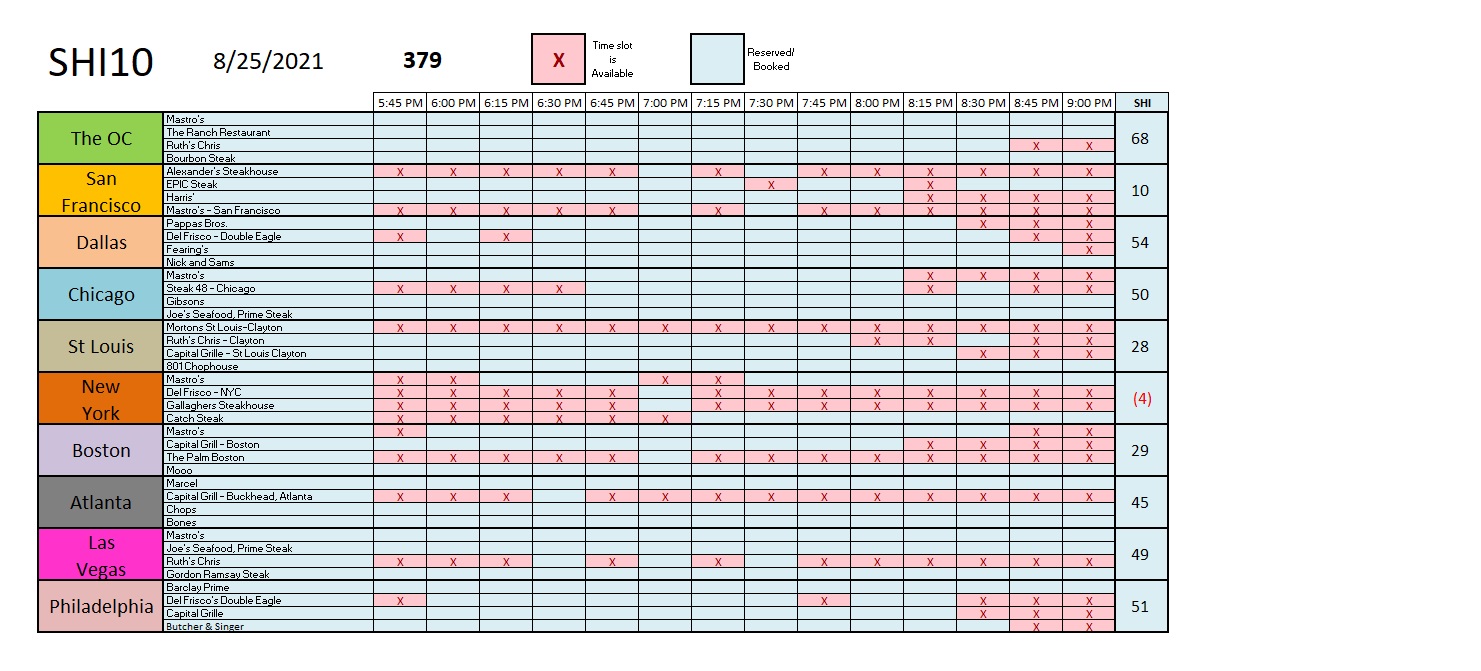
This week’s SHI10 is almost unchanged from last week. Like a super rare Filet, New York is still in the red. But demand here in the OC is smoking hot. Pricey steakhouse reservations for this coming Saturday are in lower demand in San Francisco, but demand in most other metropolitan areas remains quite strong.
Take a look.
The photo above? That’s the Cook Islands. Specifically, it’s a photo of a super small island named ‘Aitutaki.’ By the way: I’ve been there. It is ABSOLUTELY GORGEOUS! So here’s what I think: If Hawaii is closed, let’s head to the Cook Islands and join our Kiwi buddies. 🙂