
SHI 8.18.21 – Looking Back to See the Future

SHI 8.11.21 – Deconstructing Productivity
August 11, 2021
SHI 8.25.21 – The Steakhouse, Hawaii and Delta
August 25, 2021
There are moments in time that change the path of human history. The US Declaration of Independence … the invention of the internal combustion engine … and the microprocessor each pushed humanity down a new and unexpected path.
Of course, no one knows how seminal such an event is the moment it happens. Some strongly express their beliefs, but no one really knows for sure. Only with the passage of time, looking back, can we know for certain.
One such event changed the global monetary system precisely 50 years ago this week. The shockwaves from that event continue today as the global financial system evolves.
“
Another chapter is being written.“
“Another chapter is being written.“
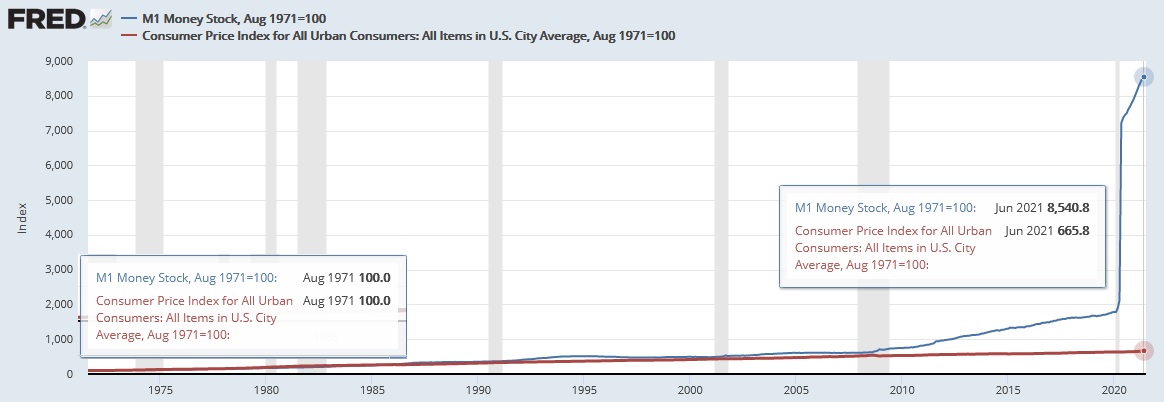
That event, which occurred on August 15, 1971, marked the end of an era. On that day, US President Richard Nixon terminated the “gold standard” ushered in decades before, as WW2 was ending. No longer were 35 US dollars convertible to 1 ounce of gold. Nixon closed the gold window. And when he did, the global monetary system changed forever.
The connection between gold and the USD was permanently severed. No longer was the supply of USD limited by gold supplies. Like a genie in a bottle, once the cork was pulled, money supply growth was no longer constrained. By the end of the 1970’s, money supply almost doubled. And inflation followed suit.
Change has consequence — both intended and unintended. We’ll discuss one of those consequences today … and then we’ll visit the steakhouses.
Welcome to this week’s Steak House Index update.
If you are new to my blog, or you need a refresher on the SHI10, or its objective and methodology, I suggest you open and read the original BLOG: https://www.steakhouseindex.com/move-over-big-mac-index-here-comes-the-steak-house-index/
Why You Should Care: The US economy and US dollar are the bedrock of the world’s economy.
But is the US economy expanding or contracting?
The short answer? Expanding. By a staggering measure. In fact, during Q1 and Q2, annualized 2021 ‘real’ growth averaged about 6.4%. In nominal terms, our US economy averaged almost 12% growth — adding $1.245 trillion of economic activity during the first half of the year. Forever more, COVID-19 will be mentioned concurrently with any discussion about 2020 GDP. Collectively, the world’s annual GDP was about $85 trillion by the end of 2020. But I am confident all 2021 GDP discussions will start with a nod to the blowout 1st quarter GDP growth number, because our ‘current dollar’ GDP grew at the annual rate of 10.7%! Annualized, America’s GDP blew past $22 trillion during the quarter, settling in at $22.72 trillion. The US, the euro zone, and China continue to generate about 70% of the global economic output.
The objective of this blog is singular.
It attempts to predict the direction of our GDP ahead of official economic releases. Historically, ‘personal consumption expenditures,’ or PCE, has been the largest component of US GDP growth — typically about 2/3 of all GDP growth. In fact, the majority of all GDP increases (or declines) usually results from (increases or decreases in) consumer spending. Consumer spending is clearly a critical financial metric. In all likelihood, the most important financial metric. The Steak House Index focuses right here … on the “consumer spending” metric. I intend the SHI10 is to be predictive, anticipating where the economy is going – not where it’s been.
Taking action: Keep up with this weekly BLOG update. Not only will we cover the SHI and SHI10, but we’ll explore related items of economic importance.
If the SHI10 index moves appreciably -– either showing massive improvement or significant declines –- indicating growing economic strength or a potential recession, we’ll discuss possible actions at that time.
The Blog:
Once the dollar was no longer backed by gold, many “gold bugs” will tell you, the US Treasury was free to print as much money as it wished. Correct.
Untethered by the pesky relationship requiring the US Treasury to hold 1 ounce of gold to back every 35 dollars, the genie was out of the bottle. Within a couple of years, clearly unhappy with the defacto devaluation of the US dollar, oil producers pushed up prices by about 4X. Oil was, and continues to be, priced in dollars. Once free to run, US money supply almost doubled by the end of the decade. And the CPI was right there, shoulder-to-shoulder, with the money supply increase. During the 1970s, the CPI increased by over 90%.
But we have to ask: Was there a causal relationship between these correlated events ? Did the elimination of the gold peg usher in extraordinary money supply growth … and did the M1 growth trigger consumer price inflation? We see correlation … but is there causation?
Probably. For reasons to arcane to cover here, I believe M1 growth rates and CPI increases were connected during the 1970s, 1980s, likely continuing thru the early 2000s. Right up until the “Great Recession of 2008.” After the recession ended, money supply and consumer inflation began to move independently.
Notice I said consumer inflation. This is an important distinction. Consumer inflation was no longer correlated with money supply growth. However, asset inflation was. And this relationship holds today — stronger than ever. The bifurcation between consumer and asset inflation since 2009 or 2010 is fascinating … and has picked up pace since early 2020 when money supply exploded:
Assets like homes, investment real estate, baseball cards, fine art, and rare automobiles, alike, are all experiencing huge value gains. Consider the Monterey Car Week “Pebble Beach Concours d’Elegance” completed just last week. Five auction houses brought in a total of $343 million across three days of sales—up 37% over the same array of opportunities in 2019 — even more impressive as this year’s auction had 25% fewer cars. (Monterey Car Week was canceled in 2020, due to the coronavirus pandemic.) “It was spastic and bombastic,” says Peter Brotman, a longtime specialty car broker to ultra-high-net-worth clients. Check this out:
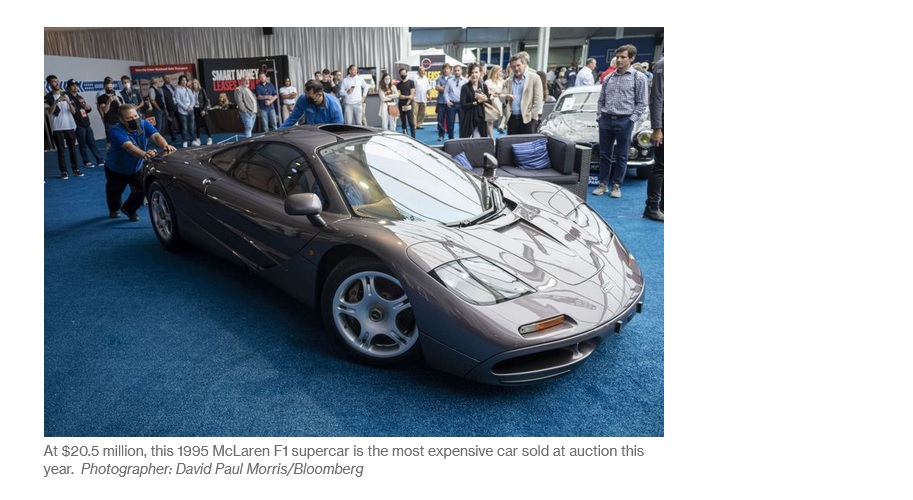
That’s right: $20.5 million. For a used car. Geez. 🙂
The FEDs minutes from their last meeting, just out earlier today, used the word “transitory” eight (8) times. This is one quote containing the word:
The staff’s near-term outlook for inflation was revised up further in response to incoming data, but the staff continued to expect that this year’s rise in inflation would prove to be transitory. The 12-month change in total and core PCE prices was well above 2% in May, and available data suggested that PCE price inflation would remain high in June. The staff continued to judge that the surge in demand that had resulted as the economy reopened further had combined with production bottlenecks and supply constraints to boost recent monthly inflation rates.
The staff expected the 12‑month change in PCE prices to move down gradually over the second part of 2021, reflecting an anticipated moderation in monthly inflation rates and the waning of base effects; even so, PCE price inflation was projected to be running well above 2 percent at the end of the year. Over the following year, the boost to consumer prices caused by supply issues was expected to partly reverse, and import prices were expected to decelerate sharply; as a result, PCE price inflation was expected to step down to a little below 2 percent in 2022 before additional increases in resource utilization raised it to 2 percent in 2023.
Did you notice the use of “PCE” when the FED describes inflation? Remember that PCE means “Personal Consumption Expenditures.” Not fine art or rare automobiles. And when they drill down even further, the “core” PCE excludes food and energy costs.
The bottom line: I agree with the FED. Consumer inflation is likely to be transitory. But asset inflation? That, my friends, is highly correlated with money supply. Asset prices are going up. A lot. In lock-step with money supply.
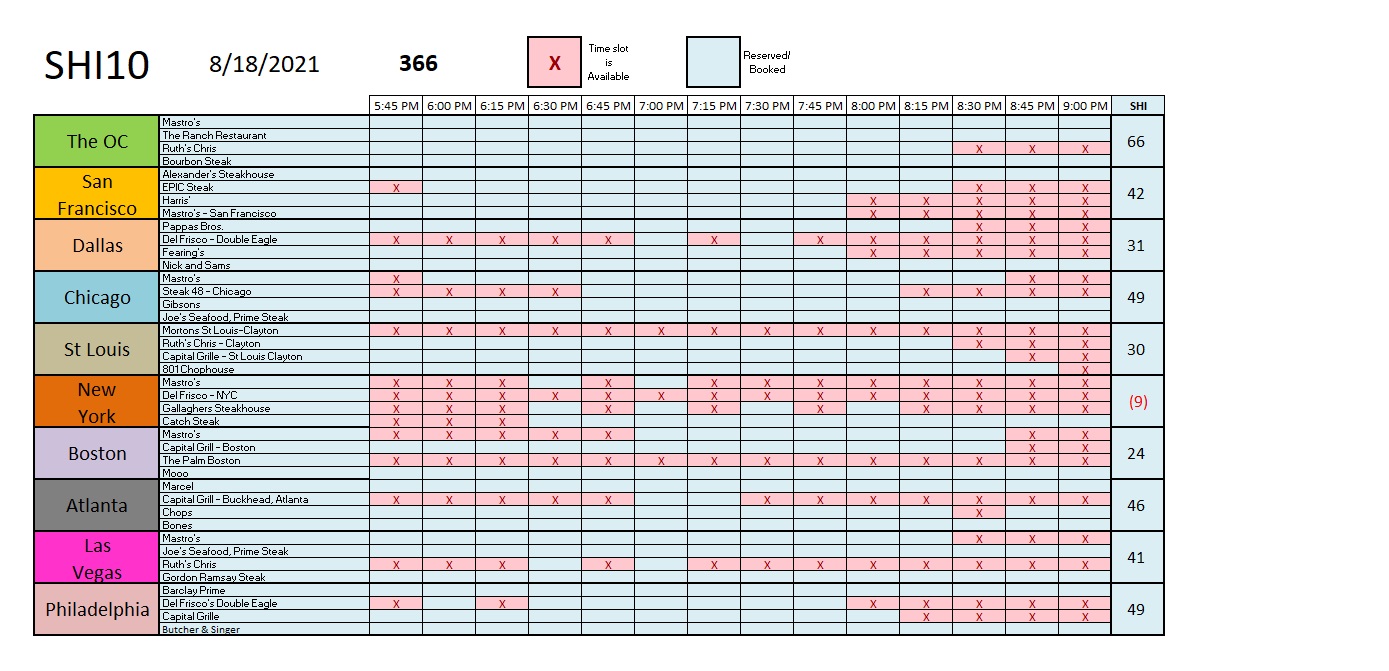
The Delta variant is not keeping McLaren buyer away from the steakhouses. The longer-term trend report, once again, reflects strong reservation demand for Saturday the 21st:
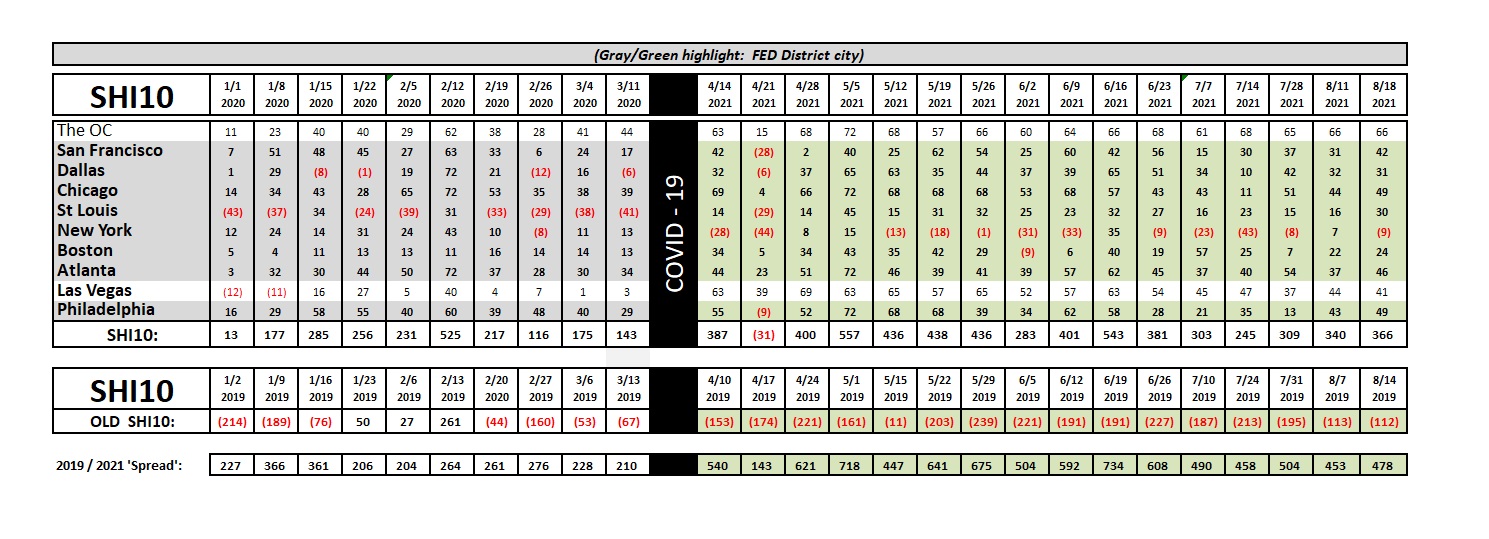
NYC is once again in the red after briefly breaking out last week. But over all, the SHI10 this week is a bit stronger than last. Grills are sizzling. Here is the weekly grid:
The FED is carefully watching consumer inflation and economic impacts from Delta, all the while continuing to purchase monetary assets. (I think they should pick up a few nice vintage roadsters, too.) By the way, the FED balance sheet has now eclipsed $8.25 trillion. Staggering.
There’s a whole lot of money floating around out there. Gadzooks. Money is cheap.
<:> Terry Liebman


