
SHI 8.31.21 – Looking for Inflation

SHI 8.25.21 – The Steakhouse, Hawaii and Delta
August 25, 2021
SHI 9.8.21 – The Next Big Scare
September 8, 2021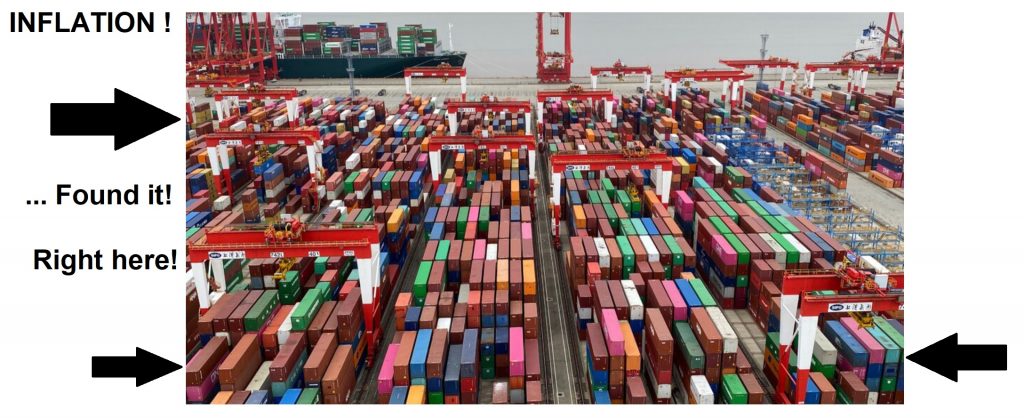
Look no further … it’s right here.
Blame Covid. According to Drewry (see below), the cost of shipping a 40-foot container from Shanghai to Los Angeles is up 236% in just one year. And this is just the beginning of the problem.
“
Inflation is here. Look closely.“
“Inflation is here. Look closely.“
In addition to shipping cost increases, bottlenecks at key shipping ports have skyrocketed. The global supply chain, already reeling from Covid body blows, took another gut punch when China “indefinitely” suspended operations at their Meishan terminal in the Port of Ningbo-Zhoushan. The herky-jerky nature of the port back-ups and closures has triggered numerous logistic chokepoints throughout the chain. When combined with logistics challenges from diminished rail capacity, longer truck turn-times, increased “dwell” times for both containers and truck chassis, longshore worker shortages, insufficient industrial warehouse “storage” space, AND shipping container cost increases, have all globbed together into a huge, global mess. Yes, “globbed” is a word. I just made it up. 🙂
Welcome to 2021 consumer inflation. Look no further.
Welcome to this week’s Steak House Index update.
If you are new to my blog, or you need a refresher on the SHI10, or its objective and methodology, I suggest you open and read the original BLOG: https://www.steakhouseindex.com/move-over-big-mac-index-here-comes-the-steak-house-index/
Why You Should Care: The US economy and US dollar are the bedrock of the world’s economy.
But is the US economy expanding or contracting?
The short answer? Expanding. By a staggering measure. In fact, during Q1 and Q2, annualized 2021 ‘real’ growth averaged about 6.4%. In nominal terms, our US economy averaged almost 12% growth — adding $1.245 trillion of economic activity during the first half of the year. Forever more, COVID-19 will be mentioned concurrently with any discussion about 2020 GDP. Collectively, the world’s annual GDP was about $85 trillion by the end of 2020. But I am confident all 2021 GDP discussions will start with a nod to the blowout 1st quarter GDP growth number, because our ‘current dollar’ GDP grew at the annual rate of 10.7%! Annualized, America’s GDP blew past $22 trillion during the quarter, settling in at $22.72 trillion. The US, the euro zone, and China continue to generate about 70% of the global economic output.
The objective of this blog is singular.
It attempts to predict the direction of our GDP ahead of official economic releases. Historically, ‘personal consumption expenditures,’ or PCE, has been the largest component of US GDP growth — typically about 2/3 of all GDP growth. In fact, the majority of all GDP increases (or declines) usually results from (increases or decreases in) consumer spending. Consumer spending is clearly a critical financial metric. In all likelihood, the most important financial metric. The Steak House Index focuses right here … on the “consumer spending” metric. I intend the SHI10 is to be predictive, anticipating where the economy is going – not where it’s been.
Taking action: Keep up with this weekly BLOG update. Not only will we cover the SHI and SHI10, but we’ll explore related items of economic importance.
If the SHI10 index moves appreciably -– either showing massive improvement or significant declines –- indicating growing economic strength or a potential recession, we’ll discuss possible actions at that time.
The Blog:
The global supply chain is a mess. A huge mess.
The FED continues to assure us today’s consumer inflation is transitory. I believe they are correct. Inflation IS here … but its two (2) primary root causes are NOT permanent, persistent or repetitive. No, they are circumstantial and they will eventually stop.
I’m talking about piles of money and broken chains.
When you combine the serpentine ebbs and flows of the pandemic, an extra $10 or so trillion of potential consumer spending, and a totally mucked-up global supply chain, price spikes are inevitable. Remember: Essentially this whole mess boils down to the old “supply vs. demand” paradigm. Those trillions of dollars have powered consumer (product and services) demand. Covid fits and starts have tempered both demand and consumer confidence. And supply chains disruptions have made product availability and delivery to the final user unpredictable.
Its a mess.
Not only is the cost of shipping “stuff” from one place to another WAY UP, but supply chain disruptions have rendered even the simple making of that “stuff” far more difficult. In a world where “just in time” (JIT) inventory management had become commonplace, the inability to procure manufacturing components when needed is a massive problem … creating ripple effects through the entire global economy.
The ocean-shipping of “stuff” is now extremely expensive, by historic standards:
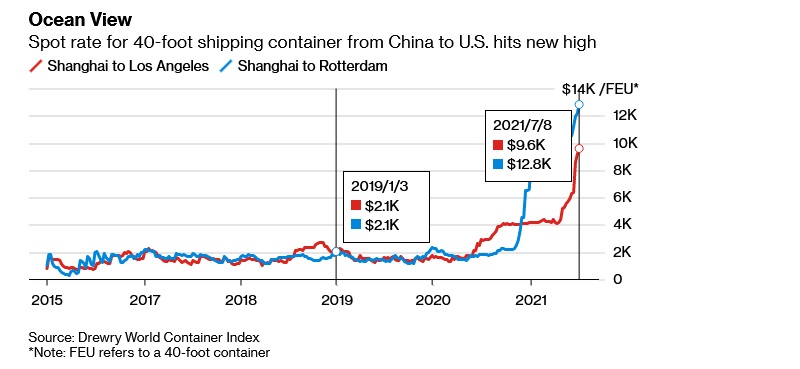
For more on this topic, go to the source:
Remember, everything we eat, wear, live in, or “drive” has to be made. Cars are a great example. Consider this commentary from a Toyota website for kids:
“A single car has about 30,000 parts, counting every part down to the smallest screws. Some of these parts are made at Toyota, but we also have lots of suppliers that make many of these parts. The 30,000 or so parts use different raw materials and different manufacturing processes. Making good parts requires a lot of research and development. Having the parts made by companies that have expertise in their own fields allows us to obtain high-quality parts. Toyota’s suppliers make seats, wheels, steering wheels, windshields, headlights, and meters, for example.
Toyota uses a system in which the necessary parts are made in the needed amounts at the right times. A card called a “kanban” is attached to each parts box and describes the types and quantity of parts needed. This card also prevents the parts factories from making too many parts and the assembly process from having to allocate space to store parts that are not immediately needed.”
Enter the “chip shortage.” Because Toyota cannot get their hands on sufficient microchips, they now plan to reduce September vehicle production by 40% — from 900,000 cars to only 540,000. The ripple effects from this choice will definitely impact the price you pay for a new Toyota — and other cars, too — later this year.
Aluminum is another important component in car manufacturing. The good news is there is enough aluminum to go around globally.
But here is the bad news: Much of the metal is parked in Asia. Buyers in the U.S. and Europe have struggled to get their hands on it. Because the ports of Los Angeles and Long Beach are jammed with a crush of orders from companies hustling to restock inventories and prepare for the holiday shopping sprees.
Today’s Wall Street Journal reported, “Manufacturers are stacking up unfinished goods on factory floors and parking incomplete vehicles in airport parking lots while waiting for missing parts, made scarce by supply-chain problems.”
I could go on … and on … and on. But you get the point. The chain is broken. For now. In time, it will be fixed. But in the interim, expect to see prices spike in some finished goods.
The consumer price index (CPI), published by the Bureau of Labor Statistics, is designed to reflect precisely these price changes. From the BLS website:
The CPI reflects spending patterns for each of two population groups: all urban consumers and urban wage earners and clerical workers. The all urban consumer group represents about 93 percent of the total U.S. population. It is based on the expenditures of almost all residents of urban or metropolitan areas, including professionals, the self-employed, the unemployed, and retired people, as well as urban wage earners and clerical workers.
Thus, the CPI will pick up spikes as they occur. However, they do not comment on causation … simply the outcome. And then we see headlines like:
“Over the 12 months ended July 2021, the Consumer Price Index for All Urban Consumers increased 5.4 percent.”
By any measure, a 5.4% one-year increase is far above the 2% annual ‘target’ rate. Clearly, both the increased buying power and shortages have already impacted consumer prices in the US. Here are the latest numbers, from July:
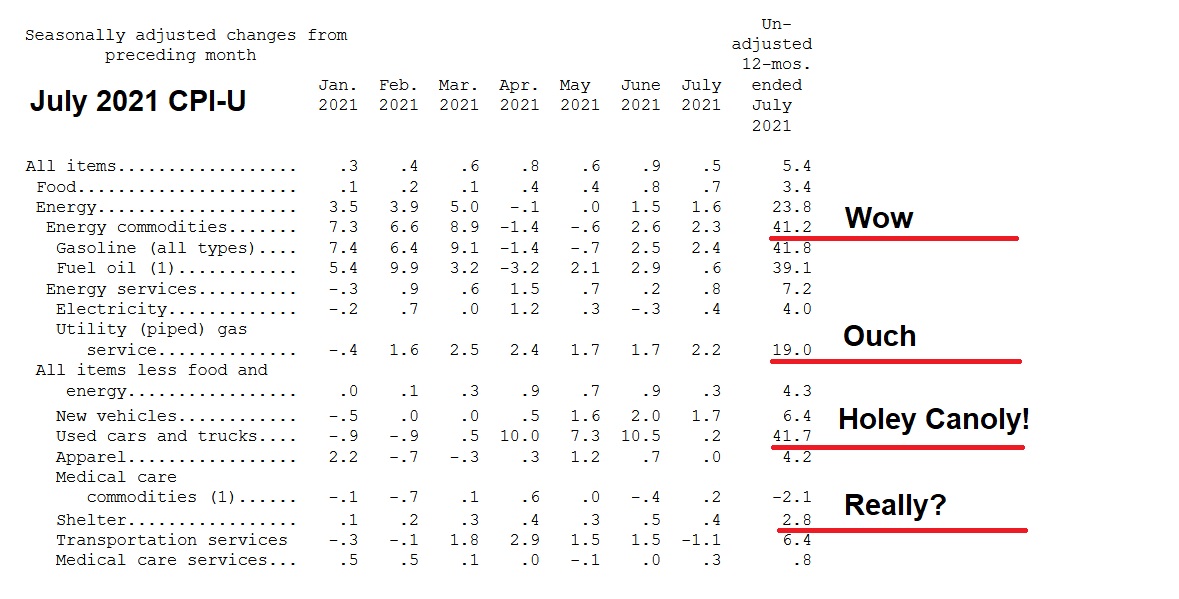
Energy costs are up … and used car prices are up by a staggering amount, year-over-year. New car prices are sure to rise in the near future.
And yet, with the crazy housing market across the country, “Shelter” cost price increases are up only 2.8% for the past year. Yes, “shelter” is housing. Not the cost of a home, mind you. But the cost of living in a home. It’s complex … but essentially the CPI does not account for asset-price inflation, only the cost of using that asset. When measuring changes in “shelter” prices, the CPI focuses on two components: First, a thing called “Rent of primary residence”, and second on “Owners’ equivalent rent of residences.” Whether we like it or not, the methodology of the CPI only focuses on the cost of living in a home … not the value increases were seeing in homes across the country. The increase in the underlying asset value is not captured by the CPI. However, about 1/3 of the CPI is the cost of shelter.
The bottom line: It’s a mess. But it is temporary — or as the FED calls it, ‘transitory.’ We can blame Covid. Covid is why Washington decided to hand out piles of money. It is unlikely our government will host another multi-trillion dollar give-away. And once the supply chains are fixed, most price abnormalities should shake out. When they do, consumer price changes should also settle down. No, not at their prior price levels, but at the new plateau attained during the pandemic. You see, the consumer price inflation experienced between the pre- and post-pandemic moments in time will likely stick with us. Prices will be higher. And it’s likely that those price increases will stick. However, future consumer price changes are likely to settle back into traditional, longer-term patters. The FED is hoping that will be at, or near, a 2% annual rate. I believe they are correct.
My opinion aside, it’s worth noting that the American “consumer” is less convinced than the FED — and me — that today’s inflation is transitory. According the the Conference Board, consumers believe inflation will run hot — at 6.8% twelve months from now.
“Consumer confidence retreated in August to its lowest level since February 2021,” said Lynn Franco, Senior Director of Economic Indicators at The Conference Board. “Concerns about the Delta variant—and, to a lesser degree, rising gas and food prices—resulted in a less favorable view of current economic conditions and short-term growth prospects. Spending intentions for homes, autos, and major appliances all cooled somewhat; however, the percentage of consumers intending to take a vacation in the next six months continued to climb. While the resurgence of COVID-19 and inflation concerns have dampened confidence, it is too soon to conclude this decline will result in consumers significantly curtailing their spending in the months ahead.”
So, apparently, it’s a mess. Did I mention this already? 🙂
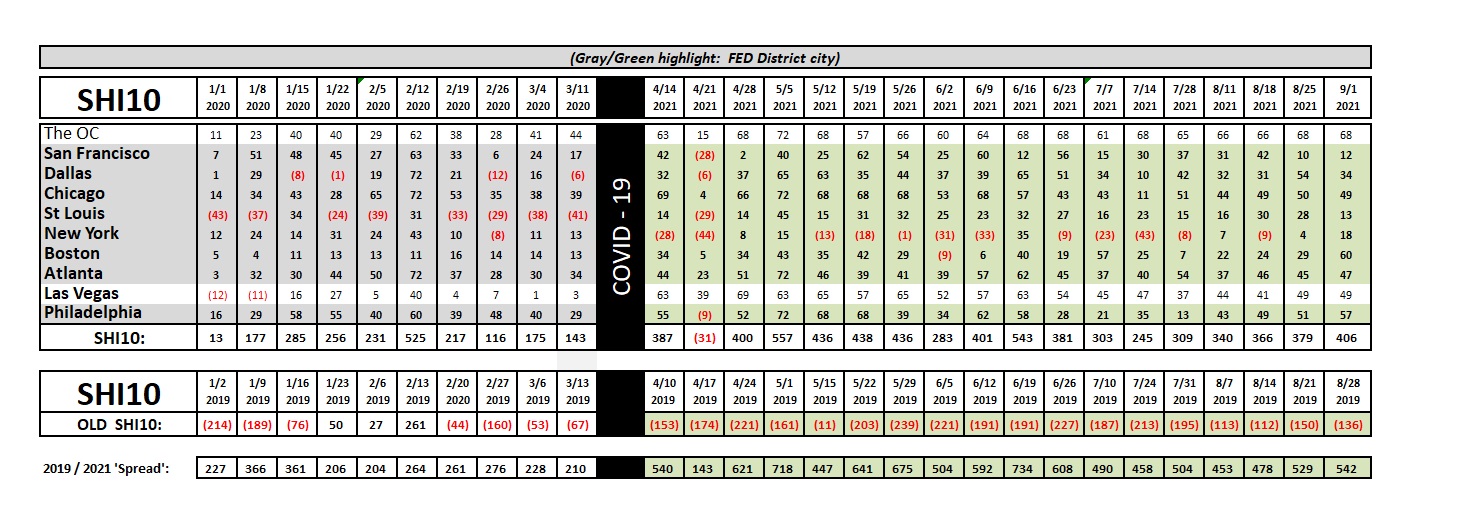
Let’s head to the steakhouses. This is a good week for our opulent eateries. Each of our ten (10) SHI markets is “in the black” … wealthy beef eaters are out in droves this coming Saturday. Even reservations in NYC are in high demand. The grid:
As you can imagine, compiling the data for the weekly SHI10 is time consuming. I have it down to a science, but each week I spend about 20-25 minutes preparing the grid you see above. I could make it easier on myself and simply use the on-line data compiled by Open Table, but their data doesn’t specifically target the most expensive ($$$$) steakhouse restaurants. The SHI10 does.
But they do compile and provide great data for “Seated diners from online, phone, and walk-in reservations” in all restaurants they track. This data, which is both quite current and available globally, by country and by US state and city, also offers an excellent window into the consumer’s desire to get out and about, while facing a pandemic. Again, while it is not the precise data set the SHI10 tracks, it is also a very interesting data set. Below, I’ve compiled the Open Table data for nine of our ten SHI marketplaces (they don’t have an “Orange County”) for the last month. Note that I have “conditionally formated” this data in Excel (red-bad, green-good) and, further, know that this data compares against 2019 data — pre-pandemic — as a baseline. Take a look:
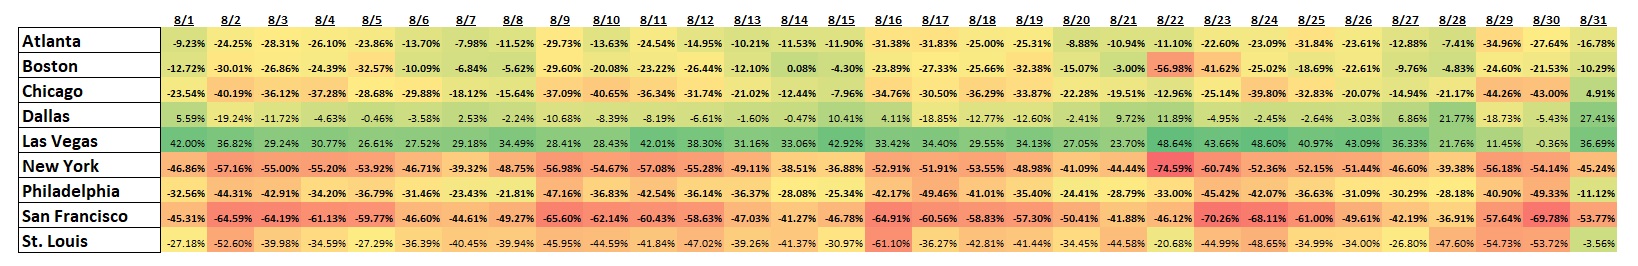
It’s easy to see that all restaurants in New York, Philly, San Francisco and St Louis performed poorly during August of 2021 when compared to August of 2019. The rest is a mixed-bag and Las Vegas, clearly, is on fire. There is no pandemic in Las Vegas — at least, that’s what the Open Table restaurants are telling us!
If you’re interested in the website and raw data, here’s the link. It’s worth a look:
https://www.opentable.com/state-of-industry
Permit me a few final comments on the inflation topic. Inflation is often a very personal thing. Meaning in the final analysis, for many “CPI consumption” items, you control the “buy” or “wait” decision. Timing for some consumption items, of course, are not in your control. Gas, food, electricity, etc. are mostly outside your control. However, when considering a new car purchase, if demand is strong and supply is constrained, triggering large price spikes, you can choose to wait. Sure, you have to drive that old clunker for another year or so, but, hey, that’s better than overpaying for a new clunker. More cars will be produced when the supply chains are fixed. The home purchase decision, on the other hand, is a more complex issue. Will more homes be produced when supply chains are healed? Sure. But new home production is unlikely to catch up with demand anytime in the next decade or two. If you can buy a house, buy one. But I’d wait on the car. My 2 cents. 🙂


