
Is This as Good as it Gets? (Part 1)
Steak Wednesday
April 27, 2016Is This as Good as it Gets? (Part 2)
May 1, 2016This is the first of a 3-part BLOG series. Be sure to “follow” this blog so you are notified when parts 2 and 3 appear!
Why you should care: On Thursday morning, the BEA released this statement:
“Real gross domestic product (the value of the goods and services produced by the nation’s economy less the value of the goods and services used up in production, adjusted for price changes) increased at an annual rate of 0.5 percent in the first quarter of 2016, according to the “advance” estimate released by the Bureau of Economic Analysis.”
GDP growth is highly correlated with wealth creation. If our GDP is static, US wealth – in the aggregate – isn’t growing either. This is not good. If GDP growth doesn’t at least keep up with population growth, the country – by definition – is losing economic vitality.
By long-term historical standards, annual GDP growth of 1/2% is dismal. Even compared to growth post-“Great Recession,” this is definitely sub-par.
Is this as good as it gets? Are we stuck in sub-2% GDP growth? Can we get back to our ‘glory days’ of 3-4% GDP growth – or more … or are those days gone forever?
Taking action: Go see the 2004 movie I, Robot staring Will Smith. And then, start thinking about investing in robotics and automation. Perhaps iRobot…or ABB Robotics…or take a look at the companies on the RBR 50. (Part 3).
OK … I know. Where did this come from? What does this have to with GDP ? Robotics? Well, read all 3 blogs and let me know if you agree with my thoughts.
THE BLOG: What’s wrong with the US economy?
Don’t get me wrong. It’s doing ‘OK.’ But that’s about it. Just OK.
On Thursday morning, the BEA released its first estimate of Q1 GDP. Disappointing to say the least, at only 0.5% annualized growth. This following a 1.4% annualized rate in the 4th quarter of 2015. For all of 2015, GDP grew by 2.4%; in 2014, 2.4%; and in 2013, 1.5%. These are not good numbers. They’re OK numbers…they’re stable, steady…but they’re not good.
Perhaps these lower readings would be more tolerable, even understandable, were it not for the extraordinary efforts of the FED since 2008. (And remember: Even though these extraordinary events may have begun at the FED, every central bank of every developed country/economy did the same thing. In each, massive amounts of liquidity (via purchasing bonds) was injected into the economy; while, at the same time, interest rates were held very close to zero. For years now.)
So we’re back to our question: Why is it so difficult – this time – for the US to equal or exceed previous post-recession GDP growth levels? Even as the FED has been SOOOOOO amazingly accommodating, adding trillions to liquidity and keeping rates near zero?
Following the prior 6 recessions (the gray vertical bars in the image below), even with a much higher FED funds rate, GDP grew quite nicely. Here’s a look at the last 50 years:
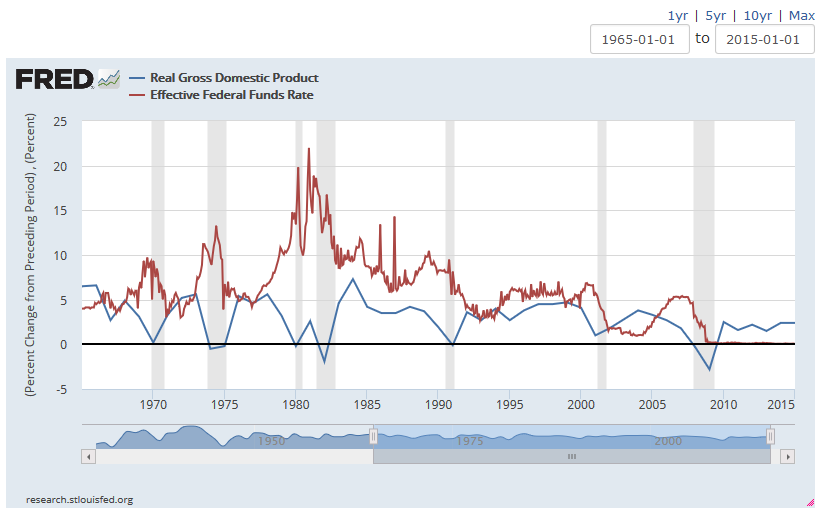
As you can see, this graph, which overlays the ‘real’ GDP growth (as an annual percentage) against the FED funds rate, shows significantly US economic growth even as interest rates were fairly high.
- In the early 1973, GDP growth hit 5.3% even with a FED funds rate over 5%.
- In 1978, GDP hit 5.6% with short term rates at almost 6.8%.
- In 1984 the US GDP grew by 7.3% – a rate that will exceed China’s GDP growth this year! More than China!
But look at the very right-hand side of the above graph. From about 2009 the red line – the FED funds rate – is hovering near zero. (It’s hard to see…almost blending in with the -0- black line.) And yet GDP growth is way below historic levels.
One of the unintended consequences of over 6 years of near-zero federal rates is a world awash in government debt yielding less than zero. Across the globe, we now have over $8 trillion of ‘sovereign debt’ with negative yields:
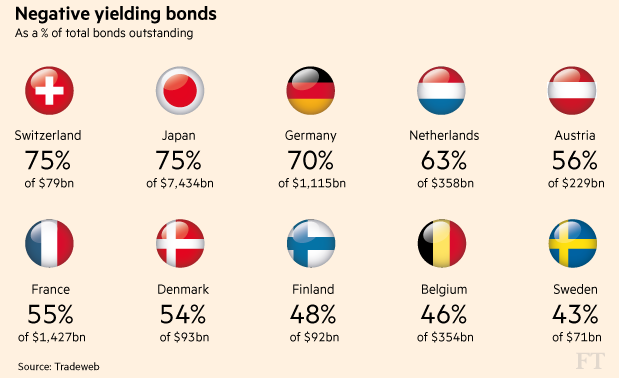
From a historical perspective, these numbers are staggering. This has NEVER happened, for this duration, any time in history. And when I say never, trust me, I mean not once in the past 3,000 years! Not since the concept of ‘interest’ and debt began!
As I’ve asked in previous blogs, what would possess an investor to buy a government bond that loses money annually? Well, maybe it doesn’t…..hmmm……
Here’s a quote from a recent article in the Financial Times of London:
“While many fund managers have shifted into lower quality bonds in the hunt for juicier yields others — including pension and insurance companies required to stick to better quality borrowers — have ploughed into longer-dated bonds in their quest. So far, the strategy has paid off handsomely, with government debt maturing in more than 10 years returning 12.2% this year, outpacing stock markets in the US, Europe and Asia.”
Interesting. Crazy … I find this really concerning … but interesting.
At any other time in US history today’s GDP growth would be considered dismal. Today it seems to be, well, normal. But this low reading is concerning when compared to other historic post-recession growth.
GDP growth post-recession typically reflects a ‘bounce back’ about equal to the inverse of the ‘loss’ of growth during the recession. For example, after each of the 6 recessions (excluding the ‘Great Recession’) of the past 50 years, GDP growth reached levels of 5.6%, 5.6%, 2.6%, 7.3%, 3.6%, and 3.8%, respectively.
But in the 27 quarters since the end of the ‘Great Recession’ of 2008, US GDP growth has been fairly moribund. Here’s a great graphic from the Wall Street Journal:

The eight columns are the 8 components that make up our GDP. The sum total is GDP result for that quarter. Take a close look…see how each of the 8 components rank and compare in each of the 27 quarters. A great visual.
Which, when set against the current interest rate environment makes the issue even more challenging, more puzzling, more concerning. Because the FED feels pressure to raise rates … seeking to ‘normalize’ yields … an equilibrium of sorts that permits the US economy to achieve both its goals (inflation at 2% and full employment.) But raising rates has a diminutive effect on GDP. With the economy growing this slowly, the FED really can’t take action that would reduce GDP growth. Not from these low levels.
Here’s the question, and the concern: If they can’t achieve these objectives when rates are effectively zero, what will happen if rates rise to the levels they’re forecasting for 2017 and beyond?
It’s this reality, I contend, that has kept – and will continue to keep – interest rates at current levels. But why? What’s different today? Why is GDP growth so muted?
I contend it’s the result of a structural change in our economy. This time is different. Our country is different. (Please know this is not intended as a social or political commentary; what follows are observations without any intent to suggest the changes are good or bad. Conditions are simply different.)
Our country has evolved over time, without intent or objective. Today, our country is far different than 50 or 100 years ago.
Today, we find ourselves in a unique place, rooted in, and caused by, two unexpected long-term structural, foundational changes: The first, a radical demographic change. The second, a fundamental change in relationship between labor and output.
That’s enough for today. We’ll pick up here when we begin part 2. Stay tuned!
- Terry Liebman


0 Comments
[…] ← Is This as Good as it Gets? (Part 1) […]
[…] Be sure to read Part 1 of this series: https://terryliebman.wordpress.com/2016/04/30/is-this-as-good-as-it-gets-part-1/ […]