
It’s Hard to Buy a House!
Wednesday Again? Great!
March 23, 2016It’s Easy to Buy a House – in China
March 26, 2016
Obstacles abound! But it’s worth the effort!
Consider Palo Alto, the home of Stanford University and billionaire technology gurus: CBS reported the city council has voted to study a proposal to consider subsidizing new housing in the city for ‘middle-class’ residents making between $150,000 and $250,000 per year. Middle-class? Earning $250,000 a year? Hmmm…someone better tell Bernie Sanders.
Well, of course Palo Alto – and San Francisco in its entirety – is unique. Location matters. Always. And location is highly correlated with value.
But in the macro, home prices are definitely moving up again. Of course, on the flip side, affordability is slipping and first-time homebuyers are feeling the pinch. But existing homeowers have something to cheer about!
On March 10th, BloombergBusiness published an article entitled, ‘Americans’ Home Wealth Recovers $7 Trillion as Prices Firm’. $7 trillion? Wow.
The graph below tells an amazing story. The line tracks the collective value of ALL homeowner equity – for all homes in the US.
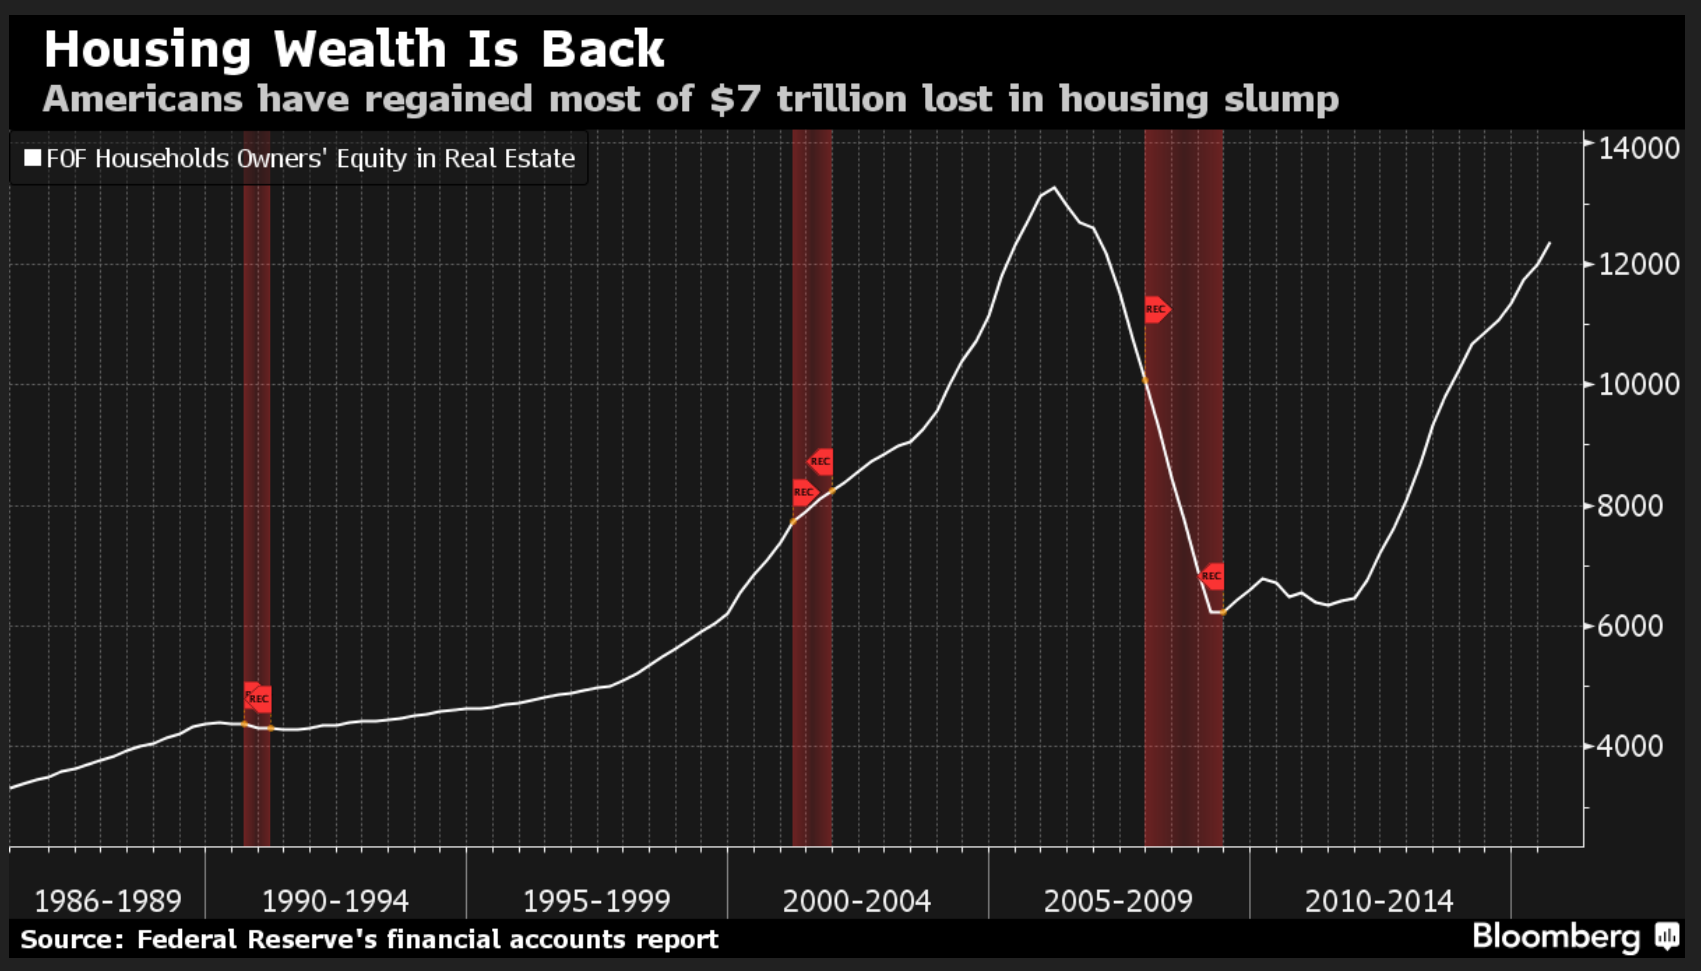
As promised by Bloomberg, yes, it looks like almost all the US home equity lost by the ‘Great Recession’ has been recovered. (This data is sourced at the Federal Reserve from the ‘FRB Z.1 Release – Financial Accounts of the United States’.) Pretty impressive.
And the value increases continue. But not without challenges – there are always a few.
On February 10th, the National Association of Realtors (NAR) posted a press release with this headline: ‘Metro Home Prices Accelerate in the Fourth Quarter of 2015’. In that release, Lawrence Yun, the NAR chief economist, commented, “Even with slightly cooling demand, the unshakeable trend of inadequate supply in relation to the overall pool of prospective buyers inflicted upward pressure on home prices in several metro areas. As a result, homeownership continues to be out of reach for a number of qualified buyers in the top job producing, but costliest, parts of the country – especially on the West Coast and parts of the South.” Interesting. ‘Inadequate supply’ is the root of the problem.
Per the NAR news release: “The national median existing single-family home price in the fourth quarter was $222,700, up 6.9% from the fourth quarter of 2014 ($208,400). The median price during the third quarter of 2015 increased 5.4 percent from the third quarter of 2014.”
On March 20th the Wall Street Journal (WSJ) reported it’s no easier for existing homeowers. Apparently, ‘trading up’ is equally difficult. Per an analysis by Trulia, for-sale inventory is apparently to once again blame: Fewer mid-range or “trade-up homes” came onto the market over the past four years in metro areas where prices of high-end homes shot up the most.
“People may be in a good spot to sell their homes, but if they can’t find another home to buy they’re going to be more likely to stay put,” said Ralph McLaughlin, chief economist at Trulia. “It’s really a gridlock, a traffic jam that’s playing out in the housing market.” Makes sense: existing homeowners are unlikely to sell their current home if the ‘next rung’ – so to speak – is out of reach. The result is a lower inventory of such homes, reduced sale activity and higher prices. ‘Supply’ and ‘demand’ are clearly at play. With a constant or growing demand, a lower supply will force up prices.
Trulia divides the entire stock of resale housing in a metropolitan area into three tiers: starter, trade-up and premium.
The WSJ article reported: “Starter homes are defined as those in the bottom third of the distribution, with a median national price of $154,156, while trade-up homes have a median price of $267,845 and premium homes are priced at a median of $542,805. Among the top 100 metro areas across the country, the study found a high correlation between the lower inventory of midrange homes and the price gap between trade-up homes and premium homes.
For example, in Orange County, Calif., the price difference between a median trade-up and premium home in early 2012 was $421,938. That gap jumped to $664,000 by this year—a 57% increase. The inventory of trade-up homes in the area fell by nearly 70% over the last four years.”
Wow. Check out this graphic:

The folks owning ‘Starter Homes’ and ‘Trade-up’ homes are clearly staying put. The stats per Trulia: “Across the U.S., the inventory of starter homes has decreased the most—by 43.6%—over the last four years, followed by trade-up homes, at 41%, and premium homes at 33.4%.”
If this trend continues, we can expect ‘starter home’ prices to continue to increase at a rate exceeding the ‘average’ housing appreciation rate, and US housing affordability to drop further.
What might cause this dynamic to change? Ultimately, this is a supply/demand issue. Absent a serious US economic slowdown (unexpected recession) which could reduce demand, it’s unlikely to change anytime soon. Values and home equity should continue to grow.
But we have to keep our eyes wide open. In my next post, we’ll discuss a potential threat.
- Terry Liebman


0 Comments
if you track your graph from 1986 to 2016, ignoring the recession and recovery spikes, the value has increased about 6% over the 30 years……the traditional average increase. But what about wages? my understanding is that they have not kept up for the lower the middle class, It makes sense that the premium homes values are rising, as the affluent have seen recovery in the market and are able to pay?
Bill: According to “FRED” at the Federal Reserve Bank of St. Louis, in 1986 ‘median household income’ was $24,897. In January of 2014 – sorry, that’s as current as they have on file – was $53,657. An increase of 155%. If the 1986 reading had compounded at 6%, the increase would be 474%. Clearly, median household income has not kept up with home value increases.
so then is real estate overvalued because it has lost it tether to affordability?
While household income and home values, in the macro, are somewhat correlated, income is only one of the components that drive home affordability. Interest rates are another…and we have all seen the dramatic drop in rates over the past 10 years. As a result, nationwide affordability has (until recently) remained strong. Today, I would say home values are tethered to interest rates, more than household income. If rates were to rise significantly AND quickly, home values would be adversely affected.