
SHI 06 . 24 . 25 – The USA vs. The World

SHI 6.17.26 — The New Federal Reserve
June 17, 2026
“The bigger they are, the harder they fall” …
… is an oft-uttered quip I hear about how the US is losing its grip as the global economic leader. You’ve probably heard or read that foreign governments hold fewer US Treasuries than in the past. And many in the media wring their hands over the demise of the US dollar, suggesting it, too, is being supplanted by foreign alternatives?
But is this true? Is America slipping? Is the dollar in danger of losing its role as the global reserve currency?
“
Let’s talk American exceptionalism.“
“
Let’s talk American exceptionalism.“
I mean, it happens. Currencies can lose their glitter and become less or totally irrelevant on the world stage. It’s happened many times before. Before the USD, the ‘British pound Sterling’ was the de facto global reserve currency. Of course, that changed in 1944, post WWII, as 44 nations decided the USD should take over. Before Sterling, the French ’Livre’ held that lofty designation, and before the French (1700s), the Dutch (1600s), Spanish (1500s) and Portuguese (1400s) currencies had the top job. And in each case, they lost that preeminence.
Is it time for US dollar to slip off this lofty perch and slide into obscurity? This is a common theme in the financial media. Is this a fear of yours, keeping you up at night? Should you be worried? Do the facts support this concern?
Welcome to this week’s Steak House Index update.
If you are new to my blog, or you need a refresher on the SHI10, or its objective and methodology, I suggest you open and read the original BLOG: https://www.steakhouseindex.com/move-over-big-mac-index-here-comes-the-steak-house-index/
Why You Should Care: The US economy and US dollar are the bedrock of the world’s economy. But is the US economy expanding or contracting?
Expanding … according the ‘advanced’ reading just released by the BEA, Q4, 2025 GDP grew — in ‘current-dollar‘ terms — at the annual rate of 5.1%.
The ‘real’ growth rate — the number most often touted in the mainstream media — was 1.40%. In current dollar terms, 2025 US annual economic output reached almost $31.50 trillion.
According to the IMF, the world’s annual GDP will expand to over $126 trillion in 2026. Of that amount, the US makes up over 25% — expected to reach $32.4 trillion by the end of 2026. Further, IMF expects global GDP to reach almost $135 trillion by 2028 — an increase of more than 28% in just 5 years.
America’s GDP remains around 25% of all global GDP. Just four countries—the United States, China, Germany, and Japan—generate roughly half of all economic activity worldwide. Collectively, the US, the European Common Market, and China generate about 70% of the global economic output. These are the 3 big, global players. They bear close scrutiny.
The objective of this blog is singular.
It attempts to predict the direction of our GDP ahead of official economic releases. Historically, ‘personal consumption expenditures,’ or PCE, has been the largest component of US GDP growth — typically about 2/3 of all GDP growth. In fact, the majority of all GDP increases (or declines) usually results from (increases or decreases in) consumer spending. Consumer spending is clearly a critical financial metric. In all likelihood, the most important financial metric. The Steak House Index focuses right here … on the “consumer spending” metric. I intend the SHI10 is to be predictive, anticipating where the economy is going – not where it’s been.
Taking action: Keep up with this weekly BLOG update. Not only will we cover the SHI and SHI10, but we’ll explore “fun” items of economic importance. Hopefully you find the discussion fun, too.
If the SHI10 index moves appreciably -– either showing massive improvement or significant declines –- indicating growing economic strength or a potential recession, we’ll discuss possible actions at that time.
The Blog:
In a word, no.
One of the best economists/analysts I read is Michael Cembalest. Michael is the ‘Chairman of Market and Investment Strategy’ for J.P. Morgan. For good reason, he’s held that role for decades. Michael and his team produce some amazing data, charts and analysis. His latest report, 44 pages chock full of data, is exceptional. Called ‘Semiquincententacles,’ you can read the entire report HERE if you wish.
I will highlights some of his topics in this blog post.
First, is the dollar losing its grip in global finance as many in the financial press are reporting? Is the US dollar in danger of losing its “reserve currency” status?
No. In fact, the position of the US dollar is quite stable. Here is a chart from JP Morgan. As you know, they are one of the largest commercial banks in the world. As such, they have exceptional visibility into global capital flows and the resulting metrics:
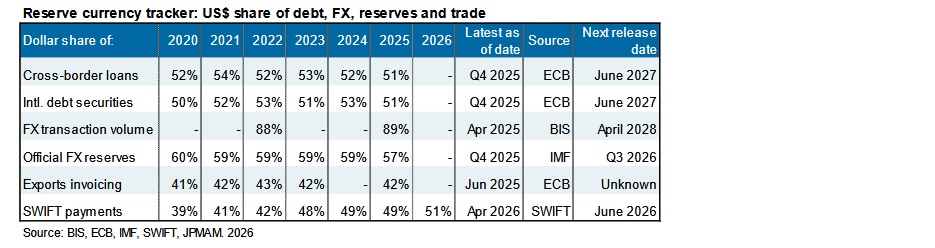
The metrics are surprisingly stable. And the SWIFT payment percentage is up significantly from 5-years ago. Essentially, SWIFT is the global messaging network banks use to move money around the world. While it is located in Belgium, about 50% of all SWIFT ‘messages’ involve the US dollar.
An “FX transaction” is the buying or selling of a currency to power a cross-border transaction. A local currency usually loses its status as a “legal tender” when it exits the country. Imagine Walmart buying clothing for import from a vendor in Vietnam. They want to transact in dollars. The same is true if a Japanese company buys a new Boeing jet; they convert the Yen into dollars as the currency to power the transaction. Today, globally, 89% of these transactions are completed in the US dollar. That number was about 90% at the turn of the century. Almost identical for decades.
Another common media theme talks about the declining foreign ownership of US Treasury debt. This decline, the story goes, indicates a loss of confidence in America.
It is factually true that foreign ownership of US debt peaked in 2008 at 56.5%. Foreign ownership as a percentage of outstanding Treasury debt bottomed out in 2022. Since then, it’s been rising – very slightly, but rising nonetheless – since that time.
The meaningful metric here is the “debt held by the public.” This is the measure of US debt securities traded in credit markets. Today, that number is $31.60 trillion. These are marketable U.S. Treasury securities that can be easily bought and sold. Investors in the US and abroad include official institutions, such as the U.S. Federal Reserve and foreign central banks; financial institutions, such as commercial banks; and private individual investors.
I believe the decline can be better explained thru the lens of “supply” and not demand. In 2008, the total debt held by the public was $5.8 trillion. Today that number is more than 5X that size.
So while foreign ownership has definitely declined from over 56% to about 30% today, foreign investors still own nearly $10 trillion of U.S. Treasuries today – about 3X what they owned in 2008. The percentage has shrunk because the denominator exploded, not because foreign demand is weak. This is an important distinction.
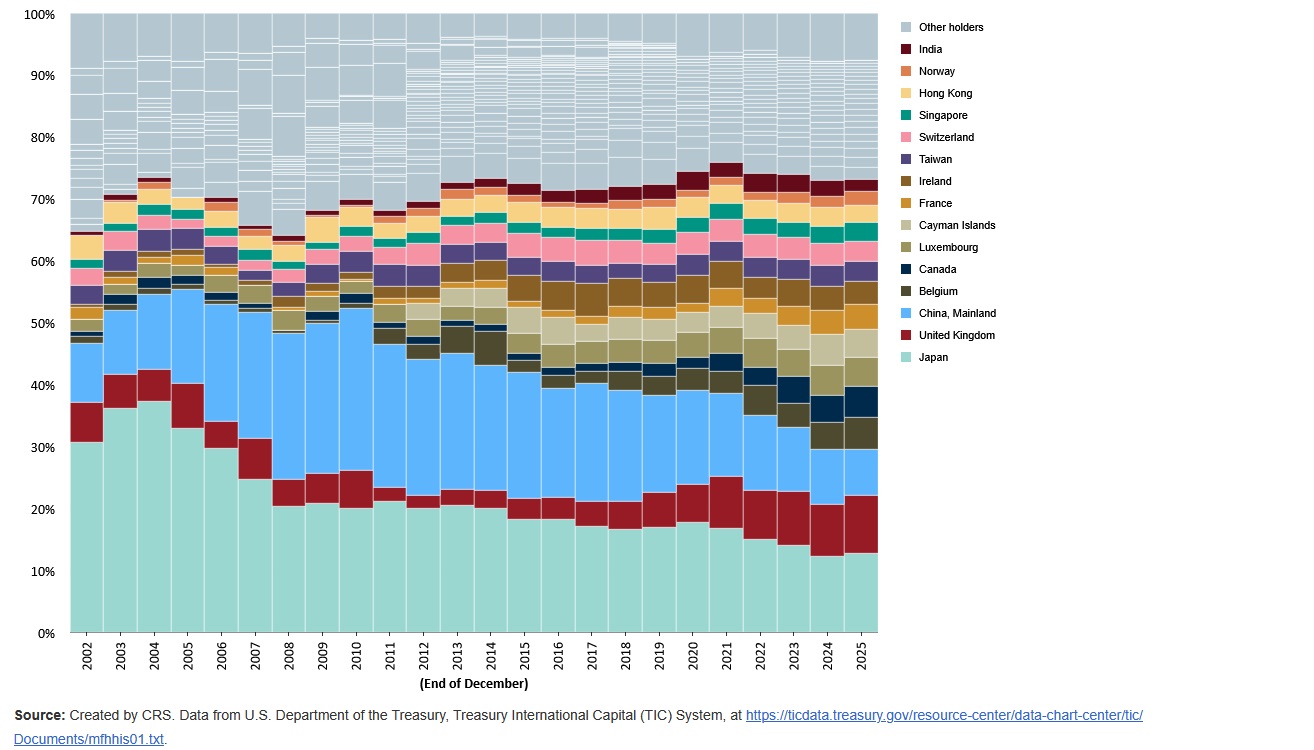
It is factually accurate that China and Japan have reduced their holdings over the last couple of decades:
Why? The reasons differ.
Japan has been struggling to fund their “support the Yen” program. For a variety of reasons, for quite a while now Japan’s currency has been weakening against the US dollar and others. Japan would like to stop – or even better, reverse – the continuing devaluation of their currency . However, underpinning the yen is expensive. To do so, Japan must intervene into the FX market, selling the US Treasuries they bought for reserves over the years, and buying the Japanese yen. As a result, clearly, their Treasury balance has declined.
The China Story is different. China has a massive annual trade surplus. For years, and again for a number of reasons, China used much of that surplus to buy US Treasuries. At one time, China held over $1.3 trillion of US Treasuries – about 11% of all outstanding treasury debt. Today, they own far less. In fact, by the end of 2025, they held only about 2.5% of all outstanding treasury debt, for a dollar balance of about $770 billion. What is China using the sale proceeds to buy? They are diversifying. They have bought stuff like euro assets, invested in domestic infrastructure, and expanded sovereign wealth investments.
The bottom line here is this: The foundational financial pillars of US dollar hegemony remain consistent and robust. Sure, Treasury debt and capital flows ebb and flow around the globe, often changing, but in the aggregate, the USD and Treasury debt retain their strong grip on the global financial markets. These are the irrefutable facts.
The same media pessimism shows up in another popular financial narrative. We often hear the U.S. stock market has become dangerously concentrated. The narratitive is fairly consistent: They fear this concentration, and other equally troubling warning signs, set the stage for a market crash.
Like with most stories, some aspects of the media reports are true. I’ll give them that. But here at the SteakHouse Index, we work hard to separate the wheat from the chafe. Global financial data tell a far more nuanced story.
I’m sure you have heard how the “Magnificent Seven” dominates the S&P 500 with a collective market concentration so high, the danger to our financial system is uniquely high. And in some respects that is true. After all, the “weight” of these 7 companies within the S&P500 is about 35%. Meaning, of course, that the market weight of the remaining 493 companies is 65%.
And if we talk “top 10” to gain historic perspective, the number is closer to 40%. Historically, this is unique in the US financial markets. This type of concentration has never happened before – in the entire 120+ year history of these markets. It’s easy to argue that this concentration is excessive. For context, consider that about 10 years ago, the 10 largest US stocks represented 17% of S&P 500 market cap; that level was also common during the 1990s. These, again, are irrefutable facts.
But here’s something that might surprise you: This 40% concentration of the top-10 companies in our S&P500 is almost the lowest equity concentration figure when compared to all other world financial markets. Are you surprised? I certainly was.
To put US equity market concentration in a global context, if we widen the lens and compare the US to other financial markets around the globe, we learn the US has the 3rd lowest concentration across all global markets. Again, here’s a great chart from Michael Cembalest and his JP Morgan team of economists and data scientists:
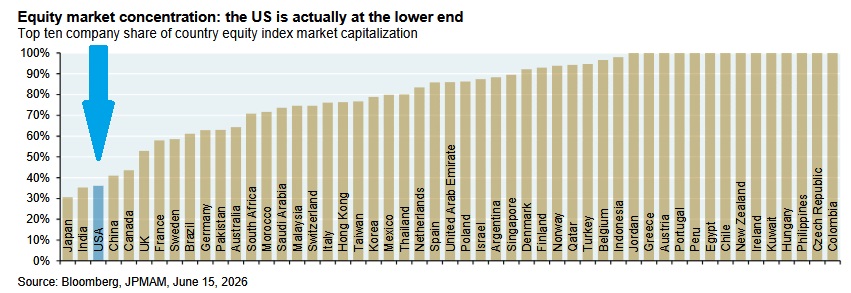
In fourteen of the country stock markets in the chart above, ten companies make up the entire market. That’s a 100% concentration folks. This is true in Jordan, Greece, Austria, Ireland, Colombia, and the Czech Republic. If you invest in those markets, you aren’t buying a diversified slice of their economy; you are buying a tiny sliver of businesses.
The concentration of the top 10 is much higher in the UK, France and the Netherlands. In the UK, the number is over 50%; in France, near 60%. And in Netherlands, it’s above 80% — essentially ASML is the Dutch market.
It’s pretty clear to anyone paying attention that the US economy and the nature of the US stock market concentration has changed dramatically with the rise of the Mag 7 and ChatGPT. Things are changing fast; conditions are turbulent.
In the report, Cembalest does point out the heavy aggregate concentration in what he calls the “AI value-chain concentration.” Sure, the top-10 may concentrate 40% of the total stock market, but companies and related enterprises supporting the hyperscaler business plans probably total more than an additional 20% of the total stock market.
Thru this lens, it would be impossible to argue the US markets are not heavily concentrated in a single technological shift. So while the multi-trillion dollar valuations of Apple, Microsoft, NVIDIA, Amazon, Alphabet, and Meta – and now SpaceX – are definitely concerning, in counterbalance, the considerable size, depth, and breadth of the US economy is substantial. It’s worth noting that the other 490 companies in the S&P 500 include massive companies in healthcare, finance, industrials, and retail that would be the single-largest company in almost any other country or stock market on Earth. Pretty amazing.
To the steakhouses?
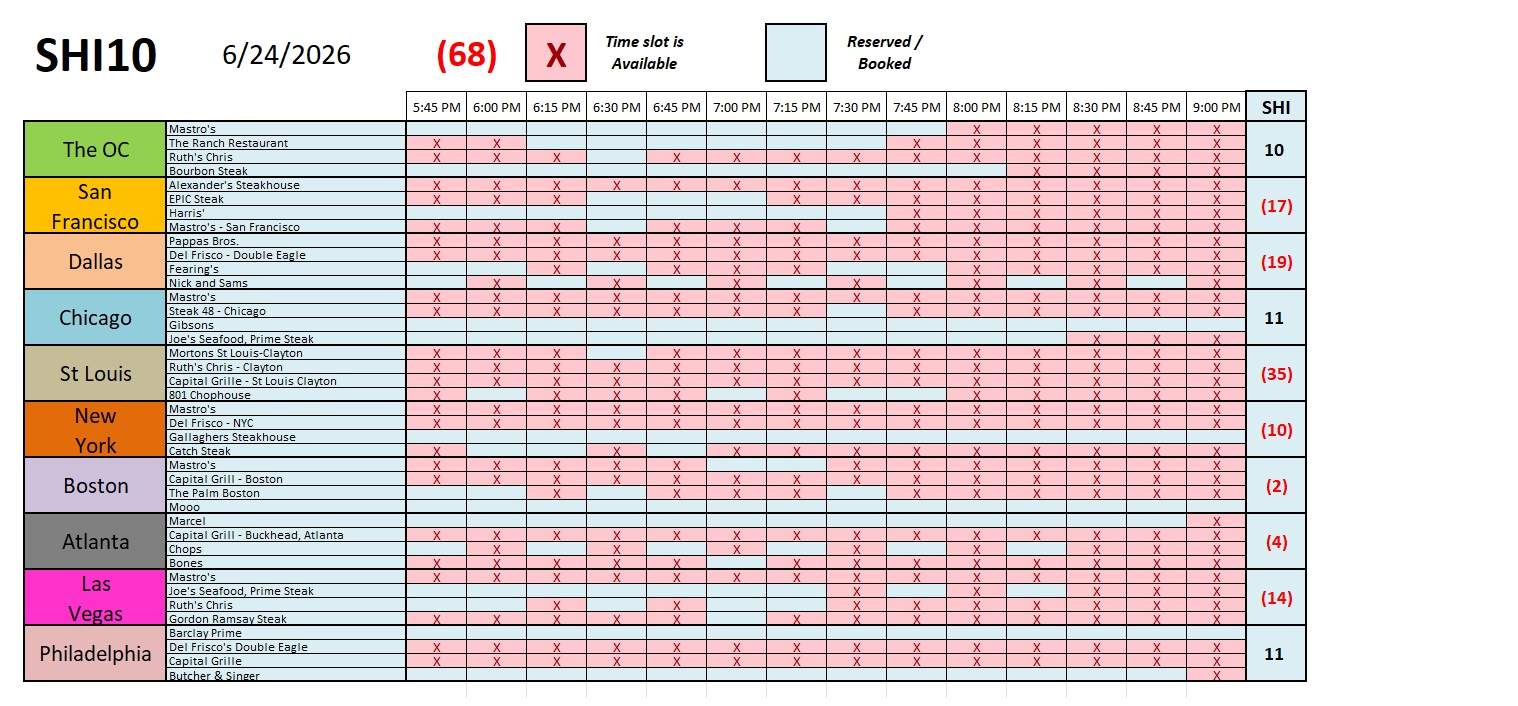
This week’s SHI10 reading is down to a negative (68). A single reading isn’t overly meaningful. But this is a sea of red. Looking at the charts above and below, it’s hard to see anything other than red. In fact, only three markets — the OC, Chicago, and Philly — are in the black this week. Does this concern me? Yes, a bit. It’s odd.
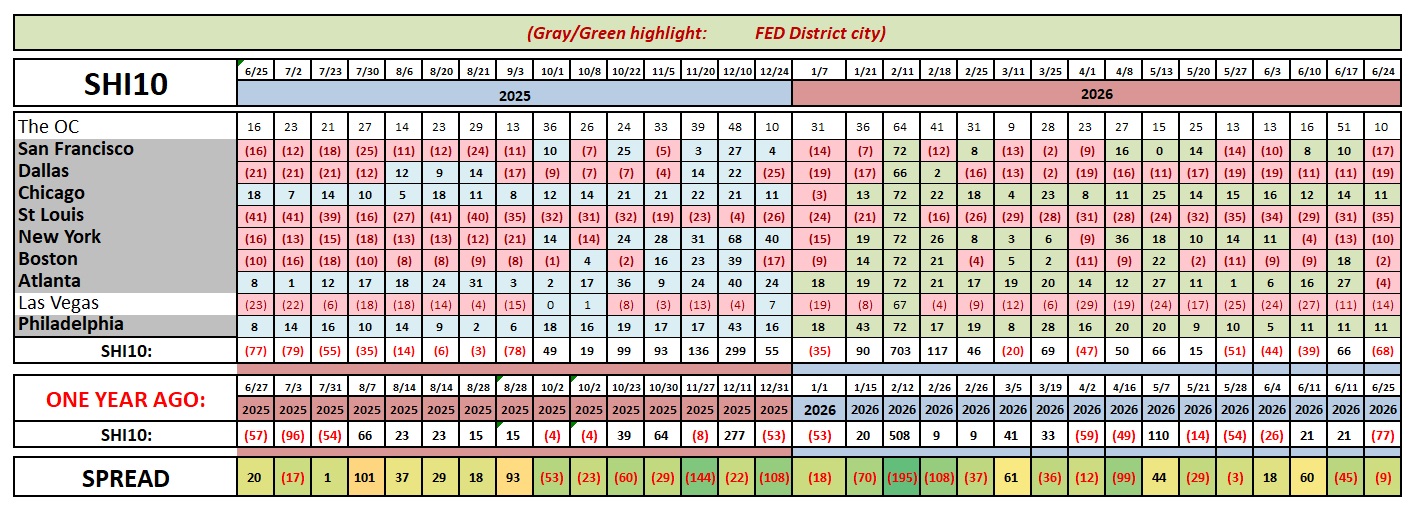
After all, we have an exceptionally strong economy, over all. GDP growth is strong and likely rising. Anecdotal evidence suggests American productivity is also rising meaningfully. Yet, against this backdrop our expensive eateries seem to be struggling more and more each week to find diners.
Could it be these extremely costly restaurants are finally pricing themselves out? Maybe. Perhaps that’s what the chart below, again courtesy of Cembalest and JPM, suggest:
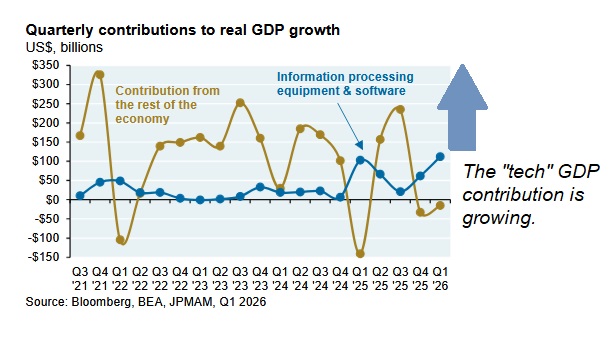
The “line” titled “Contribution from the rest of the economy” is lackluster at best. The vast majority of economic gain for the past three quarters is associated with tech. Not consumer spending.
What’s it all mean? Time will tell. For now, it’s simply data. 🙂
< Terry Liebman >


