
SHI 1.27.2021 – Dickensian Economics

SHI 1.20.2021: Too Big to Fail?
January 20, 2021
SHI 2.3.21: The Irony is Thick
February 3, 2021
“It was the best of times, it was the worst of times,
it was the age of wisdom, it was the age of foolishness, it was the epoch of belief, it was the epoch of incredulity,
it was the season of light, it was the season of darkness, it was the spring of hope, it was the winter of despair.”
– Charles Dickens, “A Tale of Two Cities”
Dickens could have been writing about today’s US economy. During the Covid pandemic, the 10 richest billionaires saw their fortunes increase by over 1/2 a trillion dollars, and about 2.7 million homeowners, unable to make their mortgage payments, are in a forbearance plan with Fannie Mae and Freddie Mac.
The total value of the US stock market rose to just over $50 trillion by the end of 2020, while, according the the US Census Bureau “Household Pulse Survey,” an estimated 17 million adults are behind on rent or mortgage payments, risking an eviction or foreclosure in the near future.
And as Tesla’s Elon Musk earned a 2020 bonus estimated at about $100 billion, the number of employed Americans fell by almost 10 million in the past year.
If asked, how would Dickens respond to the question: Are these the best of times … or the worst of times?
“
It clearly depends on who you ask.“
“It clearly depends on who you ask.“
For these reasons, the FED remains cautious and the Biden administration wants to pass another Covid stimulus bill close to $2 trillion in size.
But thru it all, in the aggregate, our US economy keeps chugging along. The National Bureau of Economic Research (NBER), the agency charged with tracking recession beginnings and ends, has not yet ruled the 2020 recession, which started in February, to be over, but other data suggests economic expansion began again during the 3rd quarter.
The “first estimate” for Q4 2020 GDP will be released tomorrow morning. And if the forecasts are accurate, the results may be surprisingly robust.
Welcome to this week’s Steak House Index update.
If you are new to my blog, or you need a refresher on the SHI10, or its objective and methodology, I suggest you open and read the original BLOG: https://www.steakhouseindex.com/move-over-big-mac-index-here-comes-the-steak-house-index/
Why You Should Care: The US economy and US dollar are the bedrock of the world’s economy.
But is the US economy expanding or contracting?
Before COVID-19, the world’s annual GDP was collectively about $85 trillion. Then it shrank … then bounced back! We can thank global fiscal and monetary policy for the bounce. According the the Q3, 2020 ‘preliminary’ numbers, annual US GDP is back UP to about $21.1 trillion. And still, together, the U.S., the EU and China continue to generate about 70% of the global economic output.
The objective of this blog is singular.
It attempts to predict the direction of our GDP ahead of official economic releases. Historically, ‘personal consumption expenditures,’ or PCE, has been the largest component of US GDP growth — typically about 2/3 of all GDP growth. In fact, the majority of all GDP increases (or declines) usually results from (increases or decreases in) consumer spending. Consumer spending is clearly a critical financial metric. In all likelihood, the most important financial metric. The Steak House Index focuses right here … on the “consumer spending” metric. I intend the SHI10 is to be predictive, anticipating where the economy is going – not where it’s been.
Taking action: Keep up with this weekly BLOG update. Not only will we cover the SHI and SHI10, but we’ll explore related items of economic importance.
If the SHI10 index moves appreciably -– either showing massive improvement or significant declines –- indicating growing economic strength or a potential recession, we’ll discuss possible actions at that time.
The Blog:
It’s a mixed bag right now. Economically speaking.
Many have never done better — they are rolling in the dough. Many more have never been worse off. Consider the employment situation here in the US. According to the latest figures from the US Bureau of Labor Statistics, the number of Americans with a job at the end of 2020 was down to just 132.2 million — a substantial decline from the prior year:
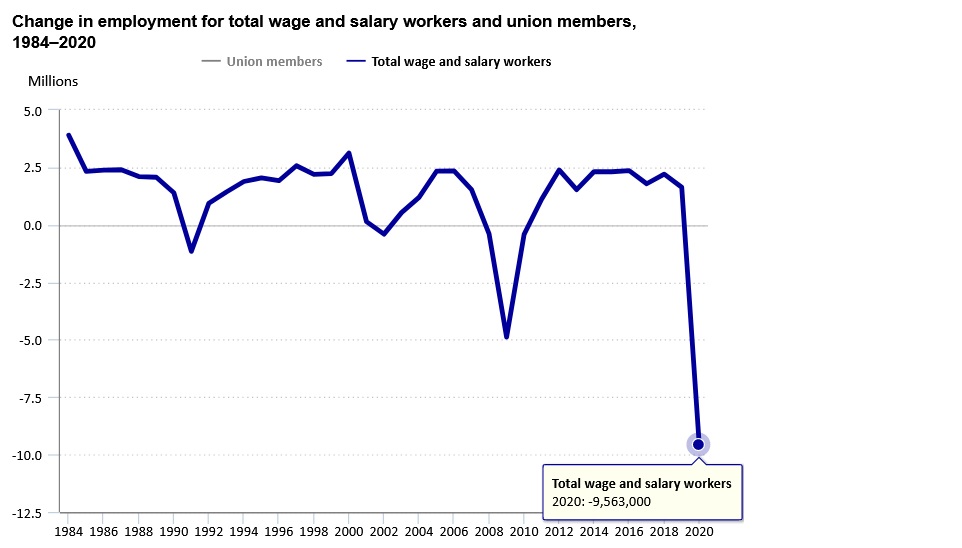
This is not the unemployment rate, a number that tells a meaningful story only when compared with prior U3 readings. No, this is the raw data, the actual number of Americans actively working. Or not working. The almost 9.6 million person decline from the prior year represents a 6.7% reduction in the total labor force. 6.7% of the labor force lost their job in the past year. That number is staggering. Some retired, but for most, their job simply vanished. And for those unfortunate souls, the answer to the question is easy: These are clearly the worst of times.
The chart above covers more than 35 years. Job loss periods have come before, but never to this extent, never before this deep, perhaps with the sole exception of the Great Depression. This is why the FED continues to “ease” monetary policy. This is why the FED continues to buy assets, and now sports a balance sheet of more than $7.4 trillion in total. And this is why the Biden Administration seeks additional fiscal stimulus as soon as possible.
The “haves” and “have nots” story of our Dickensian economy is nothing new. Perhaps today’s chapter is, however. Many say the gap between the two has never been wider and it’s this gap that fuels the ire of the Sanders/Warren group and their fervent push to level the playing field with things like a “wealth tax.” Good idea? Bad idea? Again, it depends on who you ask. But I’ll leave this one for the politicians. I’m only saying I understand what’s driving the debate.
In the final analysis, the US economy, in the aggregate, doesn’t consider, or even care about, the individual experience. Everything is lumped together, the good and the bad, the winners and the losers, and that’s where our GDP numbers come from. Such is capitalism. Such is life in America.
And those numbers are surprisingly good. The chart below offers a good summary –of both the first three (3) quarters in 2020, and a group of estimates for the 4th quarter. Take a look:
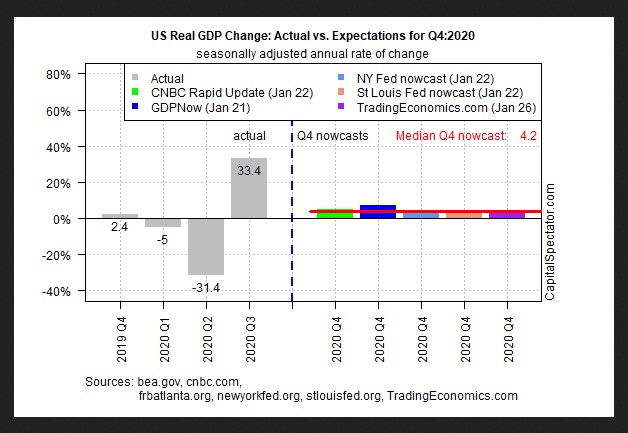
Q2 was clearly a brutal quarter, economically speaking: GDP slid by 31.4%.
But the “V” shaped recovery in Q3 was extremely impressive — GDP grew by 33.4%. Many economists were surprised. Not me. You may recall that I expected it — in fact, if memory serves me correctly, I actually nailed the exact growth percentage in my forecast! But, hey, this blog isn’t about me, right? 🙂
A brief tangent: China experienced a truly spectacular 2020 economic rebound. In fact, they ended the year with the same 5.2% city unemployment rate that they started with. China was one of the few advanced economies where the GDP grew faster than in prior years. But this is another important story for another time … I’ll return to it. For now, let’s go back the the US.
It’s extremely unlikely the first “estimate” for US 4th quarter GDP, released Thursday morning at 5:30am (pacific) will be a repeat of the 3rd quarter numbers. Of course, it could happen, in the same way that a camel could thread the eye of a needle, it’s just that both are extremely unlikely. 🙂
The ‘median’ of the five (5) forecasts above suggests a Q4 growth of 4.2% — a very respectable growth rate. If that proves accurate — and we’ll know on Thursday — then our “aggregate” economic recovery is clearly continuing. In fact, a growth rate this high would be an impressive number even in a year without a pandemic! But to be frank, I don’t expect to see a number that large. My forecast is more in line with the NY FED “nowcast“: They are expecting growth in the 2.5% range … and I tend to agree. I hope I’m low … we’ll see.
Perhaps even more surprising are the 2021 GDP forecasts. The International Monetary Fund expects the US economy to grow 5.1% in 2021, while the FED forecast is a bit more sedate with a lower forecasted growth rate between 3.7% and 5.0%. Keep in mind that for decades our GDP growth has struggled to surpass even 2%.
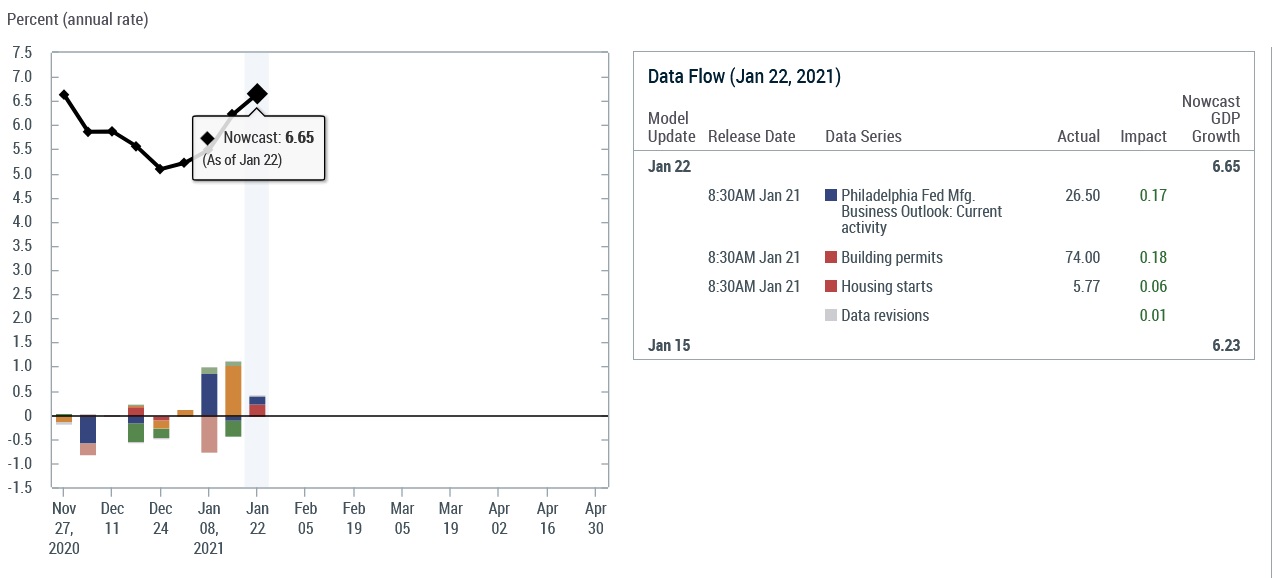
As of January 22, the NY FED was forecasting another very strong first quarter of 2021 at 6.65%. Again, if this forecast comes to pass, the first quarter would post one of the best US GDP growth rates since 2005:
Widening systemic inequity aside, US economic growth appears to be on a tear. GDP growth is strong. Clearly, trillions in US fiscal support and the ever-growing FED balance sheet — now up to more than $7.4 trillion as of the 21st — are helping fuel the fire. There is a lot more money sloshing around the US economy … and other economies around the world. Frankly, as stock market performance is always highly correlated with corporate earnings, it’s no wonder stock holders are being handsomely rewarded.
By the way, it’s worth noting that the “inequity issue” is not unique to the US. In fact, you may be surprised to hear that even China — an admittedly Communist country — has a similar growing inequity problem. According to an article in Economist magazine on January 18th:
“Inequality also seems to have worsened (in China). As in many other countries, 2020 was lucrative for the wealthy. Asset prices soared, thanks in part to the central bank’s loosening of monetary policy. The CSI 300 index, a gauge of China’s biggest stocks, rallied by nearly 30%, while property prices in the country’s main cities rose at their fastest pace since 2017. In recent weeks, buoyed by the strength of the economy and wary about the red-hot markets, the government has gradually started tapering its stimulus.”
Clearly, there are issues to resolve, challenges to overcome. The silver-lining, however, is that a general economic contraction is not one of them. The US economy is once again expanding. And it will continue to do so. In my book, this is a good thing.
- Terry Liebman


