SHI 10.28.26 – Where’s The Beef? (Again)

SHI 10.21.26 – The Tipping Point
October 21, 2026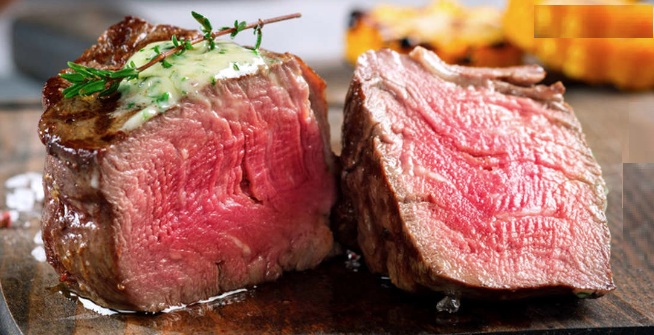
“Where’s the beef?” was a funny quip from a TV commercial.
In 1984, the burger chain ‘Wendy’s’ aired the commercial and the slogan instantly became an iconic American catchphrase. Perhaps it’s not quite as pithy and iconic as “Just Do It” but it has certainly been just as durable. And clearly it is very useful when one writes a blog titled The Steakhouse Index. 🙂
“
Where’s the beef?
Check the steak houses. “
“
Where’s the beef?
Check the steak houses. “
The slogan even found its way into a 1984 presidential debate, with one candidate using the phrase to suggest his opponent’s “new ideas” had no substance. Essentially, it was a “Big hat, no cattle” moment. Pretty funny. Where’s the beef? Indeed.
Is it pure coincidence that George Orwell’s novel, Nineteen Eighty Four, and Apple’s famous Macintosh commercial also connect with 1984? It is not. Clearly, the Apple commercial connects with the dystopian vision in Orwell’s book. However, I don’t recall any talk about beef or hamburgers in Orwell’s book.
But today we’re talking beef. Where’s the beef? Right here, my friends. 🙂
Welcome to this week’s Steak House Index update.
If you are new to my blog, or you need a refresher on the SHI10, or its objective and methodology, I suggest you open and read the original BLOG: https://www.steakhouseindex.com/move-over-big-mac-index-here-comes-the-steak-house-index/
Why You Should Care: The US economy and US dollar are the bedrock of the world’s economy. But is the US economy expanding or contracting?
Expanding … according the ‘advanced’ reading just released by the BEA, Q2, 2026 GDP grew — in ‘current-dollar‘ terms — at the annual rate of 8.0%.
The ‘real’ growth rate — the number most often touted in the mainstream media — was 1.50%. In current dollar terms, during Q2 the annual economic output reached almost $32.50 trillion.
According to the IMF, the world’s annual GDP will expand to over $126 trillion in 2026. Of that amount, the US makes up over 25% — expected to reach $32.4 trillion by the end of 2026. Further, IMF expects global GDP to reach almost $135 trillion by 2028 — an increase of more than 28% in just 5 years.
America’s GDP remains around 25% of all global GDP. Just four countries—the United States, China, Germany, and Japan—generate roughly half of all economic activity worldwide. Collectively, the US, the European Common Market, and China generate about 65% of the global economic output. These are the 3 big, global players. They bear close scrutiny.
The objective of this blog is singular.
It attempts to predict the direction of our GDP ahead of official economic releases. Historically, ‘personal consumption expenditures,’ or PCE, has been the largest component of US GDP growth — typically about 2/3 of all GDP growth. In fact, the majority of all GDP increases (or declines) usually results from (increases or decreases in) consumer spending. Consumer spending is clearly a critical financial metric. In all likelihood, the most important financial metric. The Steak House Index focuses right here … on the “consumer spending” metric. I intend the SHI10 is to be predictive, anticipating where the economy is going – not where it’s been.
Taking action: Keep up with this weekly BLOG update. Not only will we cover the SHI and SHI10, but we’ll explore “fun” items of economic importance. Hopefully you find the discussion fun, too.
If the SHI10 index moves appreciably -– either showing massive improvement or significant declines –- indicating growing economic strength or a potential recession, we’ll discuss possible actions at that time.
The Blog:
A friend asked if restaurant reservations crashed when the dotcom bubble popped back in 2000.
What a great question, I thought. But, of course, I have no idea. The Steakhouse Index – or SHI as it’s become known – was invented about 10 years ago. The dotcom bubble popped more than 25 years ago. Ironically, the company OpenTable – the source of most of my reservation data – was actually born just before the bust. But they were a small local company. I’ve been unable to find any national reservation data from that time period.
I suspect the question was asked specifically for its predictive nature. In other words, I suspect my friend was really asking this:
“Are restaurant reservation levels able to predict when a stock market bubble will pop?”
Now that’s a great question. And if the answer was ‘yes’ I am confident I would have far more than just 6 dedicated SHI readers! After all, if my blog was truly able to accurately predict the direction of the US economy, everyone would read it!
But, alas, I don’t think restaurant reservation demand is bubble predictive. I suspect it would be more bubble reactive. Because a bubble tends pop suddenly, after years of ebbing and flowing. That suddenness suggests restaurant reservations would remain strong thru the bubble pop, and shortly thereafter, as the inverse-wealth effect takes hold, expensive eatery reservations would likely fall off a cliff.
Thru that lens, stable and consistent opulent steakhouse reservation demand likely implies that for the moment the bubble – if in fact a bubble exists – remains fully inflated. Sorry, but restaurant reservation demand isn’t going to help us predict the timing of a popping bubble.
I’m happy that issue is settled. So let’s move on.
Is reservation demand down? Is that why the question was asked?
Nope. Certainly not in 2026. In fact, according to OpenTable, the number of “butts in seats” is still going up, week after week. Take a look at this chart, cut from the restaurant blog on the OpenTable website. We’re comparing restaurant demand in 2026 vs. 2025.
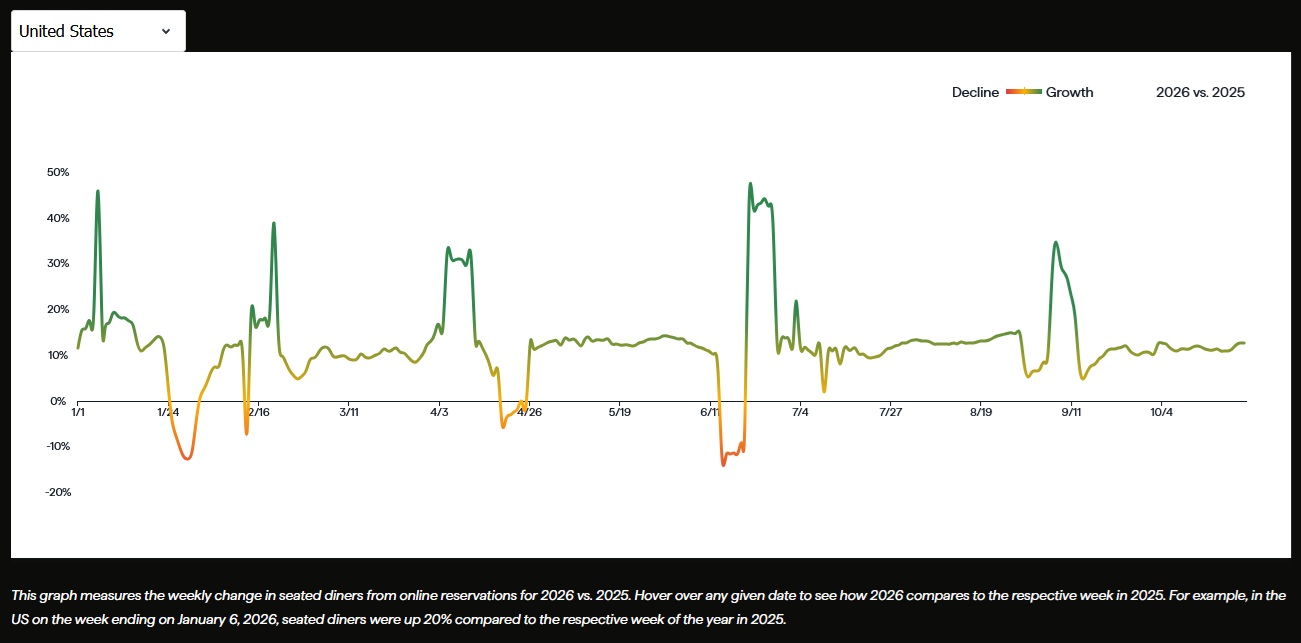
It’s an interesting chart, right? The first thing I noticed was how flat it appears at first glance. But notice where that flat line is: It hovers between 10% and 15% growth in reservation demand over 2025. 2026 demand started strong: In the US on the week ending on January 6, 2026, seated diners were up 20% compared to the respective week of the year in 2025. Other than a few dips during the year, that trend has continued.
But then I noticed that odd shaped dip in early June. And then seemingly a week later, a sizable demand spike. That was odd, I thought. For the week ending June 15, 2026, restaurant demand was 12% lower than that same week in 2025. And for the week ending June 22, 2026, restaurant demand was 43% higher than that same week in 2025. That seemed really odd to me. So I dug in.
OpenTable had the answer for me. At least I think they did. They match weeks by weekday, which means 364 days back, and not by calendar date. And it turns out the culprit was most likely “Father’s Day.” Everyone knows that holiday falls on a Sunday. Father’s Day 2026 (June 21) lines up with an “ordinary” Sunday, June 22, in 2025. And Father’s Day in 2025 — June 15th — aligns with an ordinary Sunday, June 14, in 2026. So first comparison, and the “dip” on the chart, compares a normal 2026 week with a week in 2025 containing Father’s Day. The following week that relationship reverses itself and reservations spike.
But as I look at the data, this comparison explains the direction of reservation demand, but not the size of the increase. The World Cup also began on June 11th, so that may have been a factor as well.
Of course, my observations here could be completely off. It’s hard to know for sure. But one thing we know the chart shows for certain is over all, peaks and valleys ignored for the moment, 2026 restaurant demand is up significantly over 2025. And that, my friends, suggests that consumer spending remains robust and the US economy remains on solid footing.
To the steakhouses!
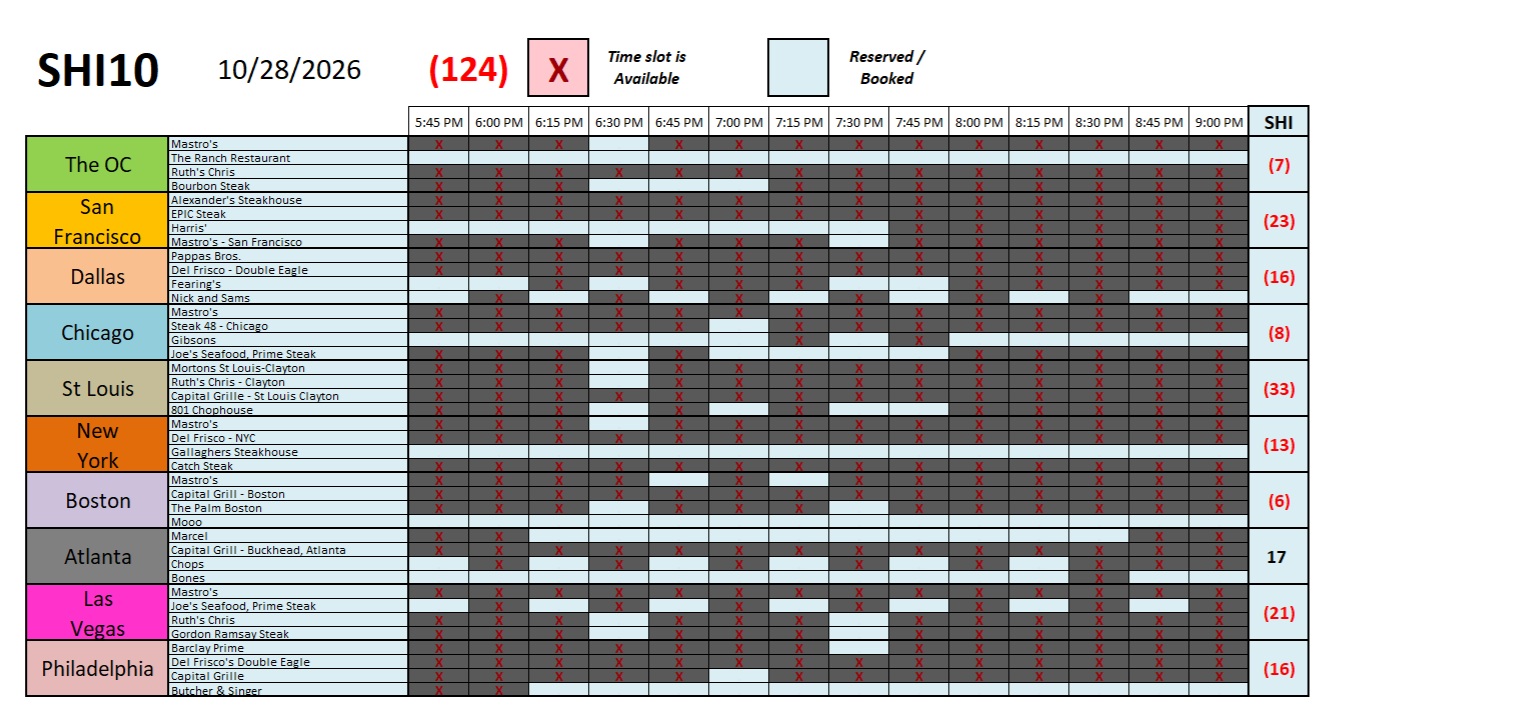
Finally! We have some excitement here at the SHI ! ! ! !
First, check out the grid’s new look! Spooky, right? Don’t get used to it — this is a one-week gig. It’s a special look for Halloween.
But this presentation format does help communicate the totality of red ink this week. Our SHI10 is a negative 124 today. Wow. That is a super weak SHI10 reading. In fact, it is so low I had to check and see when we last had a reading this low. The answer: Never. This week, it turns out, is the lowest SHI10 reading ever.
Below is the historic grid. I show about one year of data here. So you’ll have to trust me when I say I checked the older data — I cannot find a lower reading at any time in the history of the series.
Which begs the question: As the SHI was designed as an alternative metric to gauge future economic activity, does this SHI10 reading suggest the US economy is now, or will soon be, entering recession? After all, reservation demand for Saturday is an extremely weak. Doesn’t this suggest some deep, underlying problem in the economy?
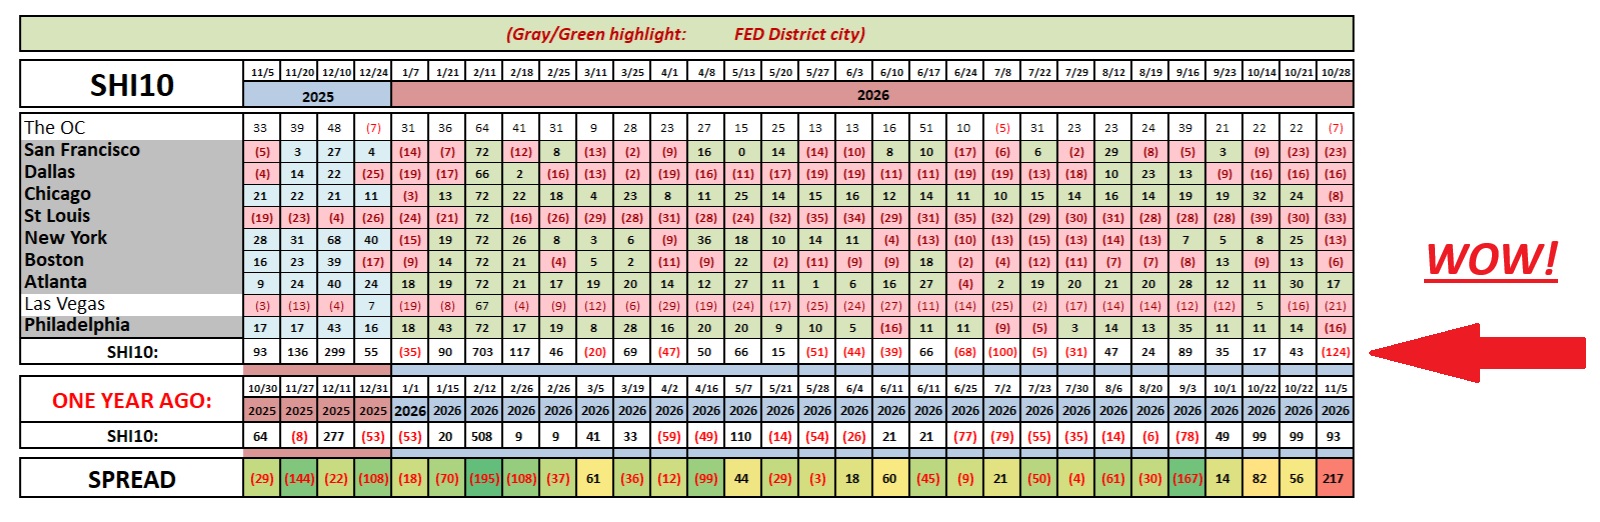
No. It does not. That’s because Saturday is Halloween. Spooky.
Apparently, steak lovers across America will be at home handing out candy or out with friends at a spooky Halloween bash. Either way, the one place they will not be is Mastros. Of course, I may be wrong and this is a market turn. Perhaps. But I doubt it. I’m pretty sure this is an aberration.
Most economic experts expect a barn-burner of a GDP growth rate when the next GDP number is released tomorrow. The Atlanta FED GDPnow projection is holding at 3.4%. Earlier this afternoon, the FED Chair Kevin Warsh commented, “Economic activity is expanding at a strong pace. I’m going to agree with Kevin.
Tomorrow, let’s all check the GDP release and see if Kevin and I are right. The metric is released at 5:30 am CA time. Get up early and watch! 🙂
<- Terry Liebman ->