
SHI: 11.21.18 – A Blueprint to Follow?

SHI 11.14.18 – Eat at Mastro’s
November 14, 2018
SHI 11.28.18 – Burgers, Steaks and Sushi
November 28, 2018
“Economic expansions rarely die from old age. They usually get hit by a bus.”
According to the National Bureau of Economic Research (NBER), our current economic expansion began in June of 2009. In June of 2019, it will be 10 years old. If it survives. If GDP growth remains positive past June of 2019, the expansion would match the longest expansion on record, since records were first kept in 1854. The current record — 120 months — was set in March of 1991 thru March of 2001. (Recall that an expansion ends when a ‘recession’ begins. A recession is defined as two (2) consecutive calendar quarters of negative GDP growth.)
What might kill the current expansion before it becomes the longest on record here in the United States? Old age? Nope. Not this one. Heart attack? No, unlike humans, economic expansions do not eat thick, juicy New York steaks grilled in butter at Ruths’ Chris.
Economic expansions lumber along, like a spring bear in the woods, wandering here and there, but then end suddenly. Or so it seems. Something snaps, cracks or breaks, and a recession is upon us. This has been the case for hundreds of years.
But in this modern era, where information feels both instantaneous and ubiquitous, the causes of a downturn are likely to be more transparent … more obvious. Will our expansion end when it’s hit by the ‘proverbial’ bus, driven by well-intentioned FED officials? If they don’t drive carefully, perhaps. Or might it perish due to the aggregate weight of poor choices by consumers or business over a long period of time, leading us to an unavoidable bear-trap that will snap shut, and stop our expansion in it’s razor-sharp jaws?
Is a recession inevitable? That seems to be the consensus.
Then how is it possible that Australia is in its 27th year of an economic expansion? Don’t they have buses or bears in Australia?
Welcome to this week’s Steak House Index update.
If you are new to my blog, or you need a refresher on the SHI10, or its objective and methodology, I suggest you open and read the original BLOG: https://www.steakhouseindex.com/move-over-big-mac-index-here-comes-the-steak-house-index/
Why You Should Care: The US economy and US dollar are the bedrock of the world’s economy. This has been the case for decades … and will continue to be true for years to come.
Is the US economy expanding or contracting?
According to the IMF (the ‘International Monetary Fund’), the world’s annual GDP is about $80 trillion today. US ‘current dollar’ GDP now exceeds $20.66 trillion. In Q3 of 2018, nominal GDP grew by 4.9%. We remain about 25% of global GDP. Other than China — a distant second at around $11 trillion — the GDP of no other country is close.
The objective of the SHI10 and this blog is simple: To predict US GDP movement ahead of official economic releases — an important objective since BEA (the ‘Bureau of Economic Analysis’) gross domestic product data is outdated the day it’s released. Historically, ‘personal consumption expenditures,’ or PCE, has been the largest component of US GDP growth — typically about 2/3 of all GDP growth. In fact, the majority of all GDP increases (or declines) usually results from (increases or decreases in) consumer spending. Consumer spending is clearly a critical financial metric. In all likelihood, the most important financial metric. The Steak House Index focuses right here … on the “consumer spending” metric. I intend the SHI10 is to be predictive, anticipating where the economy is going – not where it’s been.
Taking action: Keep up with this weekly BLOG update. Not only will we cover the SHI and SHI10, but we’ll explore related items of economic importance.
If the SHI10 index moves appreciably -– either showing massive improvement or significant declines –- indicating growing economic strength or a potential recession, we’ll discuss possible actions at that time.
The BLOG:
Australia doesn’t have bears. Of course, they do have the cute and cuddly Koala … which is not actually a bear, it turns out. But no bear species is native to Australia. Follow my logic here: If they have no bears, they certainly don’t have any bear traps, which could explain why their economy hasn’t stepped in one, right? 🙂
However, they do have buses. And they have a Treasurer, a Prime Minister, a Central Bank, and other well-intentioned officials who drive those buses. Who, since 1992, seem to have successfully avoided running over their economic expansion. Australia’s economic expansion is now over 27 years old. And while their annual GDP growth doesn’t measure up to the jaw-dropping double-digit growth we’ve seen in China, their consistent, steady 2-4% annual growth has produced enviable results.
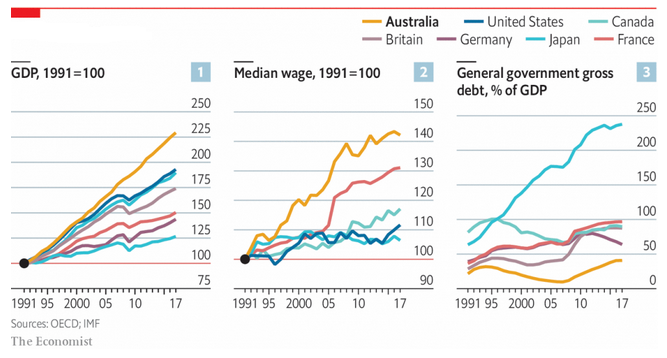
This chart, provided by The Economist magazine, tells the story. Since 1991, Australia’s GDP growth has surpassed the US and many other advanced nations.
How have they been able to pull this off? What is unique about Australia?
Some attribute their success to luck. Due to Australia’s wealth of natural resources, its proximity to China, and China’s seemingly insatiable demand for those resources. I don’t agree: Sure, this has played a big part in the scale of growth, but not the duration of growth.
No, something else is at work here. Financial reforms that began in 1986 and were more fully implemented by the early 1990s:
- ‘Net surpluses’ in 8 years between 1996 and 2007, turning the government from a debtor to a net creditor. Today, gross government debt is only 41% of GDP.
- To increase tax revenues, and to pay some portion of citizen entitlements, they implemented a type of ‘value added tax,’ or VAT, called a ‘goods services tax’ that amounts to 10% on the sale of most goods and services.
- Spending on pensions account for only 4% of GDP vs. 7% here in the US and 14% in France.
- Their public health system, also called Medicare, covers everyone, but only for ‘no-frills’ doctors and clinics. Patients seeking more, must pay.
I could dive deeper into each topic above, but let this comment suffice: With a debt-to-GDP ratio near 100%, a crushing annual spending deficit, massive pension costs, and budget-busting medical costs, the US needs to look for new ideas. I suggest a deeper look at Australia.
Today, the US remains the ONLY developed nation without a VAT. On $13 trillion of consumer spending, a 10% VAT would generate $1.3 trillion annually — more than enough to cover the current annual spending deficit. The change and implementation would be painful, but a VAT is really the only possible way to pay for our entitlement system, going forward. OK, I’m off my soap box. Let’s head to the steakhouses.
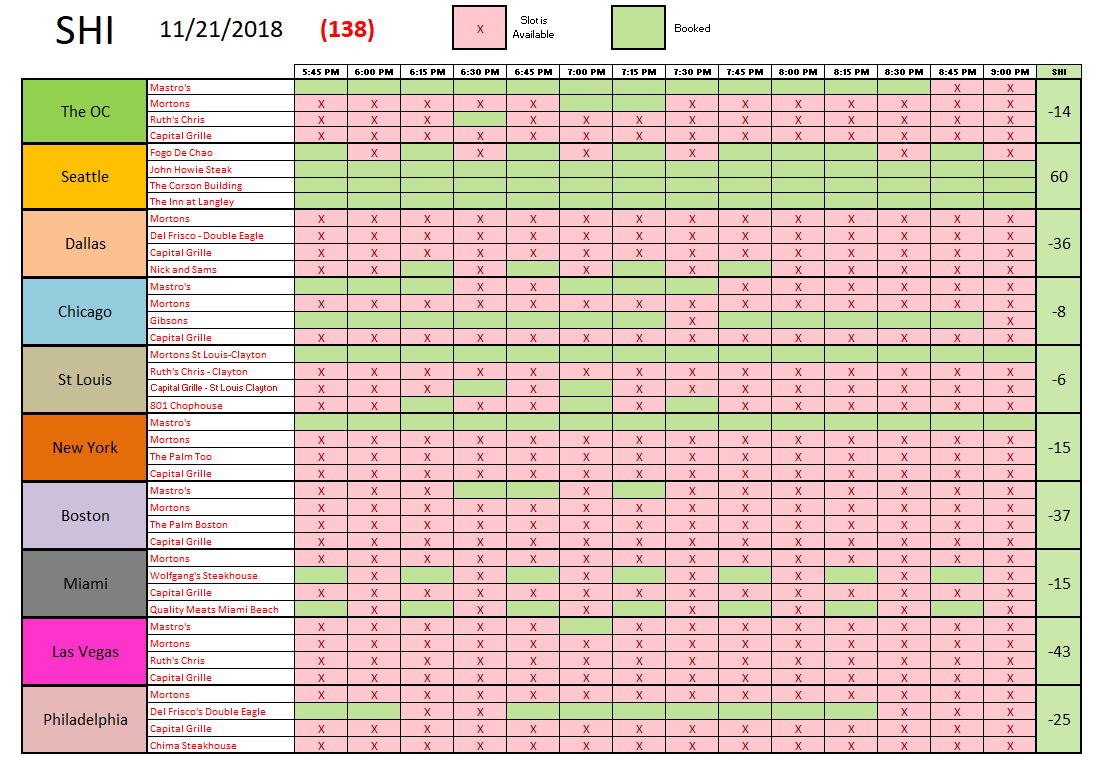
Once again, Seattle leads the way with ample reservation demand. Here in the OC, conditions at our expensive eateries look fairly consistent with prior SHI readings. I continue to find it interesting that in market after market, Mastros seems to consistently generate strong reservation demand. Is it the lobster mashed potatoes … or some other neat food trick?
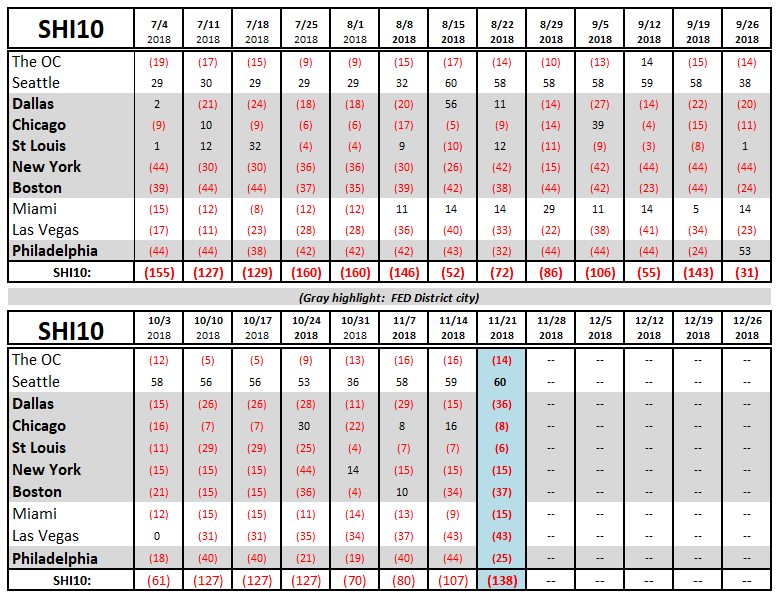
Below is the longer term trend chart. Reservation demand is appreciably weaker in Dallas and Chicago, but Philly shows some improvement this week.
It’s worth noting that the SHI10 slipped this week to a level we haven’t seen in a while. It’s too early to suggest this is a trend. But at a time when the stock markets are getting hammered, it would make sense that fewer opulent eaters would opt to spend upwards of $100 per person at the most expensive steakhouses. Time will tell. Here’s the grid:
Let me finish today’s blog with two final thoughts.
First, in prior blogs we’ve discussed the FEDs path of ‘normalization.’ In this context, normalization means the FED is seeks neutrality — a state which neither promotes nor hinders GDP growth. They hope to achieve this condition by manipulation both the size of the FEDs balance sheet and the federal funds rate.
Seeking this equilibrium point, the FED is:
- Reducing the size of the FEDs balance sheet … from the asset peak of around $4.5 trillion in January of 2016. At last measure, the FEDs assets had shrunk to $4.15 trillion — a reduction of about $350 billion.
- Increasing the federal funds rate … from near zero to a somewhat undefined, but higher level, possibly as much as 3.5%.
The word ‘normalization’ sounds so benign. So normal. But it is anything but normal. Nor is it simple. Because our economy has so many moving parts it’s easy to miscalculate and get it wrong. Resulting in abnormal economic policy that is dangerous to our economy and population. In this instance, FED miscalculations become the proverbial run-away bus.
Australia seems to have a blueprint worth studying. Their bus drivers seem to have navigated the roads pretty well…avoiding both potholes and cliffs. They, too, have no shortage of challenges. For example, their housing market is now losing steam … and values are falling. And Australia’s ‘household debt’ has reached an all-time high. These challenges are not insurmountable, but they can derail an expansion. We’ll see. Regardless, Australia’s results are enviable … and worth studying.
Second, happy Thanksgiving! I hope you have a wonderful holiday with your family and those friends you consider family. Enjoy.
– Terry Liebman


