
SHI 11.28.18 – Burgers, Steaks and Sushi

SHI: 11.21.18 – A Blueprint to Follow?
November 21, 2018
SHI 12.5.18 – Inversion Aversion
December 5, 2018
“Let’s talk food.”
Look, I’m as big a fan as anyone of burgers, steaks and sushi. But all at the same time? Yuck. Count me out.
But all three loom large in today’s blog. First, let’s talk burgers. Take a look at this:
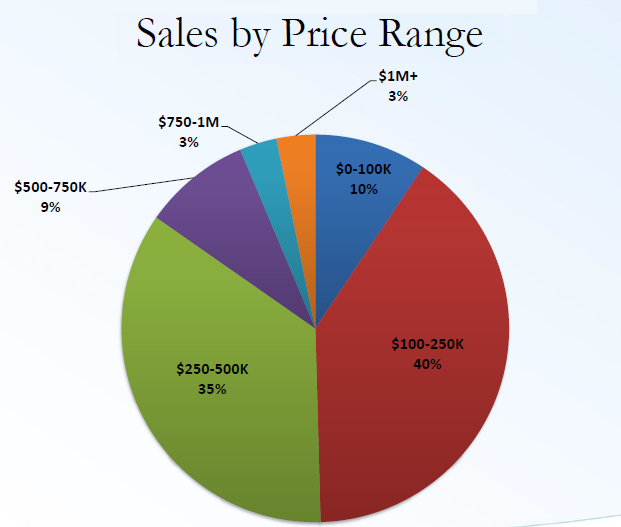
Right. That is NOT a burger. In fact, the only similarity it shares with a burger is shape. No, this is a chart provided by the National Association of Realtors, and it shows sale price dispersion across the spectrum of ‘existing home sales’ for the entire country. The burger-shape aside, I’ve included this chart to make a point: We’re pretty jaded here in California. In many parts of the state, we consider an $800,000 home to be a ‘starter’ home. Here in Orange County, CA, a $1 million home is very commonplace. We are the anomaly. With just 3% of all existing homes in the United States selling above $1 million, and another 3% above $750,000, it’s easy to see how expensive homes are here in CA. I’ll talk more about this issue below, before we turn the page to sushi and steaks.
Welcome to this week’s Steak House Index update.
If you are new to my blog, or you need a refresher on the SHI10, or its objective and methodology, I suggest you open and read the original BLOG: https://www.steakhouseindex.com/move-over-big-mac-index-here-comes-the-steak-house-index/
Why You Should Care: The US economy and US dollar are the bedrock of the world’s economy. This has been the case for decades … and will continue to be true for years to come.
Is the US economy expanding or contracting?
According to the IMF (the ‘International Monetary Fund’), the world’s annual GDP is about $80 trillion today. US ‘current dollar’ GDP now exceeds $20.66 trillion. In Q3 of 2018, nominal GDP grew by 4.9%. We remain about 25% of global GDP. Other than China — a distant second at around $11 trillion — the GDP of no other country is close.
The objective of the SHI10 and this blog is simple: To predict US GDP movement ahead of official economic releases — an important objective since BEA (the ‘Bureau of Economic Analysis’) gross domestic product data is outdated the day it’s released. Historically, ‘personal consumption expenditures,’ or PCE, has been the largest component of US GDP growth — typically about 2/3 of all GDP growth. In fact, the majority of all GDP increases (or declines) usually results from (increases or decreases in) consumer spending. Consumer spending is clearly a critical financial metric. In all likelihood, the most important financial metric. The Steak House Index focuses right here … on the “consumer spending” metric. I intend the SHI10 is to be predictive, anticipating where the economy is going – not where it’s been.
Taking action: Keep up with this weekly BLOG update. Not only will we cover the SHI and SHI10, but we’ll explore related items of economic importance.
If the SHI10 index moves appreciably -– either showing massive improvement or significant declines –- indicating growing economic strength or a potential recession, we’ll discuss possible actions at that time.
The BLOG:
FED Chairman Powell is speaking as I write this blog. Apparently the markets like what he’s saying because the DOW is up almost 500 point at this moment.
Why? Because Powell said the central bank benchmark interest rate is “just below” neutral. Which means the FED may now consider slowing the speed of interest rate hikes. This comment is VERY different than one in early October when he suggested the FEDs current rate was “a long way” from neutral. We all know Powell should have called me. I would have told him a 2.5% to 3% FED funds rate is the present-day ‘neutral’ range, commonly known as r*. Fortunately it appears that he — and perhaps the entire FOMC board — are reading my blog. They must love steaks too. 🙂
Perhaps not. Perhaps they have yet to learn about the Steakhouse Index. But they are considering reams of data. Such as the impact monetary policy has on housing. Take a look at this chart, again, courtesy of the NAR.
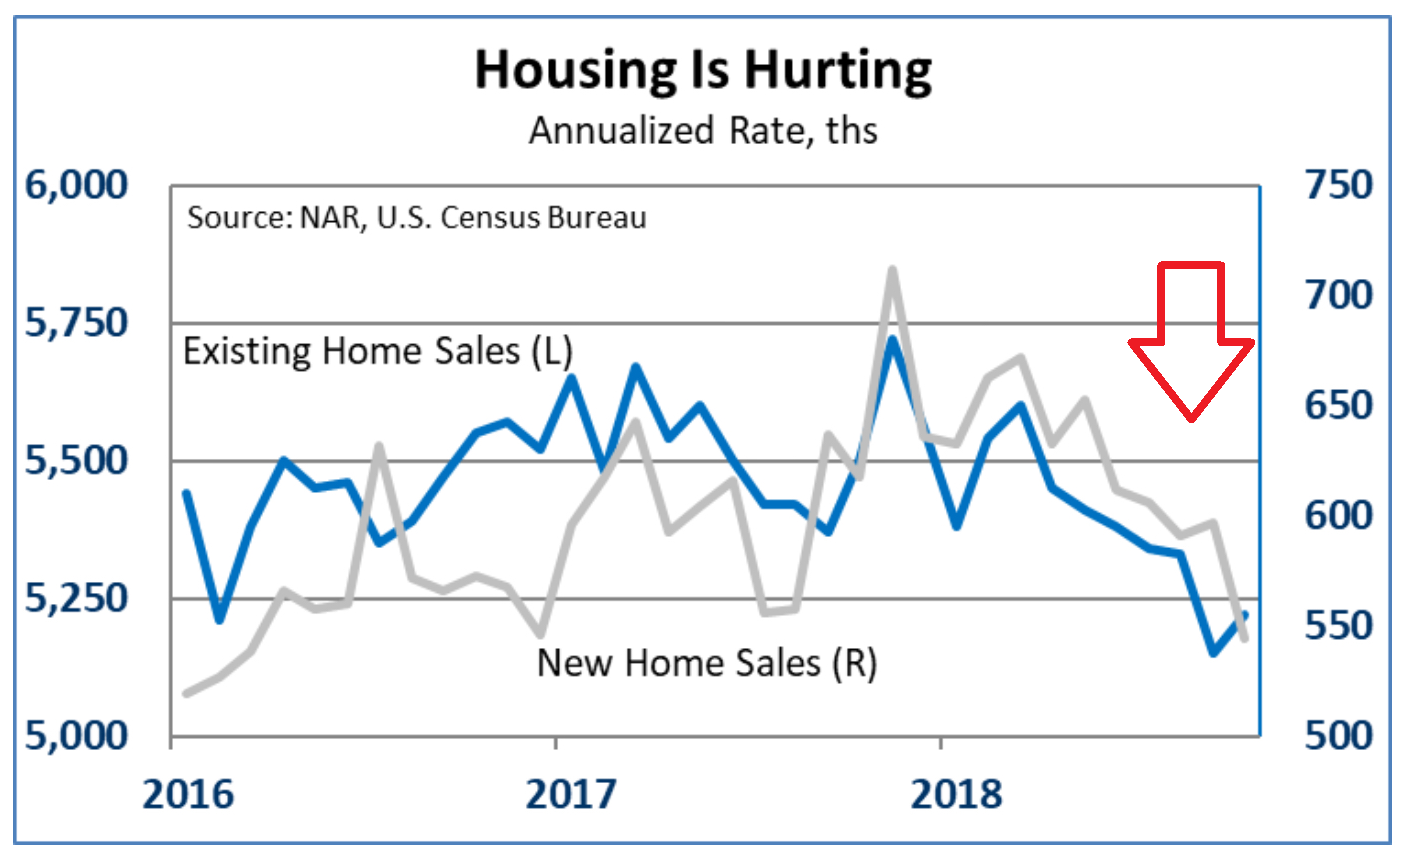
Exiting home sales are slowing. The same outcome is being observed in new home sales. Neither bodes well for the US economy as a whole, and both will be a drag on future GDP growth readings. Very high home prices and rising interest rates are both adversely impacting the level of home sales. These data points, more than the SHI (I suppose), are helping the FED realign (lower) their perceived level of ‘neutral’ for short term rates. Good.
OK. Let’s talk sushi. Once again, I’m sorry to report, I have no sushi comments. However, I do have some Japan comments. Which is the original home of sushi. Take a look at these charts, courtesy of the International Monetary Fund:
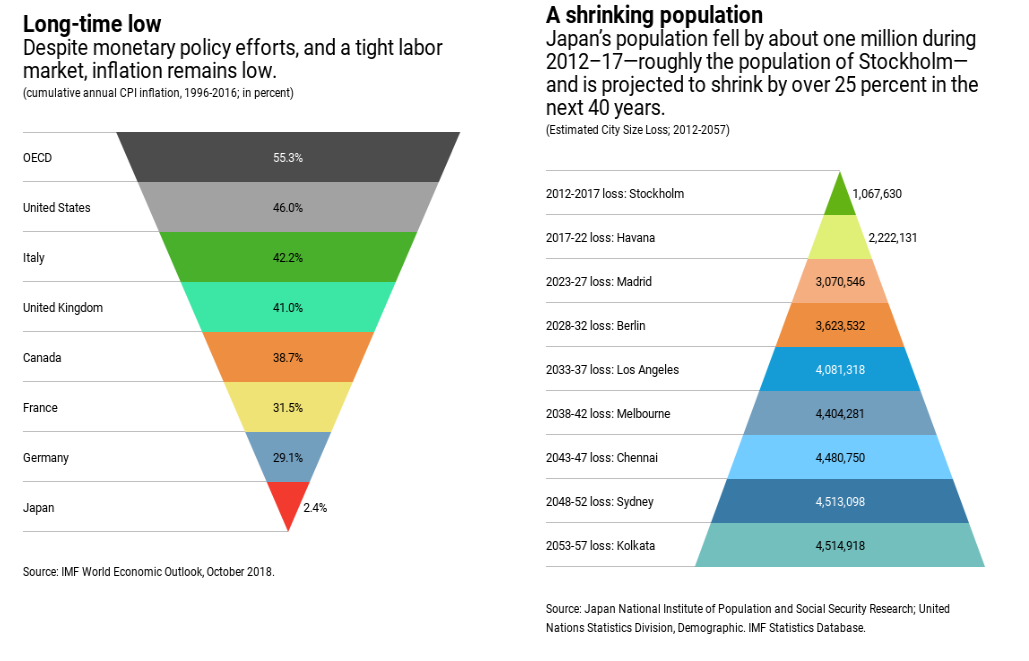
The chart on the left shows the impact of 20-years of inflation — 1996 thru 2016 — in various regions. Price increases here in the US totaled 46% during that period. But in sushi-central, prices increased only 2.4%. Over 20 years. Wow. This in spite of Japan’s central bank quantitative easing which has lifted their debt-to-GDP ratio to over 250%. This is a staggering level of debt when compared to every other developed nation.
The chart on the right is equally fascinating.
In the 5-year period from 2012 thru 2017, Japan shrunk by about 1 million folks. Fish populations in Japan’s oceans are rejoicing.
And the IMF expects the Japan’s population to continue to shrink. In fact, they are forecasting Japan to dwindle by over 25% over the next 40 years! Bluefin Tuna are pulling out the champagne! 🙂
I share this sushi-moment for this reason: US demographic trends are following in Japan’s footsteps. We’re maybe 2-3 decades behind them. Maybe. The one major difference: The US has a far more accomodative immigration policy than Japan. Frankly, only a complete reversal of their immigration policies will save Japan from extinction.
OK…let’s talk about steaks! By now you’re probably wondering if I really plan to talk about steaks. Could this be another ruse? NO! We’re talking steaks! After all, this is the Steakhouse Index!
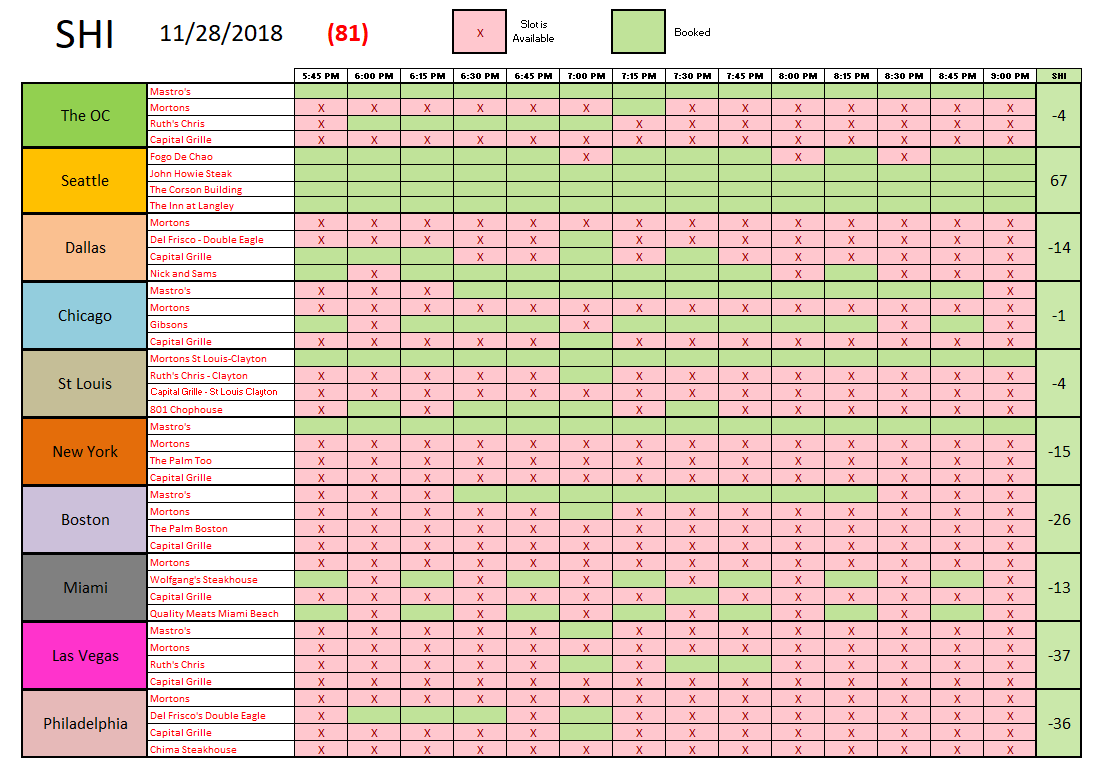
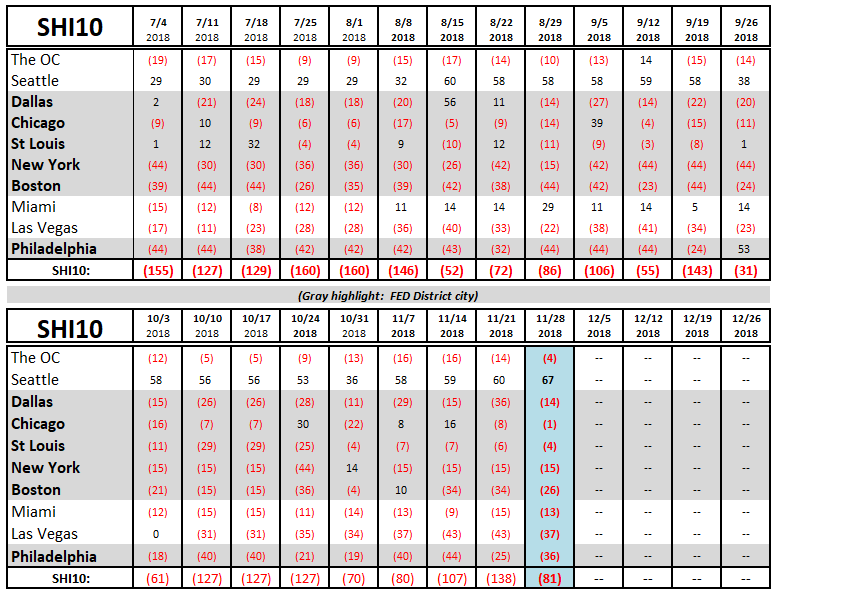
This week, we see an improving trend. Reservation demand at inordinately expensive beef shrines, for example, Mastros, increased in every city with the exceptions of NYC and Philly. What’s the most popular time to eat a piping-hot NY Steak that costs and arm and a leg, you ask? Take a look: The 7 pm time-slot is booked most often. Here’s our longer term trend analysis:
I talk a lot about the FED, FED Chairman, and FED-speak in my blog. I consider them to be the big-dog. The 800-pound gorilla. When they talk, people listen. So today’s comment that interest rate levels are “close to neutral” makes today a big day.
It’s been joked that an inverted yield curve has accurately predicted nine of the past 5 recessions. Yeah, I know. Economist humor boring. In fact, it’s not very funny at all. But looking past the humor, we get a sense of the large role interest rates play in our economy. Which is why Powell’s comment today was very important.
Perhaps the FED won’t lead us into a recession in the near future. Time will tell. Perhaps we’ll give Australia a run for their money after all! Our expansion just needs to run for another 17 or 18 years … and we get the gold! 🙂
Frankly, I think the chance of a cuddly koala becoming the next US president is better. But who knows!
- Terry Liebman


