
SHI 12.5.18 – Inversion Aversion

SHI 11.28.18 – Burgers, Steaks and Sushi
November 28, 2018
SHI 12.12.18 – The Wealth Effect
December 12, 2018
“Who’s afraid of a little yield curve inversion?”
If you’re not a fan of economic contractions, you should be afraid of yield curve inversions. No, an inversion does not ALWAYS mean a recession is close behind, perhaps within 2-18 months. But an inverted yield curve is a very, very strong forward indicator. One that should make you squeamish at best, and outright panicked at worst. If you don’t like recessions.
Welcome to this week’s Steak House Index update.
If you are new to my blog, or you need a refresher on the SHI10, or its objective and methodology, I suggest you open and read the original BLOG: https://www.steakhouseindex.com/move-over-big-mac-index-here-comes-the-steak-house-index/
Why You Should Care: The US economy and US dollar are the bedrock of the world’s economy. This has been the case for decades … and will continue to be true for years to come.
Is the US economy expanding or contracting?
According to the IMF (the ‘International Monetary Fund’), the world’s annual GDP is about $80 trillion today. US ‘current dollar’ GDP now exceeds $20.66 trillion. In Q3 of 2018, nominal GDP grew by 4.9%. We remain about 25% of global GDP. Other than China — a distant second at around $11 trillion — the GDP of no other country is close.
The objective of the SHI10 and this blog is simple: To predict US GDP movement ahead of official economic releases — an important objective since BEA (the ‘Bureau of Economic Analysis’) gross domestic product data is outdated the day it’s released. Historically, ‘personal consumption expenditures,’ or PCE, has been the largest component of US GDP growth — typically about 2/3 of all GDP growth. In fact, the majority of all GDP increases (or declines) usually results from (increases or decreases in) consumer spending. Consumer spending is clearly a critical financial metric. In all likelihood, the most important financial metric. The Steak House Index focuses right here … on the “consumer spending” metric. I intend the SHI10 is to be predictive, anticipating where the economy is going – not where it’s been.
Taking action: Keep up with this weekly BLOG update. Not only will we cover the SHI and SHI10, but we’ll explore related items of economic importance.
If the SHI10 index moves appreciably -– either showing massive improvement or significant declines –- indicating growing economic strength or a potential recession, we’ll discuss possible actions at that time.
The BLOG:
“READ THE SIGNS!,” says Sean. Of course, he is biased, but that doesn’t make the advice any less good. And what are the signs telling us? Is a recession imminent?
Did the yield curve invert, or not?
Let’s take a look. Here is the latest yield data courtesy of the US Treasury:
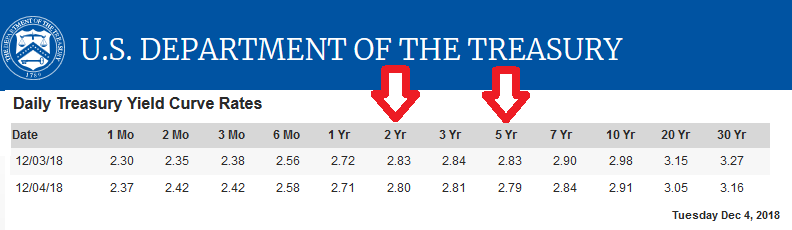
Yeah, we inverted. Just a bit. The 2-year Treasury is sporting a higher yield than the 5-year. Inversion simply means the yield on shorter maturities is higher than the yield on longer maturities. And that definitely happened.
But it’s important to make a distinction between this type of inversion and the far more meaningful 3-month/10-year relationship. Sure, any yield inversion is a bad sign for the future of the economy … but the 3-mo/10-yr relationship is still positive. 49 basis points positive to be precise. And since I use the 3-mo/10-yr curve as my barometer, I would not yet put on my ‘OH MY GOD, THE SKY IS FALLING!’ hat. For now, that hat is still hanging on the coat rack hook.
But the fact that my bald pate is not hat-covered does not minimize my concern. No, this is a sign. This is how yield curve inversion typically begins. Remember, the FED is pushing up the short end of the curve. Even if the 10-year Treasury stays put, 2 more FED rate increases will cause the 3-mo/10-yr curve to invert. Will they? Yeah, probably. With the FED funds rate currently standing at 2.25%, the FED probably believes this rate is not yet ‘neutral.’ And I would agree with them. It’s still a slight bit low … a bit accommodating.
The FED probably believes at least 2 more rate hikes are in order. The first, I expect, will occur in just a few weeks, later in December. And the second rate hike is likely to arrive in Q1 of 2019. If the 10-year Treasury stays around 2.9%, that second rate hike will probably invert the 3-mo/10-yr curve.
But even if that happens, the US may not be heading for a near-term recession. The probability of a recession will have increased … but it’s not a certainty. My opinion, as I’ve stated before, is that a recession will follow about a year or so later. I expect the next recession to begin sometime between the end of Q3, 2020 and the end of Q2, 2021. And this forecast has nothing to do with steaks. This forecast is 100% about interest rate and yield curves.
But lets see what steaks are telling us about consumer consumption this week:
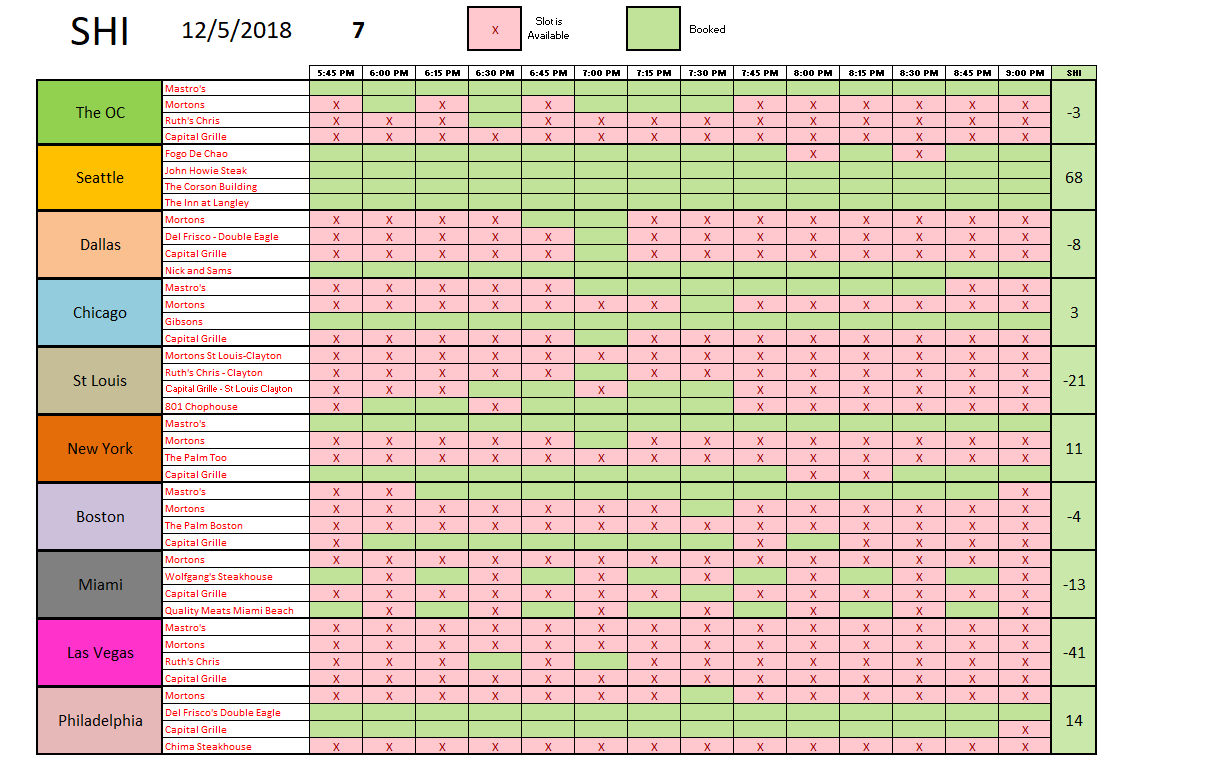
Well, happy holidays and ‘seasoned greetings!’ Whether this first SHI of December is reflecting seasonality, or folks simply have a hankering for a well-seasoned, flame-broiled-to-perfection filet, reservations at our fabulous eateries are flying off the shelf this week. This is the first positive SHI10 reading since May 16th. Expensive steakhouses in 7 of 10 of our SHI cities saw reservation demand improvement this week. Miami was unchanged (typical for Miami), and only Vegas and St. Louis saw reservation demand slip:
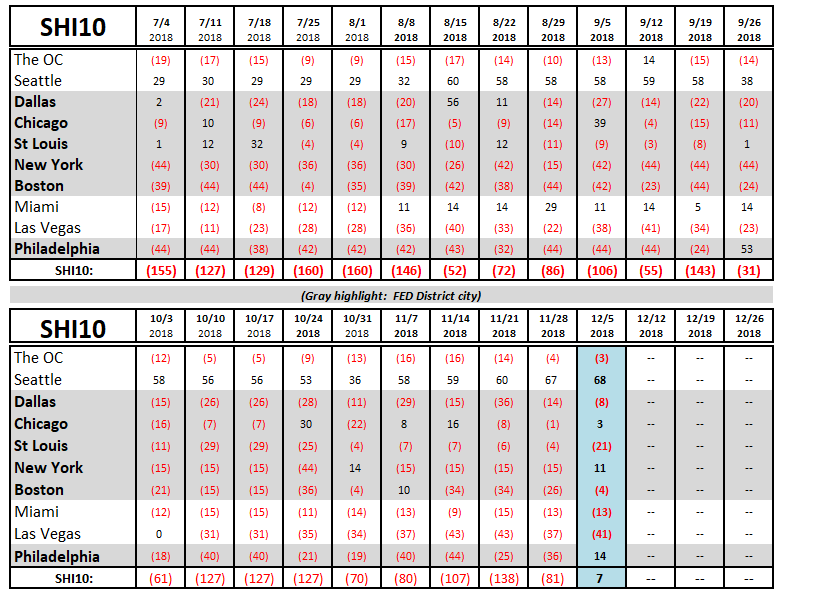
Interesting, right? At the same moment an itsy-bitsy tip of the yield curve inverts, the SHI10 shows significant improvement. These signs seem to be in conflict. So what do the signs say? Let’s ask Sean! After all, he’s in the biz. He’ll probably say that consumers are feeling more optimistic these days than stock traders. That Sean. What a know-it-all. 🙂
December is always a strong reservation demand month. So it’s likely we’ll continue to see strong SHI readings for the balance of the month.
Let me shift gears a moment and finish with another brief comment on US budget deficits and taxes. The Organization for Economic Co-operation and Development (OECD) recently put out their annual survey of “tax-to-GDP” ratios for member countries. Which OECD country collects the most taxes as a percentage of their GDP? With a collection rate of 46.2%, France has now taken the lead. Those French folks! Always working hard to be number one! Take a look:
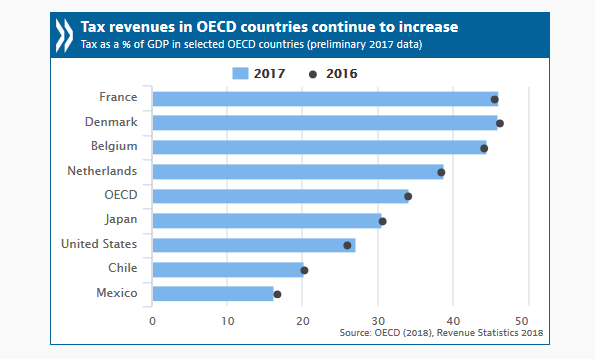
The OECD commented that “taxes on personal consumption represents an increasing share of total tax revenues….”
In other words, VAT taxes. And so while France sits at 46.2% of GDP, the US collects a paltry 27.1% of our GDP in taxes, according to the OECD. Why? We do not have a VAT that taxes personal consumption. Should we? Yes. I’m not a big fan of higher taxes, but in as much as every other economically developed/advanced nation has a VAT, it’s time for us to join them. No one likes a ‘sales tax,’ but a VAT sales tax does distribute the tax burden highest on folks that consume the most stuff. Seems reasonable to me. And in my opinion, it’s the only way we’ll ever balance our budget. If you want to read more about the OECD, here’s a link for you:
See you soon! Oh, and be sure to wish my wife a Happy Birthday!
- Terry Liebman


