
SHI 11.22.23 — Velocity: Money and Food

SHI 10.25.23 – We Are Not Alone
October 26, 2023
SHI 11.29.23 – Sorting Thru The Tea Leaves
November 29, 2023
The velocity of money is defined by the Federal Reserve as:
“… The frequency at which one unit of currency is used to purchase domestically- produced goods and services within a given time period. In other words, it is the number of times one dollar is spent to buy goods and services per unit of time. If the velocity of money is increasing, then more transactions are occurring between individuals in an economy.
The frequency of currency exchange can be used to determine the velocity of a given component of the money supply, providing some insight into whether consumers and businesses are saving or spending their money.”
“
Money velocity is worth a look.”
“Money velocity is worth a look.”
More technically, money velocity is the ratio of quarterly nominal (current dollar) GDP to the quarterly average of M2 money supply. Both GDP and M2 are huge in size and critical components of the American economy. And so, it naturally follows, the long-term relationship between the two is worth discussing.
Welcome to this week’s Steak House Index update.
If you are new to my blog, or you need a refresher on the SHI10, or its objective and methodology, I suggest you open and read the original BLOG: https://www.steakhouseindex.com/move-over-big-mac-index-here-comes-the-steak-house-index/
Why You Should Care: The US economy and US dollar are the bedrock of the world’s economy.
But is the US economy expanding or contracting?
Expanding … FED rate increases notwithstanding! At the end of Q3, 2023, in ‘current-dollar‘ terms, US annual economic output rose to an annualized rate of $27.62 trillion. America’s current-dollar GDP increased at an annualized rate of 8.5% during the third quarter of 2023. Even the ‘real’ GDP growth rate was hot… clocking in at the annual rate of 4.9% during Q2.
The world’s annual GDP first grew to over $100 trillion in 2022. According to the IMF, in June of this year, current-dollar global GDP eclipsed $105 trillion! IMF forecasts call for global GDP to reach almost $135 trillion by 2028 — an increase of more than 28% in just 5 years.
America’s GDP remains around 25% of all global GDP. Collectively, the US, the European Common Market, and China generate about 70% of the global economic output. These are the 3 big, global players. They bear close scrutiny.
The objective of this blog is singular.
It attempts to predict the direction of our GDP ahead of official economic releases. Historically, ‘personal consumption expenditures,’ or PCE, has been the largest component of US GDP growth — typically about 2/3 of all GDP growth. In fact, the majority of all GDP increases (or declines) usually results from (increases or decreases in) consumer spending. Consumer spending is clearly a critical financial metric. In all likelihood, the most important financial metric. The Steak House Index focuses right here … on the “consumer spending” metric. I intend the SHI10 is to be predictive, anticipating where the economy is going – not where it’s been.
Taking action: Keep up with this weekly BLOG update. Not only will we cover the SHI and SHI10, but we’ll explore “fun” items of economic importance. Hopefully you find the discussion fun, too.
If the SHI10 index moves appreciably -– either showing massive improvement or significant declines –- indicating growing economic strength or a potential recession, we’ll discuss possible actions at that time.
The Blog:
The FED has been monitoring money velocity, every calendar quarter, since 1959. Here’s the graph, courtesy of the St. Louis FED:
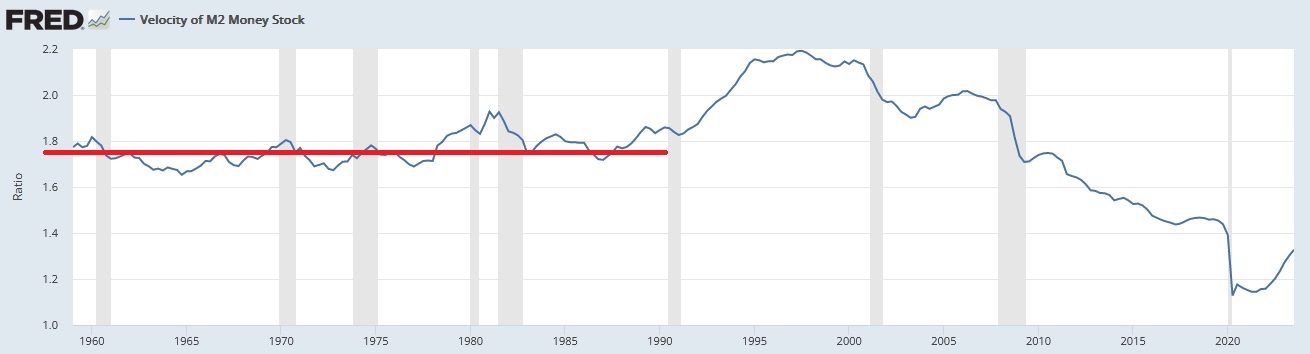
For decades, as the red line suggests, the ratio was fairly consistent. In fact, for 30-years – between 1960 and 1990 – it hovered between about 1.7 and 1.8. Then, over the next 10-years, the ratio climbed up to 2.2 right around the turn of the century – and the ‘dot-com’ bust – and since that time, for some reason, the ratio consistently declined until plummeting during the pandemic.
And then, beginning in Q2 of 2021, the ratio began to increase. Significantly.
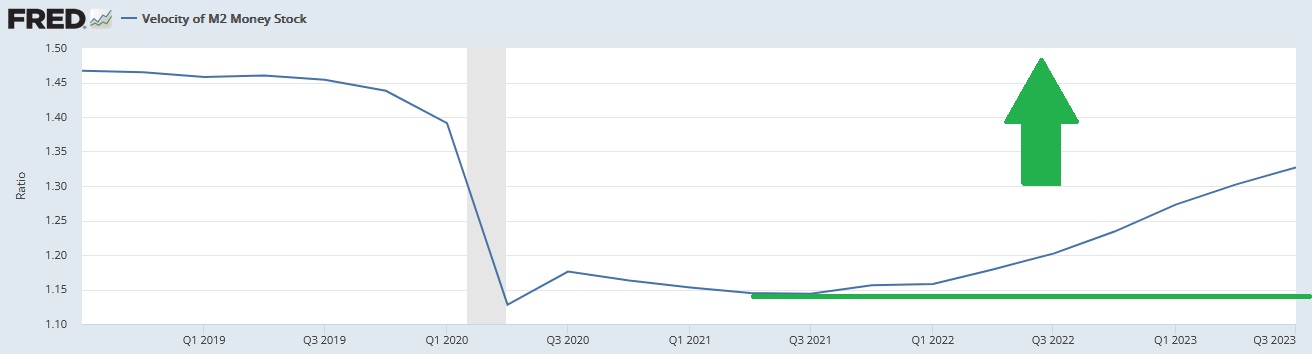
Why? What does this mean? And why does this matter?
First, let me be clear on this point: Money velocity is a ratio calculated using two (2) other very important economic data – money supply and nominal GDP. As such, its value is wholly reliant on, and the result of, the performance of those two metrics. As such, it is more of a behavioral metric than an economic calculation. Let me explain.
Changes in GDP measure our country’s economic activity over time. M2 measures money supply. Both measurements reflect an actual result. Money velocity, on the other hand, measures the relationship, over time, between these two variables. Changes in this relationship, again over time, tell us a lot about the US economy as a whole, and more specifically consumer spending and savings. Remember, spending and saving are somewhat diametrically opposed. In theory, a dollar spent is a dollar not saved.
This isn’t completely true, of course, when consumers have access to debt. However, the relationship is indicative, as access to debt is finite for all consumers. So, for the moment, let’s ignore the impact of debt and ponder this question:
Why did money velocity spike up to 2.2 around the year 2000 and then plummet for the next 20 years?
To answer the question, we have to remember that money velocity is the ratio of quarterly nominal (current dollar) GDP to the quarterly average of M2 money supply. In order for the ratio to increase, either nominal GDP has to increase faster than the underlying increase in M2, or M2 has to grow slower than nominal GDP. And this is precisely what happened.
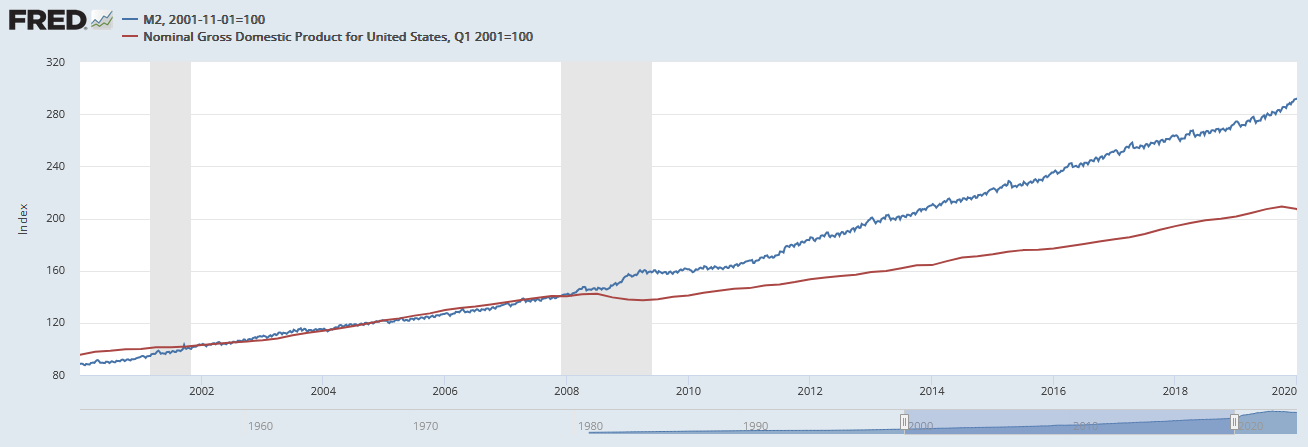
As we see above, nominal GDP grew faster than money supply during the 20 years between 2000 and 2020. And then, Covid hit triggering massive fiscal and monetary response in DC. Post-pandemic, money supply grew at an extraordinary rate. Unprecedented, really, in our American history.
Then an interesting thing happened. Take a look at this image:
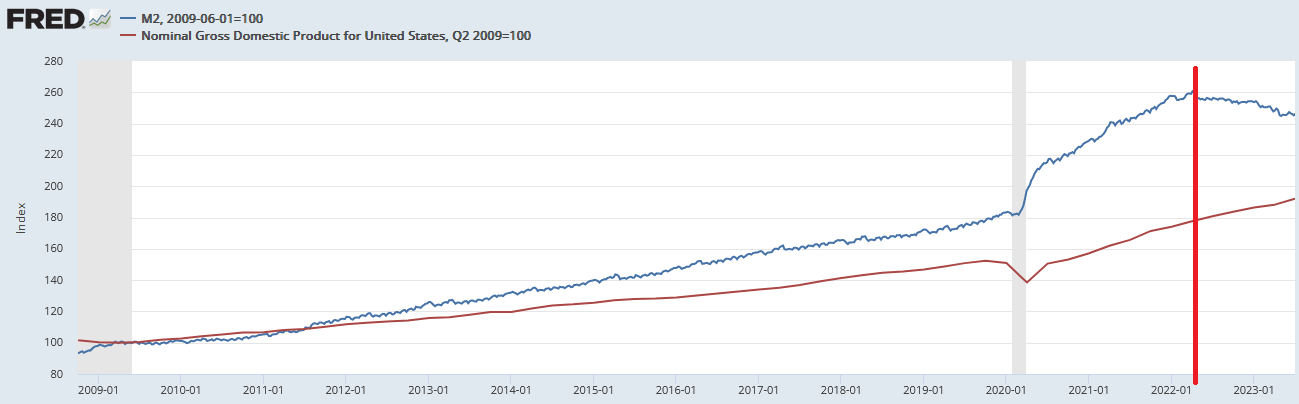
In April of 2022 (the red line above), money supply began to fall. What else happened in April of 2022? Do you remember? Assets on the FED balance sheet hit the highest level ever — just shy of $9 trillion. Then the FED began to shrink their balance sheet. Today, the FED balance sheet boasts only about $7.8 trillion. Are these two events related? Yep. They sure are.
At the same time, nominal GDP continue to grow rapidly. As a result, money velocity spiked, suggesting GDP was growing fast … and money supply growth was slow – or falling. Which is precisely what happened.
M2 actually declined significantly in the past 18 months. By about the same amount as the decline in the FED balance sheet. Almost dollar-for-dollar, actually. Does FED action on their balance sheet impact money supply levels? It sure can. Here’s where this gets a bit more interesting … and if I’m getting too technical, I apologize. I find it interesting! 🙂
Years ago, one of Milton Friedman’s economic theories, known as “the K-Percent Rule” suggested economic stability required that each year M2 growth equal nominal GDP growth.
Why? Well, Friedman argued that the 1930s, the FED either caused or, at minimum, exacerbated the Great Depression and triggered deflation by permitting money supply to decline precipitously.
The St Louis FED agree: “In the early ‘30s, the FED more or less let the banking system collapse, allowed the money supply to collapse and allowed the price level to fall. You had tremendous deflation, and that contributed to the contraction of the whole economy.” Ouch. Let’s not do that again.
Further, Friedman believed an excessive money supply growth rate far greater than the nominal GDP growth rate would trigger an inflation rate spike. I believe our most recent bout of sky-high inflation is proof of his theory. I believe the 40%+ M2 growth rate was primary cause.
In my opinion, Friedman was spot-on. I feel both the deflation during the 1930s and the recent inflationary spike were likely the result of MASSIVE outsized moves by the FED in both cases, which created corresponding massive economic distortions. In other words, general alignment in the growth rates of both nominal GDP and money supply probably generally holds the inflation rate steady. And the opposite is true,too.
As long as money velocity remains fairly constant, inflation should remain tame. However, money supply is actually shrinking these days, most likely the result of FED balance sheet reductions. A larger concern that inflation today, in my opinion, is the potential for deflation should the decline in M2 continue or pick up pace. The good news, of course, is that the FED is very aware of this relationship and is unlikely to repeat the errors of the 1930s FED. Let’s hope, right?
In honor of Thanksgiving, let’s move on to ‘food velocity.’ Tens of millions of people are on the move this holiday, crisscrossing the country to join family and friends for the big day. The numbers of travelers is absolutely staggering.
And, according to Bloomberg, millions of Americans will have an enjoyable gathering, albeit without perpetuating that most-American of traditions, overeating during the holidays. In early 2023, Trilliant Health presented an extensive report on healthcare, providing the image below on page 41:
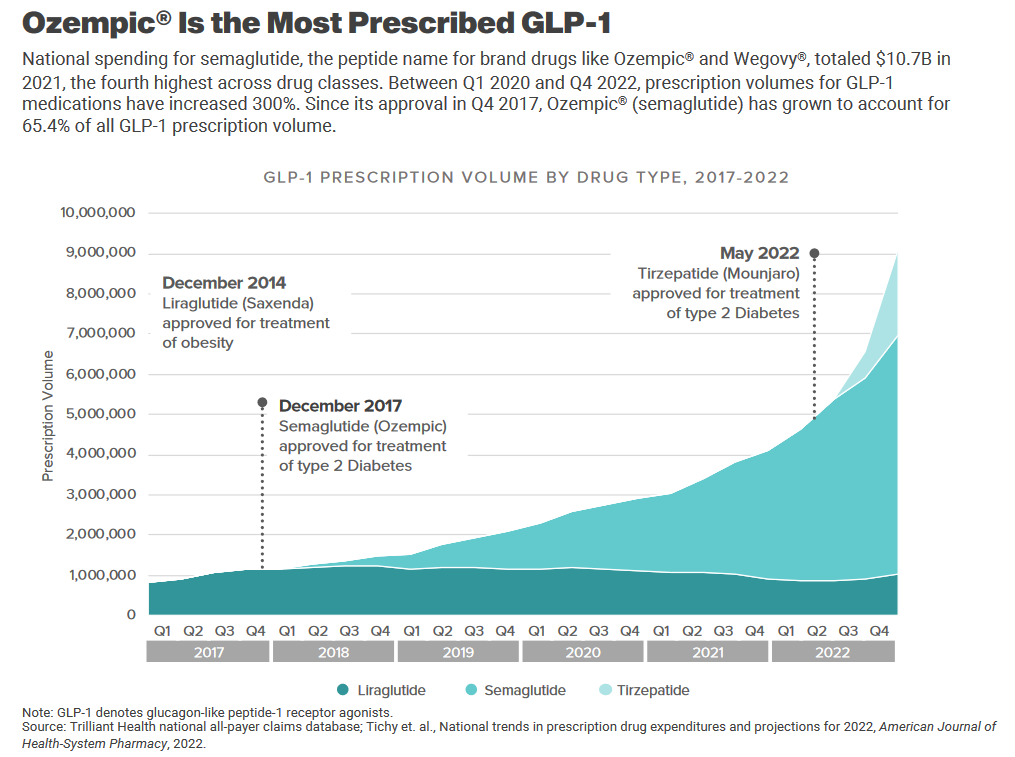
Demand for, and use of, these new diet drugs is skyrocketing. Per Trilliant, as 2023 began, prescription volume was running at close to 9 million – ostensibly to treat Type 2 Diabetes. 9 million. That’s about 3% of the total US population. And the image suggests the trend will continue.
How many Americans will end up taking one for weight loss? The math, of course, is speculative. However, the easy answer is likely quite a bit more than just 3% of the population. Reports suggest obesity impacts more than 40% of the American public. This suggests 3% is just the tip of the iceberg.
Might cows everywhere be rejoicing the increasing trend in weight-loss drug use? Time will tell, however the signs are promising.
Cows have reason to be optimistic. Novo Nordisk’s ‘Ozempic’ drug ‘Wegovy’ and Eli Lilly’s ‘Mounjaro both seem to work by telling your brain “you are not hungry,” thereby breaking the overeating cycle. Of course, both GLP-1 drugs have some headwinds. The drugs do have side effects that some people find intoleragle. Nausea is a big one. And the cost can cause nausea too: Wegovy has a retail price of $1,349 per month. After paying that price, I’m amazed most folks on Wegovy can actually afford to buy food. Remember that insurance generally does not cover this cost.
We have to wonder how these weight loss drugs will impact our steakhouses over time. Would you like to own one? Or do you want to invest in the public stock of a restaurant company, Coca Cola, Pepsi or McDonalds? Hmmm…. Let’s see how our expensive eateries are doing this week. Here’s the long-term trend report for 2023:
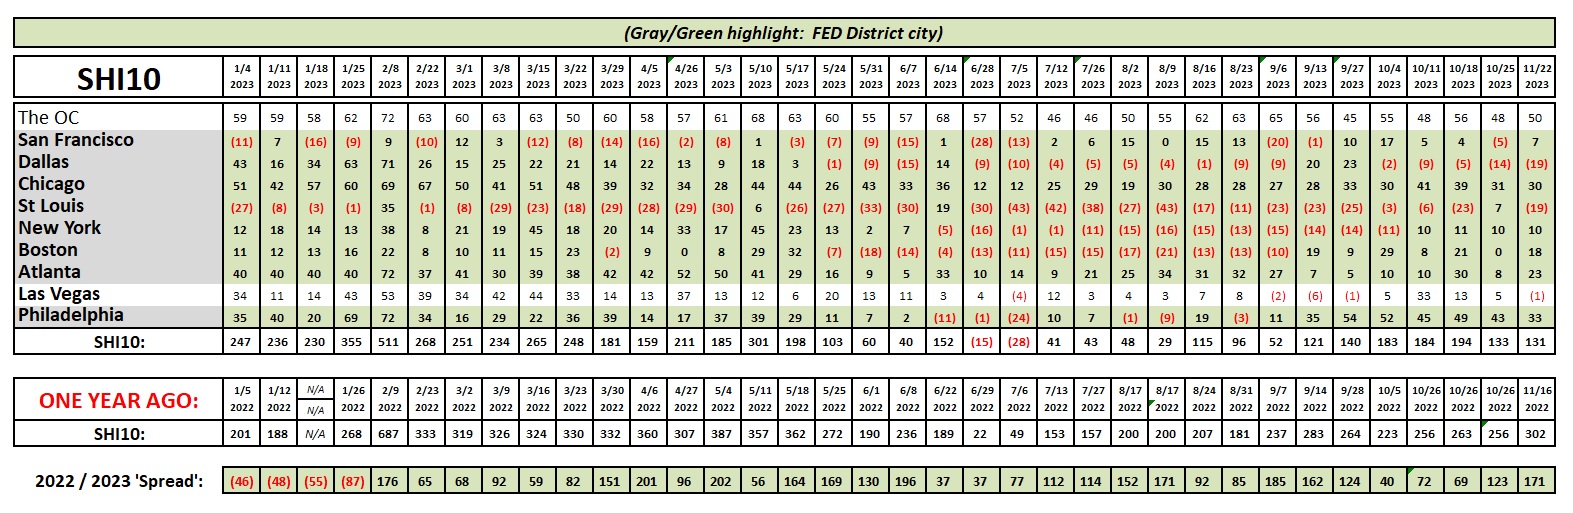
I find it interesting that more than 3 weeks since my last update, the SHI40 is little changed. Rock steady. Sure, some markets have improved … some have softened slightly, but over all the 131 from this week is almost identical to the SHI40 reading from 10/25. Fascinating.
My read is this: Our economy keeps chugging along. Will Q4 reach the blistering GDP growth rates of Q3? I doubt it. But a consistent steak house index suggests the economy remains on sound footing … and a recession is unlikely any time soon.
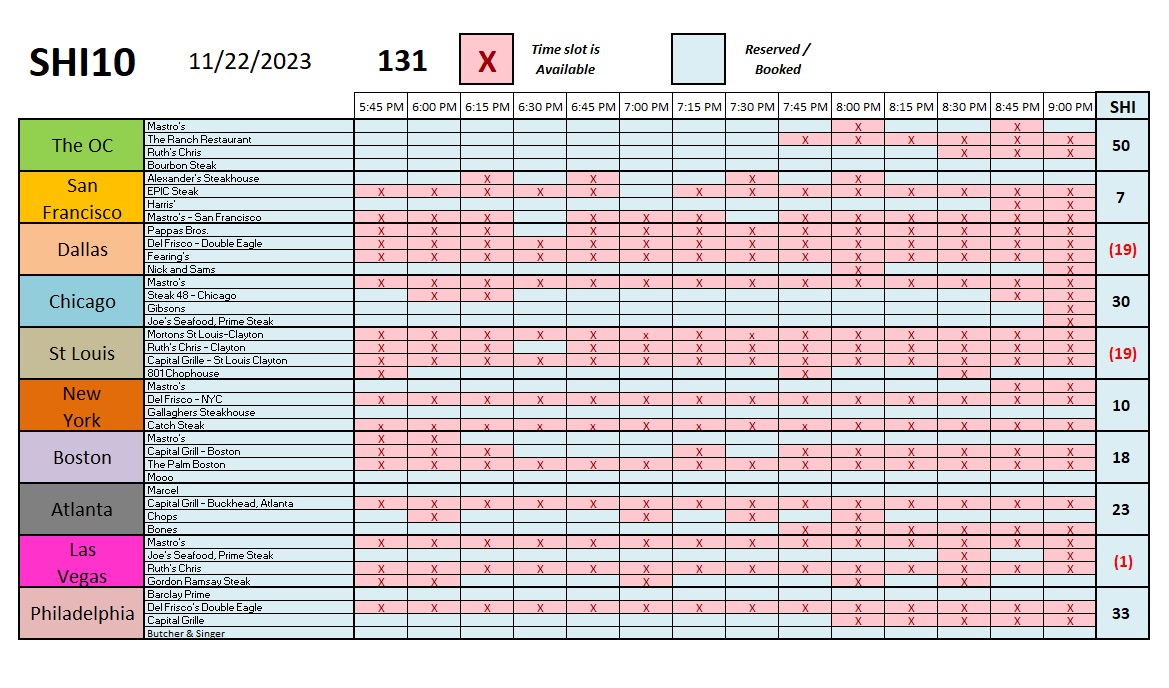
Here are the weekly numbers:
Thanks for checking in. I hope you found today’s comments interesting.
To you and your family, I wish a …
Happy Thanksgiving!
<:> Terry Liebman


