
SHI 12/27/17: Sizzling!

12/20/17: Tis the Season, Take 2
December 20, 2017
SHI 1/3/18: The 10-City SHI
January 3, 2018
Like a USDA prime ‘filet’ on a 1200 degree grill, our economy is sizzling!
Whether reading GDP ‘nowcasts,’ reviewing corporate profits, stock market gains, employment figures, or home sales, the US economy is sizzling.
The St. Louis FED produces a ‘Stress Index’ — known as the STLFSI — Friday of every week:
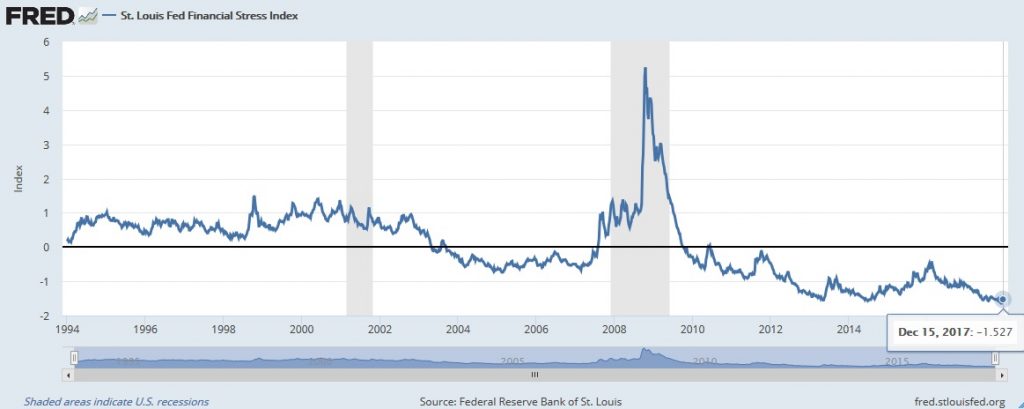
Look at the chart. Our economy was clearly stressed during the 2008 ‘Great Recession.’ Today? Not so much. Why?
The engine is firing on all cylinders. The STLFSI measures the degree of financial stress in the financial markets. The data source is 7 interest rate ‘series,’ 6 ‘yield spreads’ and 5 ‘other indicators.’ (All that’s missing is a Partridge in a Pear Tree.) Each of these variables captures some aspect of financial stress. If you’d like to receive the index each week, go to the FRED website and sign up. It’s a great metric … worth a peek now and then.
So, all the markets are hot. But are they too hot?
Welcome to this week’s Steak House Index update.
If you are new to my blog, or you need a refresher on the SHI, or its objective and methodology, I suggest you open and read the original BLOG: https://www.steakhouseindex.com/move-over-big-mac-index-here-comes-the-steak-house-index/
Why You Should Care: The US economy and US dollar are the bedrock of the world’s economy. This has been the case for decades … and will continue to be true for years to come.
Is the US economy expanding or contracting?
According to the IMF (the ‘International Monetary Fund’), the world’s annual GDP is almost $80 trillion today.
At last count, US ‘current dollar’ GDP is about $19.5 trillion — about 25% of the global total. Other than China — a distant second at around $11 trillion — no other country is close.
The objective of the SHI and this blog is simple: To predict US GDP movement ahead of official economic releases — an important objective since BEA (the ‘Bureau of Economic Analysis’) gross domestic product data is outdated the day it’s released.
Historically, ‘personal consumption expenditures,’ or PCE, has been the largest component of US GDP growth — typically about 2/3 of the total. In fact, the majority of all US GDP increases (or declines) usually result from (increases or decreases in) consumer spending. This is clearly an important metric. The Steak House Index focuses right here … on the “consumer spending” metric.
I intend the SHI is to be predictive, anticipating where the economy is going – not where it’s been. Thereby giving us the ability to take action early.
Taking action: Keep up with this weekly BLOG update. Not only will we cover the SHI, but we’ll explore related items of economic importance.
If the SHI index moves appreciably -– either showing massive improvement or significant declines –- indicating growing economic strength or a potential recession, we’ll discuss possible actions at that time.
The BLOG:
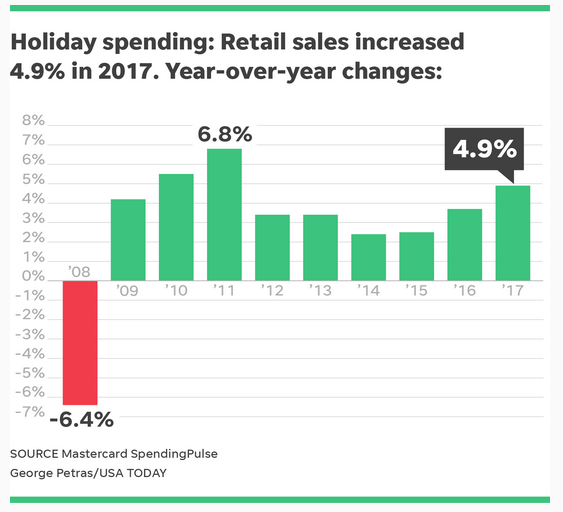
Christmas retail sales…new home sales…the stock markets…the NY Fed and Atlanta Fed ‘nowcasts’, etc., all have one thing in common: They’re COOKING! Take a look at this chart of ‘in-store’ retail sales, courtesy of USA Today:
Per Mastercard, online shopping also saw large gains: An increase of over 18% to 2016. And check out this graphic from the Census Bureau:
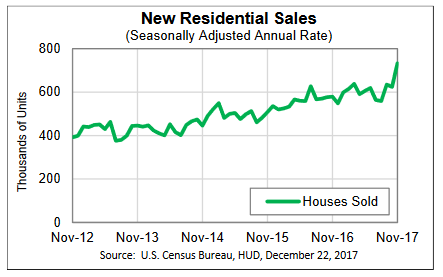
In November, sales of new single-family houses were at a “seasonally adjusted” annual rate of 733,000. This is 17.5% above the revised October rate of 624,000 and is 26.6% above the November 2016 estimate of 579,000. That’s definitely cooking.
Both of these metrics, of course, have a meaningful impact on US GDP growth. And they are 2 more reasons why the FED has been raising short-term rates … and contemplates further increases next year. Theirs is a difficult job: Ensuring the US economy grows meaningfully… but not too rapidly. So far, they are managing this delicate balance fairly well.
Unlike the economy as a whole, our SHI is not showing the same exuberance. What a difference a year makes….
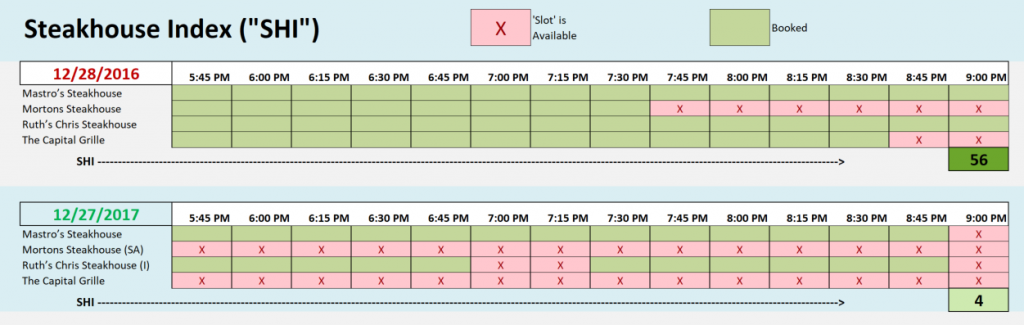
Last year at this time, it was almost impossible to find a beautifully crafted martini and USDA prime steak this Saturday evening. Even The Capital Grille was almost completely booked. This year … you can even find an open table at Mastros Ocean Club, albeit at 9 pm. There are plenty of open tables.
Here’s the longer term trend:
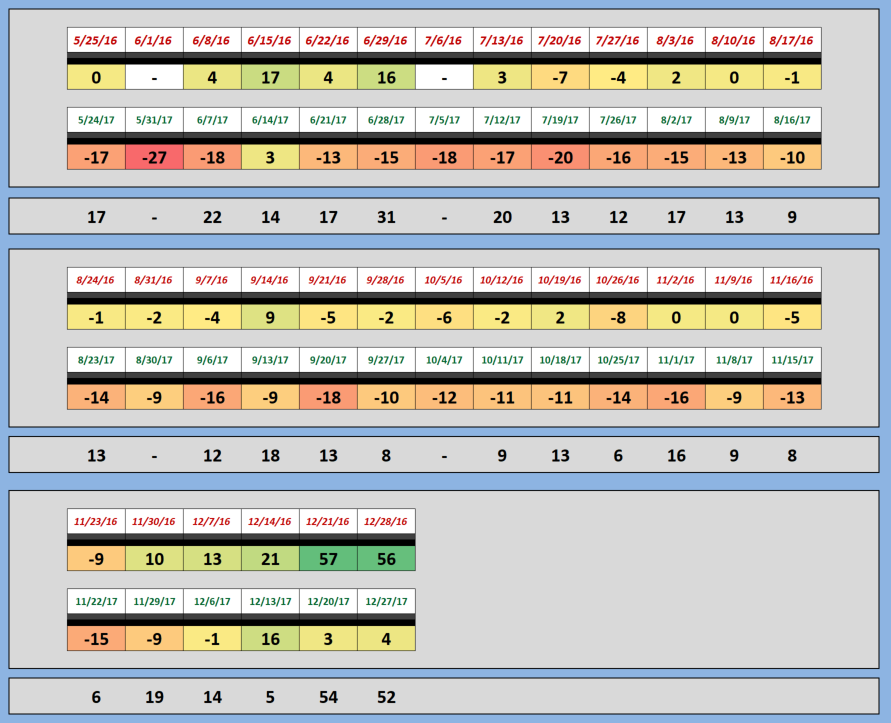
Once again, we have to ask the question: What is the SHI telling us … and is it meaningful?
As discussed before, about 70% of US GDP is the direct result of ‘consumer spending.’ Which means consumer spending and consumption is the single most important economic indicator.
Collectively, the behavior of US consumers is rational. Meaning, when faced with ‘financial danger’ we reduce our spending; we adapt our spending behavior to adverse conditions.
Thus, feeling “financially pinched,” are we going to take a party of 4 people to an expensive steak house for dinner on Saturday night? Probably not.
Conversely, if we’re feeling flush, sure, let’s all go to Ruth’s Chris Steak House on Saturday night and spend $400 or $500 for dinner! Woo Hoo!
The SHI — our weekly index — is founded on the belief that the quantity of available of reservation ‘slots’ at expensive steak house restaurants is a good barometer for the economy’s strength. Like the St Louis ‘Stress Index,’ our consistent and precise methodology, over the long term, should help us gain some idea of whether or not the US economy is growing or is under stress, and might begin to shrink. In 2018, we’ll expand our data set and see if our continued belief is supported.
Happy New Year all!
– Terry Liebman


