
SHI 1/3/18: The 10-City SHI

SHI 12/27/17: Sizzling!
December 27, 2017
SHI 1/10/18 The SHI10 and FED Districts
January 10, 2018
She’s HERE! The 10-City SHI is BORN!
At long last, we’re launching our new index: the 10-city SHI. Isn’t she cute!?! Take a look!
Welcome to this week’s Steak House Index update.
If you are new to my blog, or you need a refresher on the SHI, or its objective and methodology, I suggest you open and read the original BLOG: https://www.steakhouseindex.com/move-over-big-mac-index-here-comes-the-steak-house-index/
Why You Should Care: The US economy and US dollar are the bedrock of the world’s economy. This has been the case for decades … and will continue to be true for years to come.
Is the US economy expanding or contracting?
According to the IMF (the ‘International Monetary Fund’), the world’s annual GDP is almost $80 trillion today.
At last count, US ‘current dollar’ GDP is about $19.5 trillion — about 25% of the global total. Other than China — a distant second at around $11 trillion — no other country is close.
The objective of the SHI and this blog is simple: To predict US GDP movement ahead of official economic releases — an important objective since BEA (the ‘Bureau of Economic Analysis’) gross domestic product data is outdated the day it’s released.
Historically, ‘personal consumption expenditures,’ or PCE, has been the largest component of US GDP growth — typically about 2/3 of the total. In fact, the majority of all US GDP increases (or declines) usually result from (increases or decreases in) consumer spending. This is clearly an important metric. The Steak House Index focuses right here … on the “consumer spending” metric.
I intend the SHI is to be predictive, anticipating where the economy is going – not where it’s been. Thereby giving us the ability to take action early.
Taking action: Keep up with this weekly BLOG update. Not only will we cover the SHI, but we’ll explore related items of economic importance.
If the SHI index moves appreciably -– either showing massive improvement or significant declines –- indicating growing economic strength or a potential recession, we’ll discuss possible actions at that time.
The BLOG:
The 10-City SHI is born! Let’s call our newborn the “SHI10.”
Take a look:
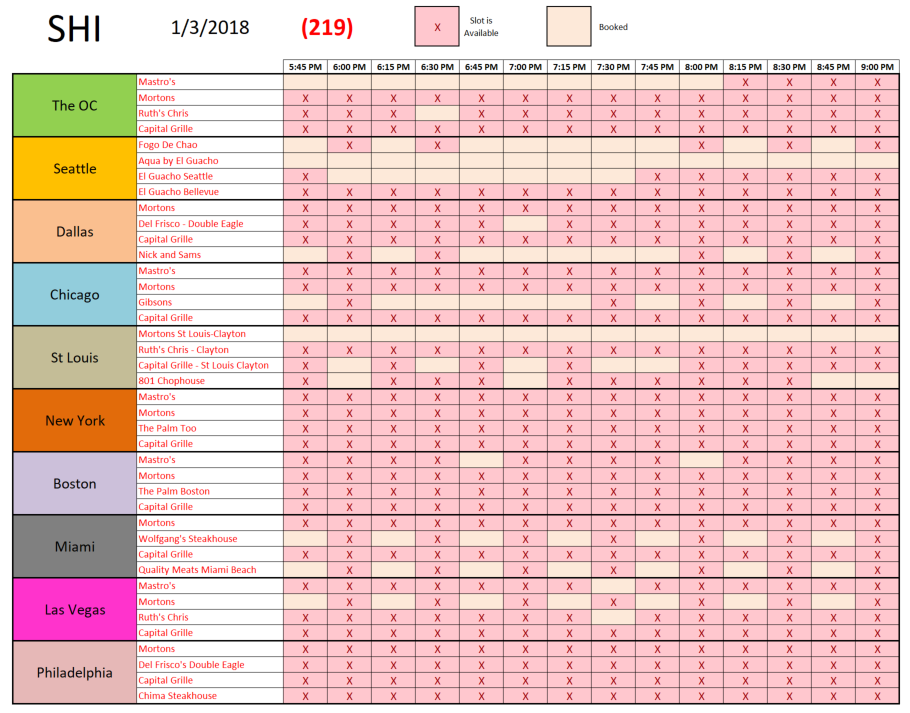
This is our new look/format. In the first column, we see the city. In the second column, you’ll see the names of the expensive local eateries we will track for each city. And, finally, the data itself.
My long-term readers will recall The Economist magazine invented “The Big Mac Index” — or the BMI — back in 1986 as an entertaining way to gauge whether a country’s currency was correctly valued. The theory, simply stated, is that since a Big Mac has identical ingredients – regardless of where it’s made – then it should cost exactly the same amount, regardless of where in the world you buy it. Makes sense. Quoting the Economist, “Burgernomics was never intended as a precise gauge of currency misalignment, merely a tool to make exchange-rate theory more digestible.”
Well, it turns out that after converting the price of the Big Mac from the local currency (where the Big Mac is being sold) into dollars the price actually varies quite a bit, country to country. And this variation indicates whether or not the local currency is over- or under-valued. The URL below uses this example: “…the average price of a Big Mac in America in January 2016 was $4.93; in China it was only $2.68 at market exchange rates. So the “raw” Big Mac index says that the yuan was undervalued by 46% at that time.”
Using a similar theory, I felt the number of available reservation ‘slots’ — at absurdly expensive steak-house restaurants — would be a good indicator of the health of our US economy at any given time. On this foundation, the SHI and now, the SHI10, were born. We will continue to use the same methodology we’ve been using for years:
- Using OpenTable we have selected four (4) well know, very expensive (>$50 per person) and highly rated steak houses (by consumers), operated by national companies, when possible.
- Saturday night is the most popular night of the week to eat out. That’s when restaurants are in the highest demand…the most crowded. And while at home most Americans tend to eat dinner between 6:00 and 7:00, 7:00 to 7:30 pm – with 7:30 pm seeming to be the focal point of highest demand – seems to be the most popular ‘reservation time’. Which means, at times of high demand, those slots will not be available….but slots with ‘lesser’ demand might be open.
- Using OpenTable, I attempt to make Saturday night reservations on the Wednesday immediately preceding the ‘dinner date.’ For a party of 4.
- The matrix above shows the results, with reservation ‘slots’ in 15 minute increments beginning at 5:45 pm thru 9:00 pm.
- Each of the 14 time slots for each restaurant has an assigned value. For example, if a 7:30 slot is available at Ruth’s Chris, this is a bad sign. The most popular time…available? Hmmm…so this is a negative value of (-2). We expect this popular slot to be unavailable, however. Right? After all, we’re making Saturday reservations on Wednesday – the popular times should be booked. So, if this slot is unavailable, this value is only a +0.5. And so on. (Complete index model methodology is available – ask and I’ll gladly post it…or send it to you personally.)
- Using this methodology, the possible weekly range of outcomes is (-44) to a positive 72. Meaning if EVERY reservation slot for the four restaurants – between 5:45 and 9:00 pm – is available, the reading is a -44. If they’re all taken – meaning NO reservations are available, the reading is a positive 72. More likely would be a reading, or index outcome, between these two end points. Thus, with 10 cities, the range of potential outcomes is now a high of 720 (all tables, in all cities, for all restaurants, are fully booked) to a low of negative -440 (no tables are booked at ANY restaurant.)
- Once again, I will chart the SHI10 for each week. As this process will be repeated every week – on Wednesday – over time we will have a meaningful index history which, hopefully, will prove beneficial in forecasting US economic activity.
Our first reading for the SHI10 is a negative 219. This is an weak reading. Everyone must still be full from their New Year’s Eve celebrations. But we saw a similar outcome on 1/4/17 when the SHI fell from a positive 56 the prior week to a reading of negative 3. So today’s SHI10 reading is directionally consistent.
Every Wednesday, from here on, we’ll get a new SHI10 index reading. Check back weekly and see how our newborn grows and develops. Will she be economically cooperative or petulant? Time will tell!
– Terry Liebman


