
SHI 1/10/18 The SHI10 and FED Districts

SHI 1/3/18: The 10-City SHI
January 3, 2018
SHI 1/17/18: Where is Inflation?
January 17, 2018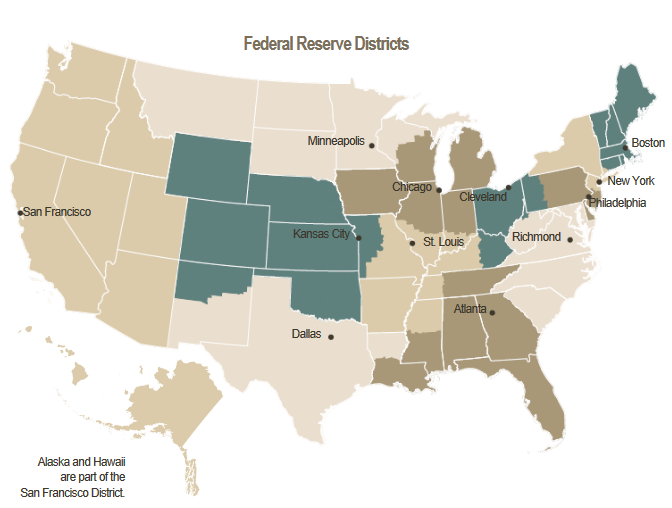
Most of the cities included in our SHI10 are also FED districts.
Take a look at the map above.
Is this an important or meaningful fact? Yes. Eight times a year, the Federal Reserve produces a document called the Beige Book. The FED describes the Beige Book:
“Commonly known as the Beige Book, this report is published eight times per year. Each Federal Reserve Bank gathers anecdotal information on current economic conditions in its District through reports from Bank and Branch directors and interviews with key business contacts, economists, market experts, and other sources. The Beige Book summarizes this information by District and sector. An overall summary of the twelve district reports is prepared by a designated Federal Reserve Bank on a rotating basis.”
You’ll note their information is anecdotal — as is the SHI10. And like the SHI10, it’s worth following. Here’s the link: https://www.federalreserve.gov/monetarypolicy/beige-book-default.htm
The next Beige Book will next be published in 1 week.
Welcome to this week’s Steak House Index update.
If you are new to my blog, or you need a refresher on the SHI10, or its objective and methodology, I suggest you open and read the original BLOG: https://www.steakhouseindex.com/move-over-big-mac-index-here-comes-the-steak-house-index/
Why You Should Care: The US economy and US dollar are the bedrock of the world’s economy. This has been the case for decades … and will continue to be true for years to come.
Is the US economy expanding or contracting?
According to the IMF (the ‘International Monetary Fund’), the world’s annual GDP is almost $80 trillion today.
At last count, US ‘current dollar’ GDP is about $19.5 trillion — about 25% of the global total. Other than China — a distant second at around $11 trillion — no other country is close.
The objective of the SHI10 and this blog is simple: To predict US GDP movement ahead of official economic releases — an important objective since BEA (the ‘Bureau of Economic Analysis’) gross domestic product data is outdated the day it’s released.
Historically, ‘personal consumption expenditures,’ or PCE, has been the largest component of US GDP growth — typically about 2/3 of the total. In fact, the majority of all US GDP increases (or declines) usually result from (increases or decreases in) consumer spending. This is clearly an important metric. The Steak House Index focuses right here … on the “consumer spending” metric.
I intend the SHI10 is to be predictive, anticipating where the economy is going – not where it’s been. Thereby giving us the ability to take action early.
Taking action: Keep up with this weekly BLOG update. Not only will we cover the SHI, but we’ll explore related items of economic importance.
If the SHI index moves appreciably -– either showing massive improvement or significant declines –- indicating growing economic strength or a potential recession, we’ll discuss possible actions at that time.
The BLOG:
There are 12 districts in the Federal Reserve system. Six of them, notably …
- Dallas
- Chicago
- St. Louis
- New York
- Boston
- Philadelphia
… are also included in our SHI10.
The most recent Beige Book, published on 11/29, made this comment on “Overall Economic Activity:”
“Economic activity continued to increase at a modest to moderate pace in October and mid-November, according to anecdotal reports from contacts across the 12 Federal Reserve Districts. There was a slight improvement in the outlook among contacts in reporting Districts. Pre-holiday reports of consumer spending on retail and autos were mixed but largely flat; still, the outlook for holiday sales was generally optimistic. Many Districts highlighted growth in the transportation sector, although the New York District reported a slight softening and the San Francisco District noted that Northern California wildfires temporarily reduced shipping volumes. Residential real estate activity remained constrained, with most Districts reporting little growth in sales or construction. By contrast, nonresidential activity was consistent with previous reports of slight growth. Loan demand was steady to moderately stronger. All Districts reported that manufacturing activity expanded during the reporting period, with most describing growth as moderate. Among reporting Districts, manufacturing contacts predominantly expected activity to continue to pick up, although the Philadelphia and St. Louis Districts noted signs of a slowdown.”
Summarizing, per the Beige Book, our economy is:
- improving, at a moderate rate
- the wildfires in CA had adversely impacts
- residential real estate activity is constrained
- commercial real estate is showing slight growth
- manufacturing expanded, except in Philadelphia and St. Louis
Over time, we’ll have the opportunity to compare our anecdotal SHI10 results to the regional Beige Book commentary for the 6 cities we both track. It should prove interesting.
OK…let’s take a look at today’s SHI10:
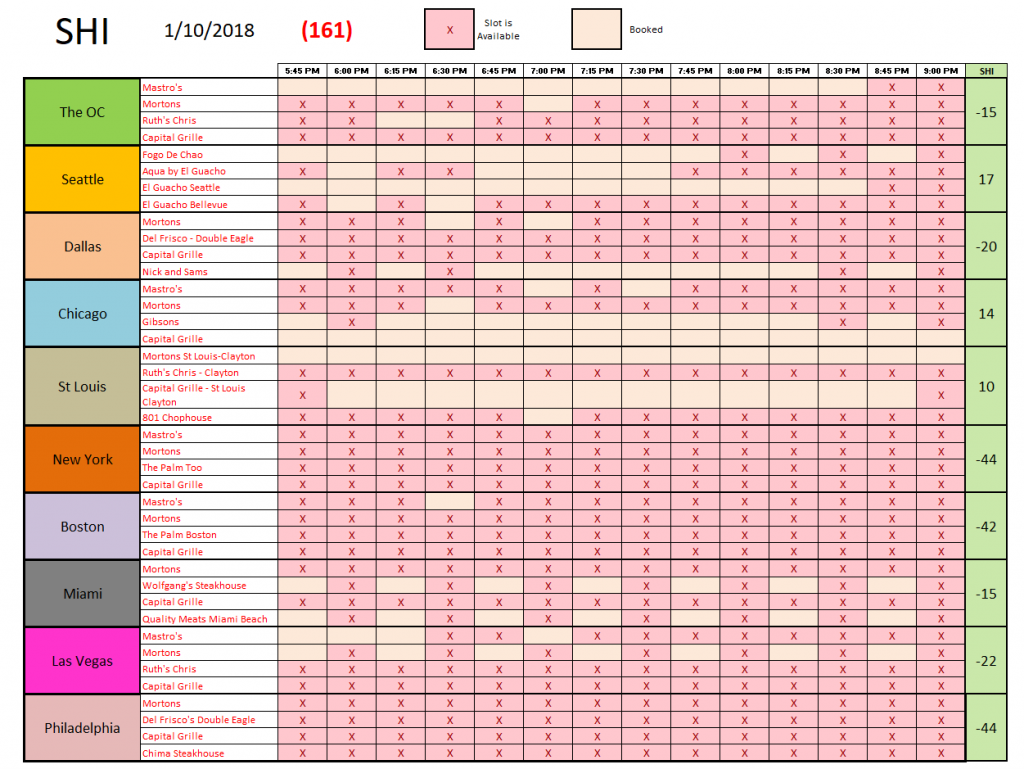
Two cities — New York and Philadelphia — have no booked time-slots. Not one. Boston has only 1 booked slot. Hmmm…all 3 are in the northeast … I don’t think I’m too far out on a limb suggesting the weather may be keeping people at home. A ‘windchill’ temperature of negative 30 will do that. Apparently even a piping hot Ribeye isn’t enough to entice well-heeled diners out of their homes.
This week’s SHI10 reading is (161). It’s worth noting that three restaurants — two in Miami and one in ‘Vegas — appear booked at 5:45 and every 1/2 hour thereafter. It’s possible those 3 restaurants do not accept reservations for those time slots. Regardless, I believe as long as we’re consistent when applying our methodology, and reflect those time-slots as ‘booked’ — as the OpenTable website reported — this should not impact our outcome. Consistency trumps all. (No pun intended. Probably.)
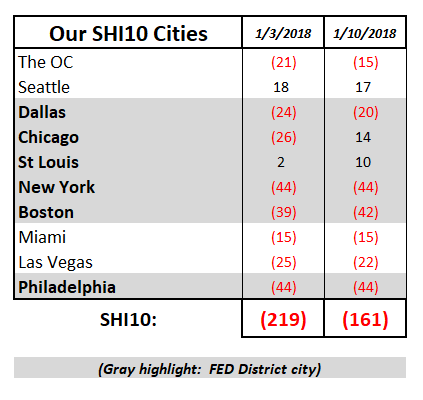
Here is our new SHI10 summary, showing the results in each of the 10 cities. This image will replace the long-term trend report image we’ve been using in the prior SHI:
Finally, I’d like to extend a hearty ‘Thank You!’ to Kyle Anderson for his help and collaboration in conceiving and researching the SHI10. He was a big help … and continues to assist with the weekly data collection activities. Thanks again, Kyle!
- Terry Liebman


