
SHI 12.7.22 – The Most Boring Book Ever Written

SHI 11.30.22 — What The Heck is ‘Value’ Anyway?
November 30, 2022
SHI 12.14.22 — The Law of Large Numbers
December 14, 2022
Right. It’s that boring. Trust me.
In fact, you’ll have to trust me. Because there’s no way you’ll ever read this book. For two reasons. First, consider the name of the book: ‘A History of Interest Rates.’ That’s right. The history of interest rates … going back to the earliest, prehistoric days of mankind. A page-turner, right? We’ve all been admonished “do not judge a book by its cover,” but this time you can. Even the cover is boring. The most fascinating thing on the cover are the words “Fourth Edition.” That’s right! This book has been updated four times since the first publishing in 1962!
Which I find rather amazing since I’m pretty sure they’ve sold only two copies of the book: One to me, and the other to the author’s mom. 🙂
“
The Code of Hammurabi?”
“
The Code of Hammurabi?”
Yes, the book assures us “early finance” really got going after the ‘Code of Hammurabi’ was written around 1800 BC, in which many of the earlier Sumerian customs were codified. That’s right: 1800 BC.
The first chapter is entitled, “Prehistoric and Primitive Credit and Interest.” Really? Somehow, we have data from prehistoric times? Maybe not: The author only surmises borrowing and lending occurred back then, commenting “even before the development of common measures of value … credit probably existed.” Probably. Jumping to Chapter 2, the author assures us that in ancient Sumner – around 3000 BC – ‘barley’ was the actual medium of exchange for most borrowing and lending transactions.
And I learned all this in the first 31 pages of the book!
OK, ok, enough “book bashing.” This book really is the best source I’ve ever seen on all human activity in borrowing and lending. That the author was able to aggregate this information is quite amazing — remember, we’re going back over 12,000 years here! The book has 710 pages densely-packed pages with data, text, charts covering the human history of lending and rates in prehistoric times … Mesopotamia … Greece … Rome … all the way thru the ‘Dark Ages,’ Medieval’ times, the Renaissance … and finishes up around now. I have no idea how the author found all the data. Amazing.
Where am I going with this, you ask? Well, I have two points: First, clearly, you never want to ask me, “So, what do you think about today’s interest rates?” The question might tee-up a rather long response. 🙂
But in last week’s blog, I promised you a contrarian viewpoint to the rather rosy and optimistic picture presented therein, specifically comments on the Case-Shiller Index and today’s heavily inverted ‘yield-curve’. Both topics have been media darlings in recent months … so let me see if I can introduce a slightly different perspective. Let’s begin with the very first yield curve drawing from centuries ago, discovered by British archeologists on a cave wall in ancient Syria.
Welcome to this week’s Steak House Index update.
If you are new to my blog, or you need a refresher on the SHI10, or its objective and methodology, I suggest you open and read the original BLOG: https://www.steakhouseindex.com/move-over-big-mac-index-here-comes-the-steak-house-index/
Why You Should Care: The US economy and US dollar are the bedrock of the world’s economy.
But is the US economy expanding or contracting?
Expanding. At the end of Q3, 2022, in ‘current-dollar’ terms, US annual economic output rose to $25.66 trillion. So far this year, America’s current-dollar GDP has increased at an annualized rate exceeding 7.1%. The world’s annual GDP rose to about $95 trillion at the end of 2021. America’s GDP remains around 25% of all global GDP. Collectively, the US, the euro zone, and China still generate about 70% of the global economic output. These are the 3 big, global players.
The objective of this blog is singular.
It attempts to predict the direction of our GDP ahead of official economic releases. Historically, ‘personal consumption expenditures,’ or PCE, has been the largest component of US GDP growth — typically about 2/3 of all GDP growth. In fact, the majority of all GDP increases (or declines) usually results from (increases or decreases in) consumer spending. Consumer spending is clearly a critical financial metric. In all likelihood, the most important financial metric. The Steak House Index focuses right here … on the “consumer spending” metric. I intend the SHI10 is to be predictive, anticipating where the economy is going – not where it’s been.
Taking action: Keep up with this weekly BLOG update. Not only will we cover the SHI and SHI10, but we’ll explore “fun” items of economic importance. Hopefully you find the discussion fun, too.
If the SHI10 index moves appreciably -– either showing massive improvement or significant declines –- indicating growing economic strength or a potential recession, we’ll discuss possible actions at that time.
The Blog:
I’m kidding, of course. The “yield-curve” is a modern creation. Many academicians and economists study it closely … using its positive or negative slope as a forward indicator for the economy. And right now, it’s quite negative — or “inverted.”
In 2018, the Chicago FED commented:
“… the results … do not imply that a yield-curve inversion causes a recession. Rather, it could be that the slope itself fluctuates to reflect changing expectations about the economy, and these expectations are useful predictors of economic downturns.”
So, essentially, we’re not talking “cause” and “effect”here … but more about aggregate expectations and possibilities. And in many prior instances in the past, when the yield-curve was this steeply inverted, a recession was not too far off. I’ve covered this topic in quite a few prior blogs. Here are a couple from 5 or 6 years ago … take a look:
https://steakhouseindex.com/understanding-the-yield-spread/
https://steakhouseindex.com/another-look-at-the-yield-spread/
I’ll spare you any additional eye strain on this topic … except for this last image, courtesy of the NY FED. According to their model, the ‘probability’ the US will enter a recession within the next 12 months is, at present, about 38%. About 1 in 3. Not very high. Here’s a graphic demonstrating their viewpoint:
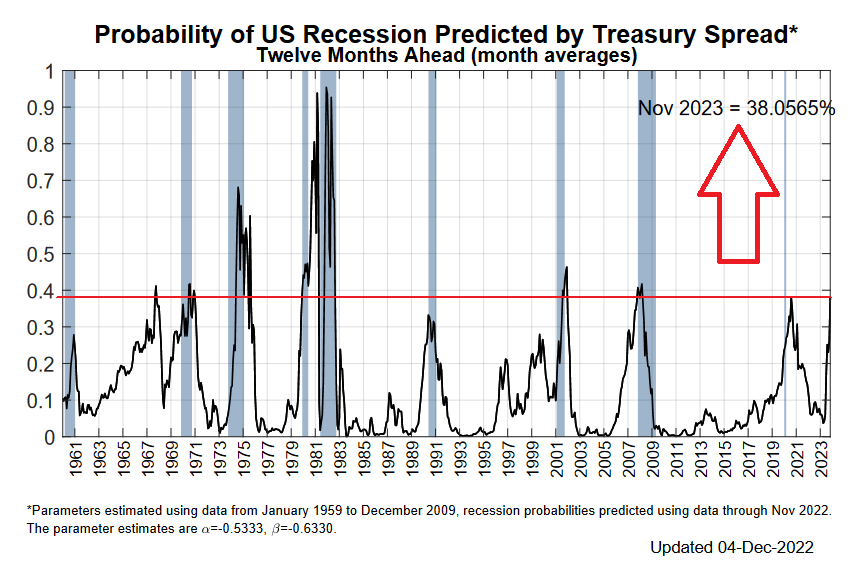
As we see above, negative treasury spreads did accurately predict a 1-year forward recession many times. But not in 2020. Because the pandemic turned the economics ballgame on its head. These are exceptionally unusual times.
So. According to the NY FED, we have a 1 in 3 chance — at least today — that the US will enter a general recession in 2023.
At the moment, I’m still in the other camp. I am not yet a recession-ista … but I do agree there will be winners and losers in the next 12 months. Industries that are heavily reliant on interest rates — such as existing home sales and used car sales — will be severely impacted. The stock market gurus don’t talk about ‘industries’ as much as they talk about ‘sectors.’ Here’s a chart from mid-year, courtesy of Schwab, discussing which sectors perform better … or worse … in a “rate-hike” environment:
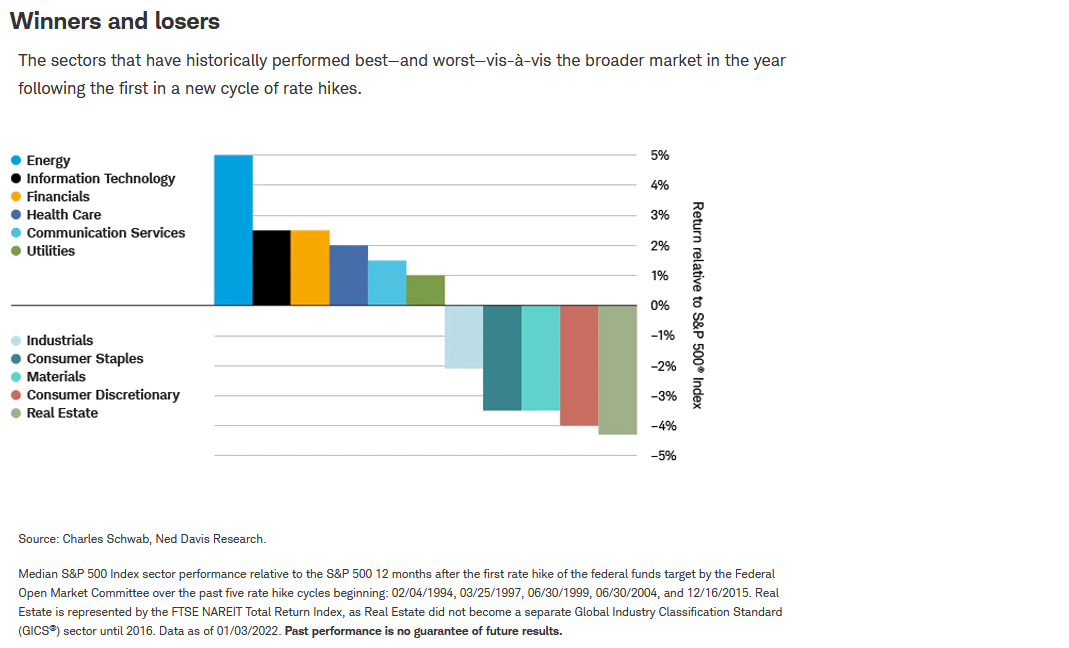
The chart paints an interesting picture: Energy — it presumed — would do well in 2022. It has.
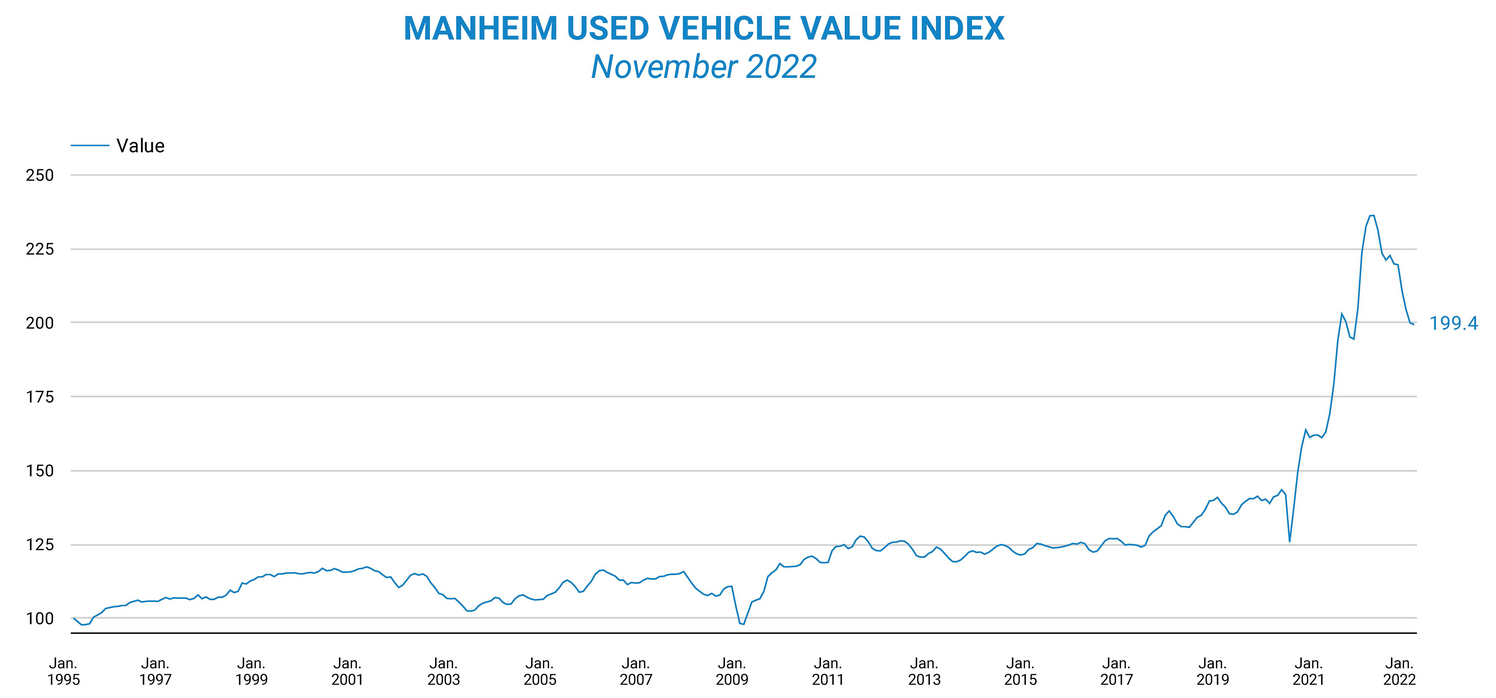
Real estate, they expected, would do poorly. And that’s probably been the case as well. Existing home and used-car sales. Ouch for both. We all know home sales have fallen off a cliff … and, as the Manheim index below demonstrates, we see the same in used car sales. Not pretty.
Speaking of “not pretty” in the used car space, the ‘Carvana‘ stock price tells the whole story. Carvana is a creative “online used car retailer” that went public during the pandemic. Within the past year, the stock traded at a high of over $274 per share. Today, it trades at about $3.80 — a decline of over 98%. Investors fear it may enter bankruptcy soon, courtesy of the 2022 FED rate hikes.
Clearly, some of the pandemic-darling industries and sectors are now in recession. Again, thanks to the FEDs exceptionally swift rate increases. Alternatively, some pandemic-losers are now doing exceptionally well — for example, leisure travel. And restaurants. Both of which were crushed during the pandemic.
There is no doubt that high interest rates and recession jawboning both have a debilitative impact. The more often we hear the word recession, the more worried we become. Rate hikes and fear are corrosive. And the longer both both last, the greater the potential for a recession. But for now, other than a few highly interest rate sensitive sectors, I do not forecast a 2023 recession. However, like the FED I am data-dependent. Let’s see what develops. 🙂
Shall we head to the steakhouses?
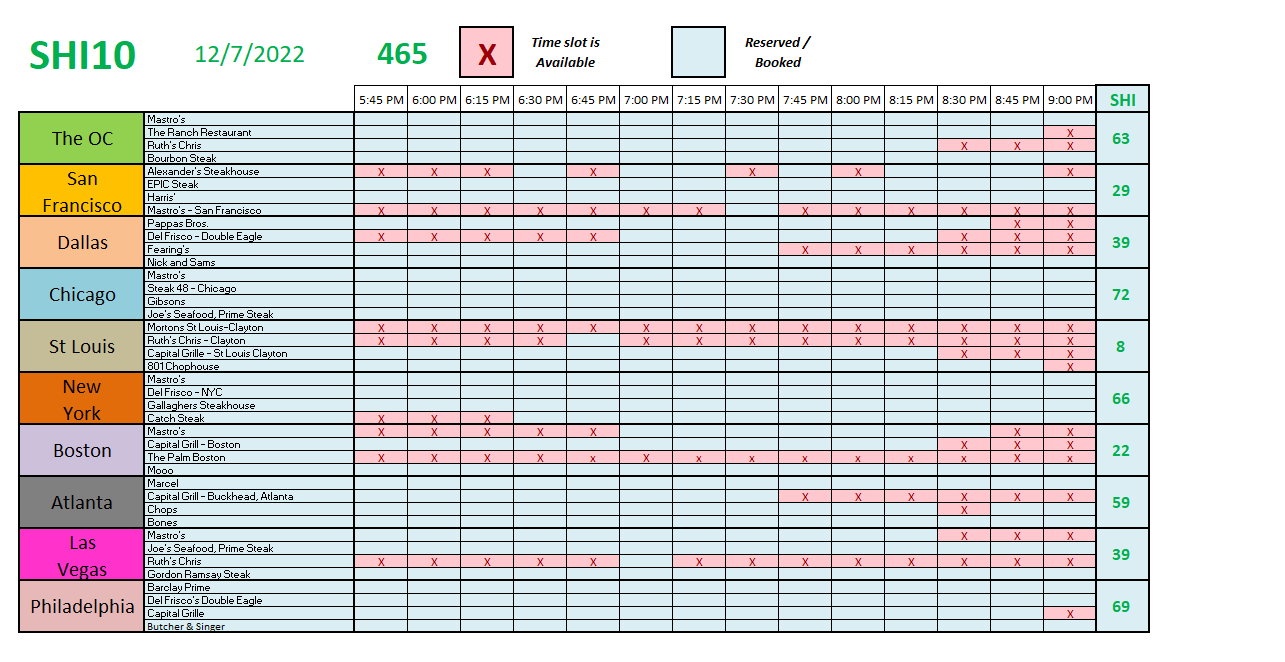
I’ve changed the SHI color to ‘green’ because it is! Every market is in the green! And look at Chicago. Not a reservation to be had, in any time slot, this coming Saturday in any of our SHI restaurants. And most other markets show meaningful improvement in demand this week. ‘Tis the season I guess.
Here is the longer-term trend chart:
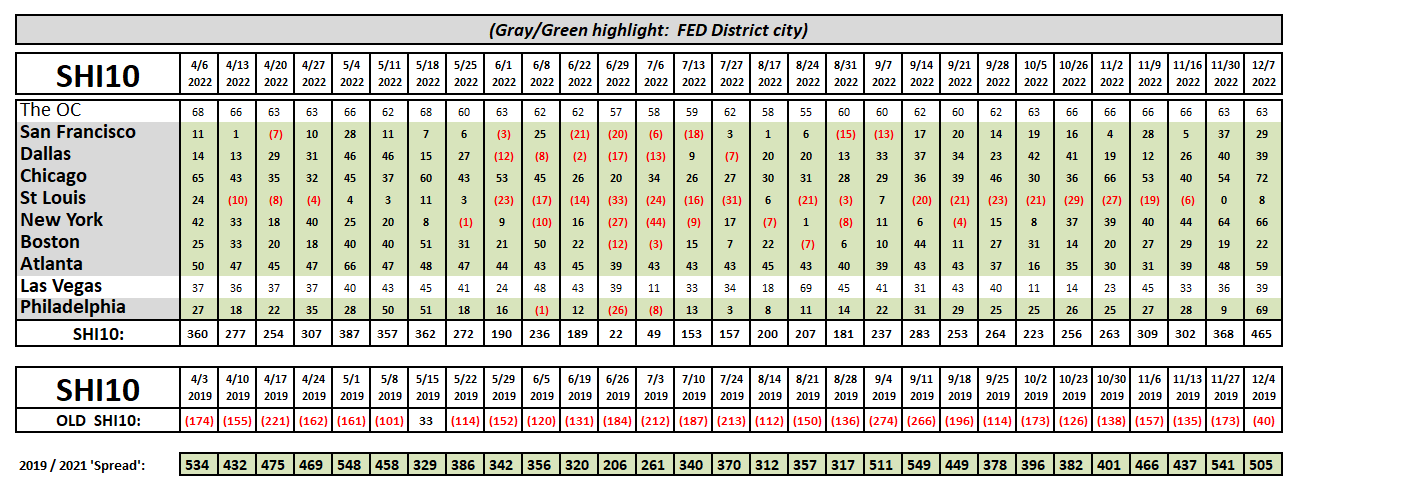
Clearly, our expensive steak houses don’t know a recession is imminent. They’re doing just fine this week.
I’ll finish this week’s blog with an important discussion about interest rates. Remember, I own the book … so I can talk interest rates!
Consider this “long-term rates” image clipped from page 560 of the book:
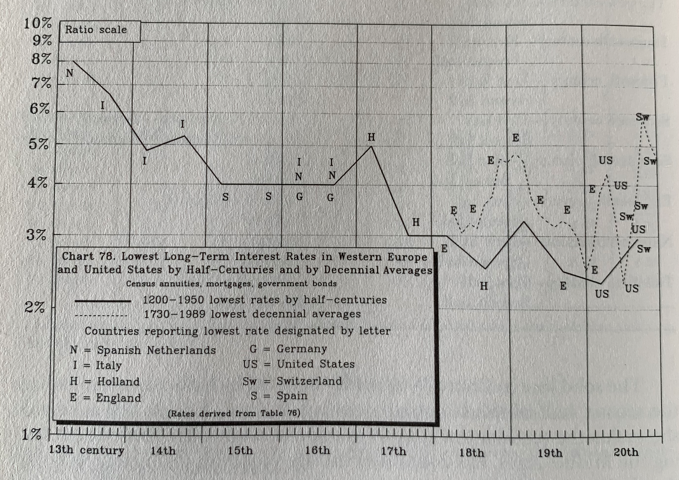
Yes, this chart begins in the “13th century”. Amazing. Here’s the first important take-away:
Long term interest rates have been declining for centuries.
But the decline accelerated beginning in the 18th century. Now, fast forwarding to the more recent past, here’s an image from the St Louis FED:
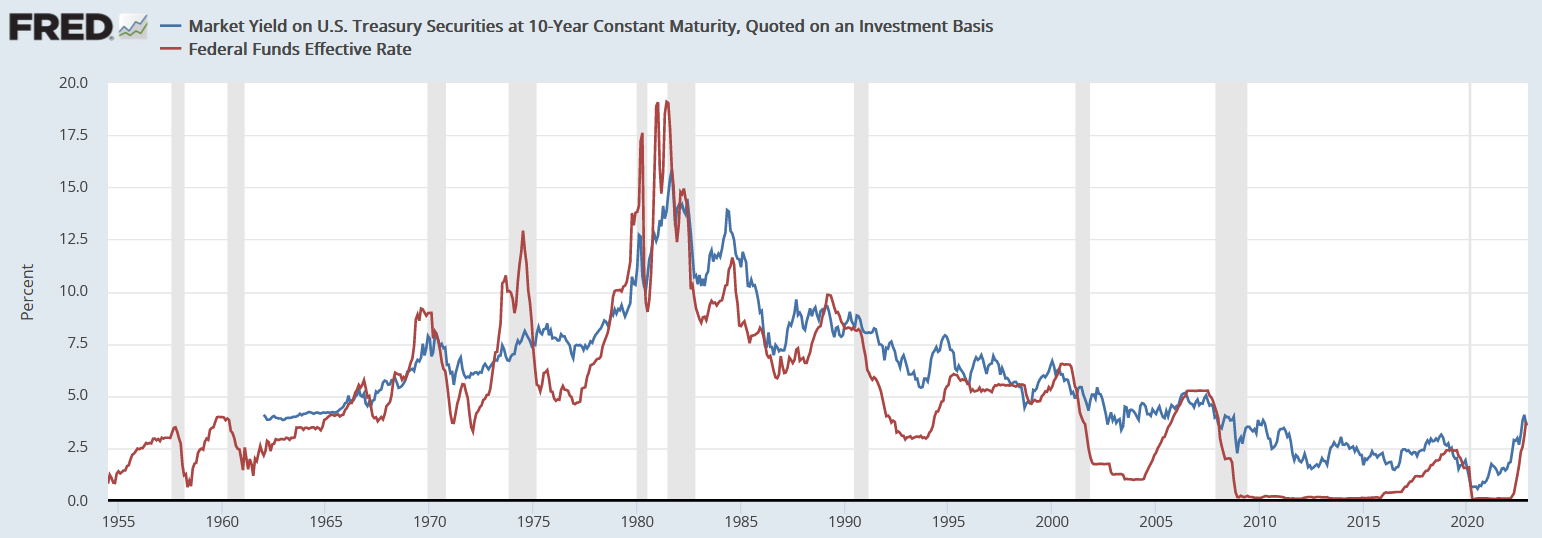
The reddish line represents the official risk-free, shortest-term, ‘overnight’ rate. The blue line, the risk-free 10-year lending rate. The graph goes back about 65 years. The duration and data are sizable and they tell us one thing: Both short- and long-term rates go up very fast — when the FED is at the switch. But while short-term rates also fall very quickly in a FED-induced reduction cycle, long-term rates decline very slowly. In every instance where the reddish line quickly moved down, the blue line took much longer — often years longer — by comparison.
Here’s important point number two:
While real estate rates will eventually move lower, it may be years before they approach prior low levels.
Summarizing: Long-term rates are in a general decline … however, the FED engineered spike may keep long-term rates at artificially high levels for a few years. It’s unlikely you’ll be refinancing your home loan any time soon … but I suspect you’ll get another chance after 2025. Probably not before. Be patient. 🙂
<:> Terry Liebman


