
SHI 2.22.23 — Scary Pictures

SHI 2.8.2023 — Efficiency is the Word
February 8, 2023
SHI 3.1.23 — Home Values and Inflation
March 1, 2023
Hollywood doesn’t have a monopoly on scary pictures.
They come from Washington DC, too. The scariest picture I saw this month came from the Congressional Budget Office and their report:

At first glance, this picture may not scare you much. Just wait. I guarantee that will change when you read my blog. But let me first offer a stiff warning: You may want to stop reading here and now. Not only am I certain the pictures below will scare the bejesus out of you, unlike the Hollywood ‘fear-flixs’ like “Halloween 13“, you won’t find them even mildly entertaining. Not one bit. I suspect the words sad, disappointing, and frightening would be better descriptors. In fact, you may wonder why I even brought up the entire topic? Good question. 😐
“
A gratuitous fright blog?”
“
A gratuitous fright blog?”
No. While today’s blog has very little actionable value — and, again, it isn’t entertaining in the least — I feel compelled to share the CBO report, as I doubt you’ve seen it. In fact, on the off chance you want to take a deeper dive, here’s the link:
https://www.cbo.gov/system/files/2023-02/58848-Outlook.pdf
In theory, the Congressional Budget Office is nonpartisan. Which means, again in theory, their economic forecasts are not influenced by the party controlling the Presidency or the Legislatures. I’ve reviewed quite a few of their reports and I will agree they seem to reflect a relatively neutral political stance. But I’ll leave the CBO impartiality question to you.
But impartial or not, I feel “being informed” is inherently valuable. Which is why I’m sharing the report and my take-aways. Frightening, in this case, certainly. But valuable. Intrigued? Read on.
Welcome to this week’s Steak House Index update.
If you are new to my blog, or you need a refresher on the SHI10, or its objective and methodology, I suggest you open and read the original BLOG: https://www.steakhouseindex.com/move-over-big-mac-index-here-comes-the-steak-house-index/
Why You Should Care: The US economy and US dollar are the bedrock of the world’s economy.
But is the US economy expanding or contracting?
Expanding. At the end of Q3, 2022, in ‘current-dollar’ terms, US annual economic output rose to $25.74 trillion. Thru Q3, America’s current-dollar GDP has increased at an annualized rate exceeding 7%. The world’s annual GDP rose to over $100 trillion during 2022. America’s GDP remains around 25% of all global GDP. Collectively, the US, the euro zone, and China still generate about 70% of the global economic output. These are the 3 big, global players.
The objective of this blog is singular.
It attempts to predict the direction of our GDP ahead of official economic releases. Historically, ‘personal consumption expenditures,’ or PCE, has been the largest component of US GDP growth — typically about 2/3 of all GDP growth. In fact, the majority of all GDP increases (or declines) usually results from (increases or decreases in) consumer spending. Consumer spending is clearly a critical financial metric. In all likelihood, the most important financial metric. The Steak House Index focuses right here … on the “consumer spending” metric. I intend the SHI10 is to be predictive, anticipating where the economy is going – not where it’s been.
Taking action: Keep up with this weekly BLOG update. Not only will we cover the SHI and SHI10, but we’ll explore “fun” items of economic importance. Hopefully you find the discussion fun, too.
If the SHI10 index moves appreciably -– either showing massive improvement or significant declines –- indicating growing economic strength or a potential recession, we’ll discuss possible actions at that time.
The Blog:
Ready? Here’s the scariest picture you’ll see this year out of Hollywood or Washington:
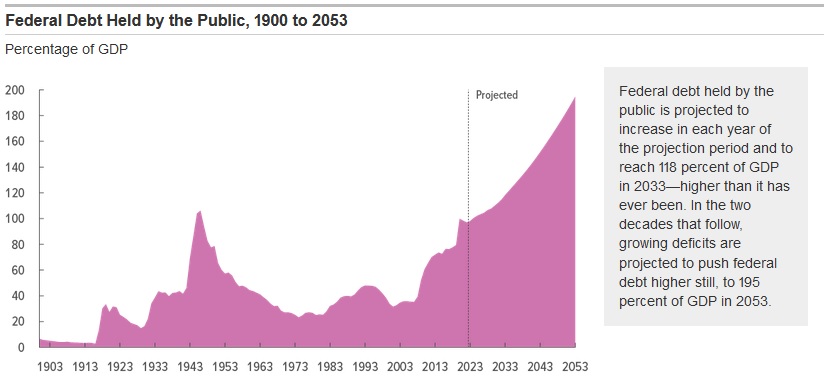
The trajectory that pink chart is downright chilling. The CBO is predicting US federal debt will rise to 195% of our annual GDP by 2053 — 30 years from now. And because our (forecasted) annual deficit grows at an increasing rate, the issue will get worse year after year. Per the CBO.
Scared yet? You should be. I am.
The irony here so thick you could cut it with a steak knife. On one hand, the CBO expects US government spending will grow significantly year after year. At the same time, FED interest rate hikes further exacerbate the growing-debt problem by piling more and more interest on top. Consider this: In years to come, the annual interest expense will make a significant contribution to our ballooning federal debt.
This is a relatively new problem. For about a decade, near-zero federal interest rates kept interest costs relatively low. If one can call $500 billion per year ‘relatively low.’ But by Q4 of 2022, the annualized run rate had increased to over $850 billion.
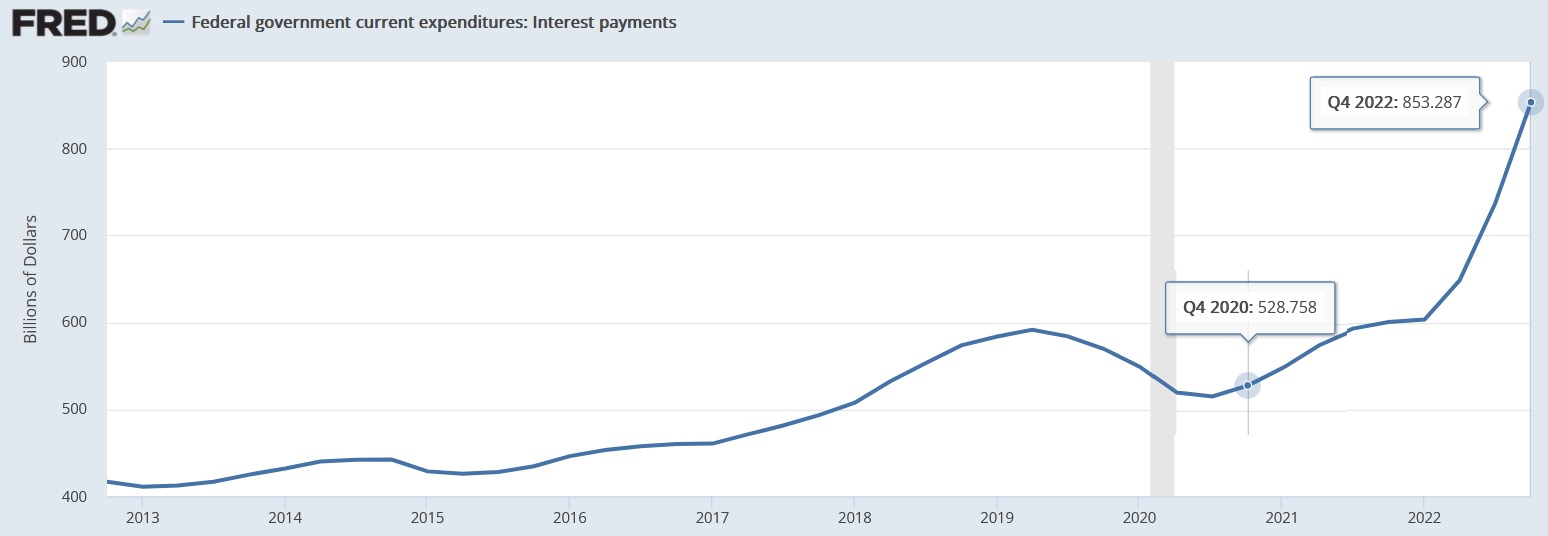
Our annual interest expense hasn’t doubled yet … but it’s getting close. And that’s irony I’m talking about. It’s self-imposed. Thru the actions of the FED, the federal government is voluntarily increasing its own interest expense. When the FED raises interest rates, the impact on the cost of federal debt is immediate and direct.
Can you imagine walking into to your bank and asking the bank to double your interest rate and expense on your car or house. Why would you do that? Why would any sane person do that? Well, that’s precisely what the FED did beginning in 2022. And now the CBO expects the 10-year Treasury to remain at 3.8% for 10 years.
Just 2 years ago, the US Treasury could have sold 30-year debt at less than 1.25%. Not today. That ship has sailed.
Even worse, as interest will be owed on a (forecasted) growing pile of debt, the compounding of rate and amount kicks up annual interest expense into the stratosphere. Added to the other ‘mandatory’ and ‘discretionary’ expenditures, the forecasted US annual deficit will skyrocket — with no end in sight:
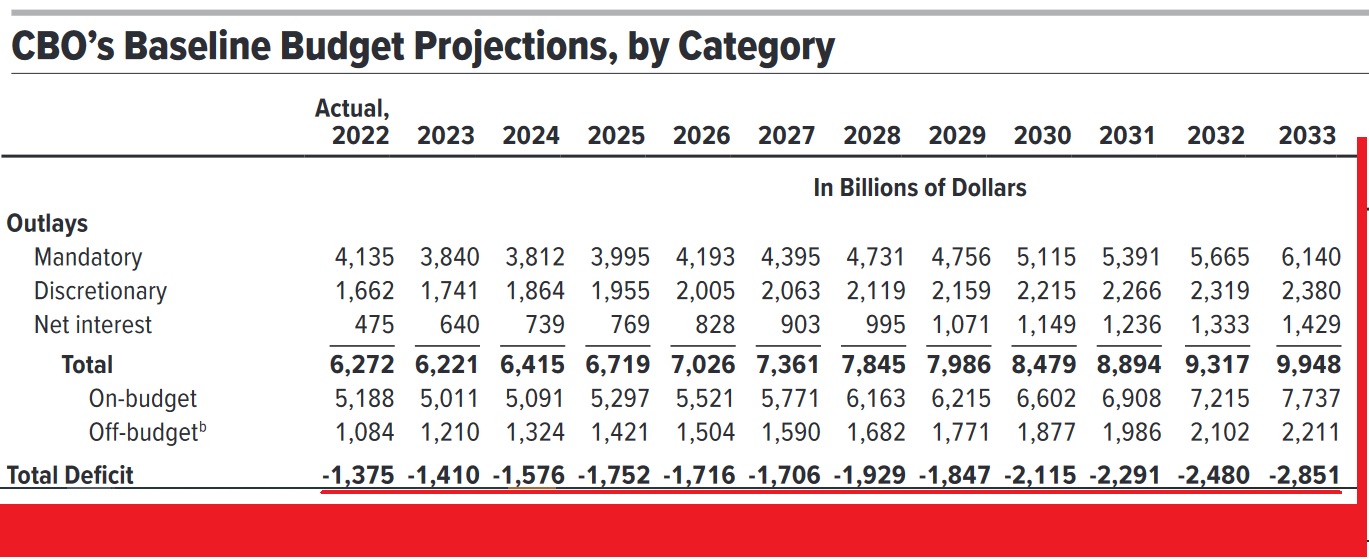
Yes, that is a lot of red ink. Like me, I suspect you want to look away, but you can’t. It’s like watching a train derailment in slow motion. Both terrifying and compelling.
Here are the CBOs words on the topic of “Deficits and Debts:”
“In CBO’s projections, federal deficits rise from 6.9% of GDP in 2033 to 11.2% of GDP in 2053. That projected growth in total deficits is largely driven by increases in interest costs and spending on Medicare.”
Frightened yet? Keep reading.
From 1973 thru 2022 — about 50 years in all — our federal government collected an average of 17.4% of annual GDP in total tax revenues. This is a useful CBO visualization — and the chart below will help. The “green line” is the revenue line:
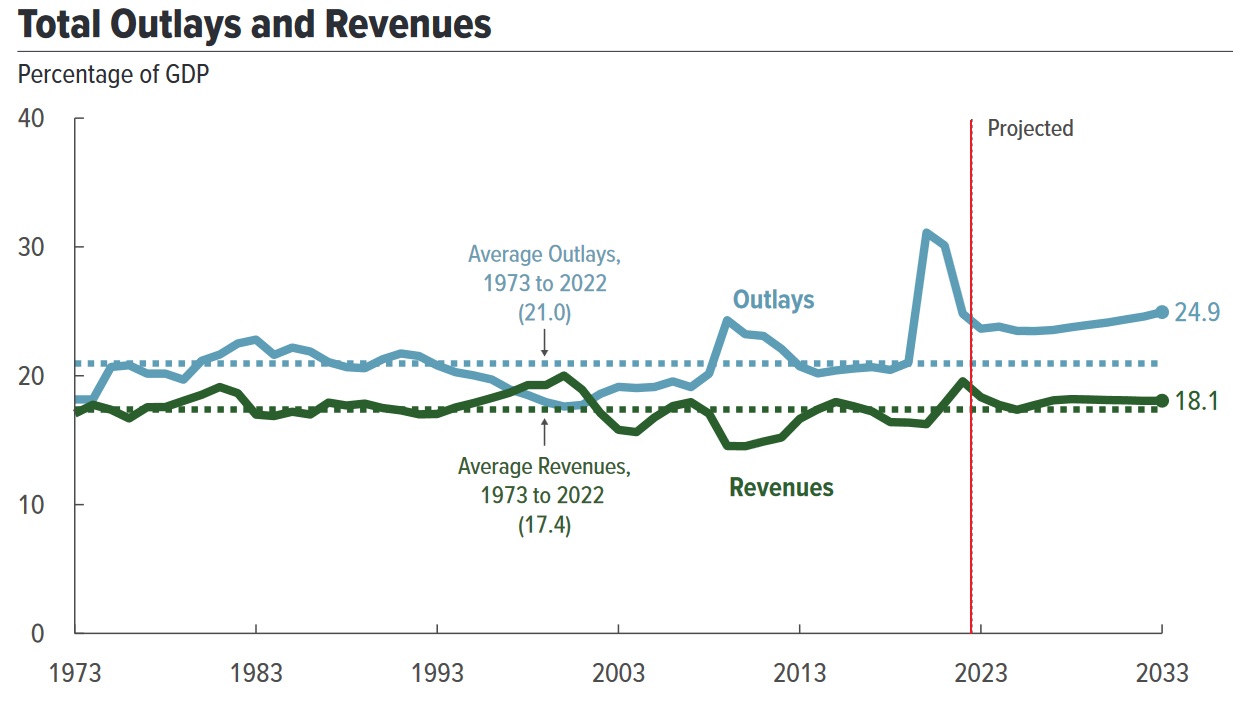
The “blue line” is the spending line. Spending averaged 21% of GDP during that same almost 50-year span. The difference between what was collected and what was spent, of course, equaled the annual deficit. As we see above, the CBO is projecting spending will be almost 25% of GDP by 2033. Even worse,
“Total outlays increase from 24.9% of GDP in 2033 to 30.2% in 2053 in CBO’s projections.
Rising interest costs … are significant drivers of that increase.”
Growth in Medicare and Social Security expenses play a large role. America’s population is aging. Our collective “average age” increases every year. This is an unavoidable fact. With more folks turning 65 every year, spending will also increase every year.
Back to the FED. We know the FED is tasked with “maintaining price stability.” They would argue they had no choice but to current raise rates given the conditions. I won’t disagree. I only wish the FED and the Treasury chatted more and “refinanced when rates were low.” Like many of us did with our home loans.
If the CBO forecast comes to pass … and the US spends over $1 trillion on interest in 2029, I wonder how the 2030 FED chairman might respond to this question:
“Mr. Chairman, in light of the fact that interest on US debt is now responsible for more than half the annual deficit — and interest cost alone was almost $5 trillion over the past five years — would the US and the US taxpayer have been better off had Chairman Powell and Treasury Secretary Yellen refinanced $10 or $15 trillion of that debt into super-low-rate, long-term debt when rates were at generational lows?”
Ahhhh …. hindsight is a wonderful thing.
Sure, it’s a nonsensical question. Our government doesn’t simply work that way. Unfortunately. You and I might think that way … but not Uncle Sam. Let’s see what the steak houses tell us about the economy this week.
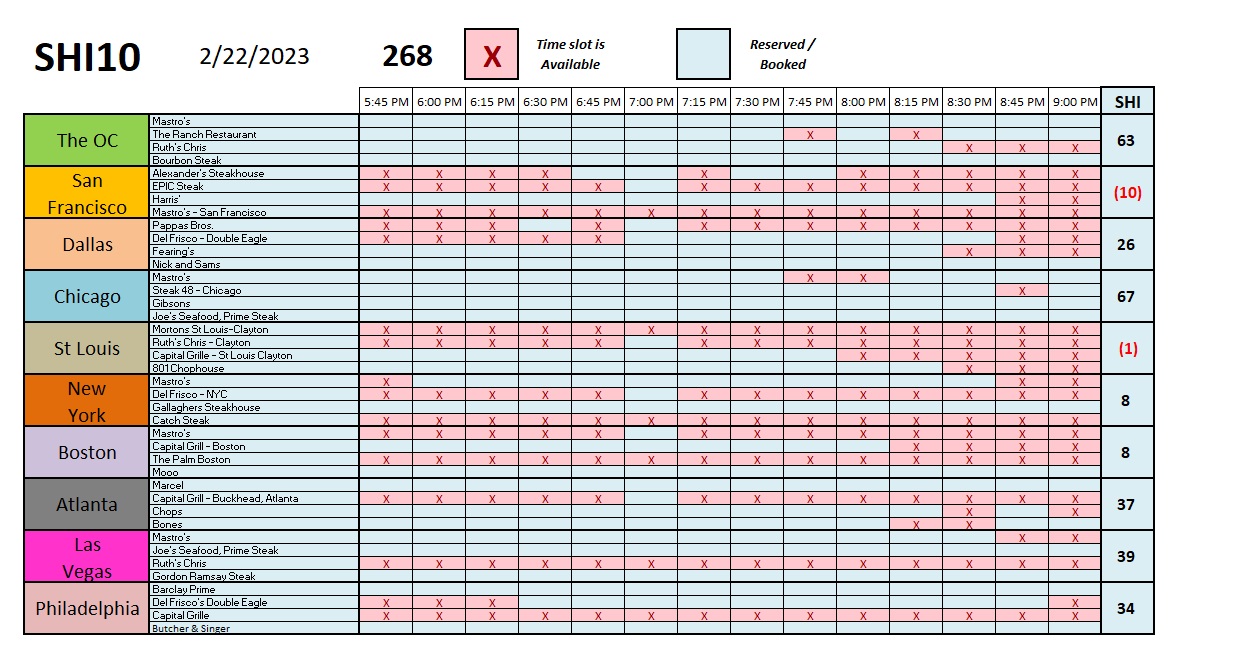
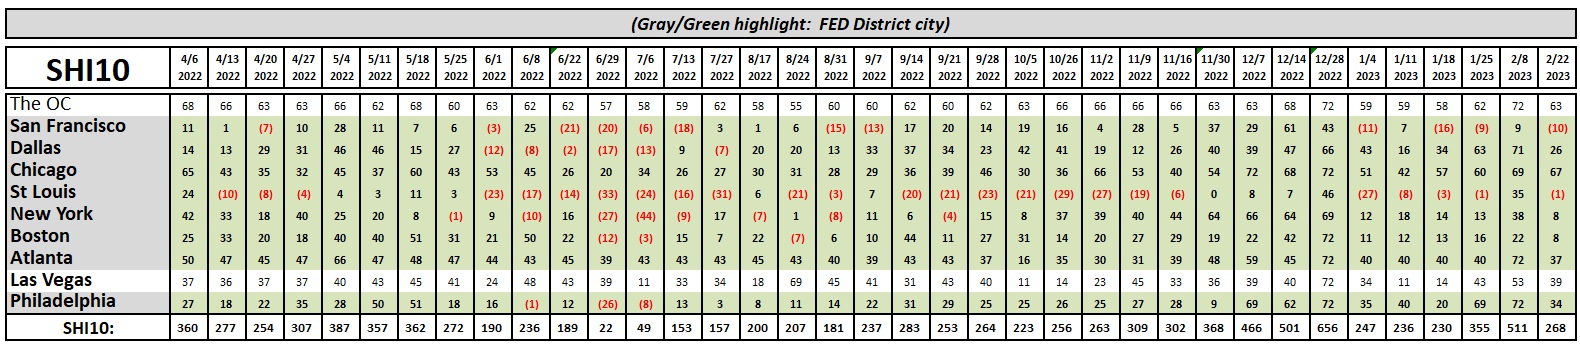
Clearly, the ‘Valentine’s Day‘ effect is behind us … and this week’s SHI10 is once again consistent with many of the readings over the past few months. Look closely at the St Louis and Atlanta numbers. The spike in reservation demand on 2/8 is easy to see, but this week’s SHI number is almost identical to the reading from the weeks preceding. Very, very consistent.
I just returned from a brief Las Vegas trip. The city was very busy … again, not a recession in sight. While I didn’t have the opportunity to dine at any of our four ‘Vegas steakhouses, I did walk by ‘Gordon Ramsey Steak’ one afternoon. As you know, this restaurant is almost always fully booked — just as it is this coming Saturday. Their menu is on display at the entrance … take a look at this beefy section:

Chef Ramsey will not make you a steak for less than 70 bucks … and most steak options are $100 or more — per person! I have no doubt dinner would easily run $200 or more per person — and this restaurant is almost always fully booked. Clearly, both high-dollar steaks and the ‘Vegas economy are sizzling!
Let me finish with a few final comments on the CBO report.
Who knows? Maybe the CBO is wrong. Perhaps the national debt picture is not as dire as it looks.
For example, it’s worth noting that the CBO uses “real” GDP in their predictions. As they also forecast inflation at 2% per year, “nominal” or current GDP is significantly higher. It’s worth noting that our national debt is always quoted in current dollars. The interest expense is quoted in current dollars. So why not present both real and current-dollar figures in the GDP forecasts?
Extrapolating, current-dollar GDP would be about $5 trillion higher in 2033 using the CBO figures. And ignoring compounding, more than 60% higher in 2053, Extrapolating again, this means per CBO forecasts, US public debt would be about 122% of current-dollar GDP in 2053. Thru that lens, the picture is far less scary than the 195% figure in the CBO graphic.
Forecasts are generally wrong because base assumptions are generally static while the real world is dynamic. Actual future results are almost always different than the historic forecast. Consider this graphic, courtesy of a recent blog written by Paul Krugman, the Nobel prize winning economist:
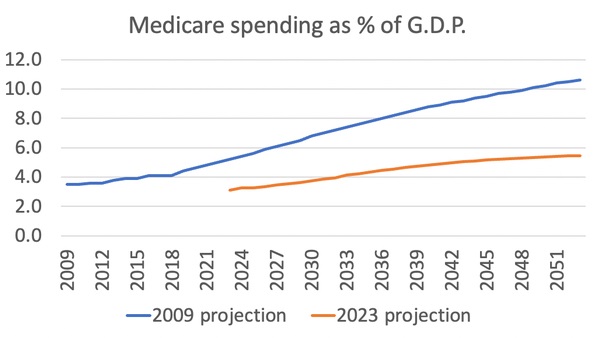
Both are CBO projections relating to the annual cost of Medicare, as a percentage of that year’s Gross Domestic Product. The “blue line” represents the 2009 CBO forecast … and the “gold line” is the current 2023 projection. In their 2009 projection, the CBO significantly overestimated today’s cost of Medicare as a % of GDP. The actual cost of Medicare today, as a % of GDP, is far, far lower than they expected it to be 14 years ago. Thus, essentially, there’s good reason to suspect they will be wrong again with their current forecast. Perhaps GDP will grow faster than they expect. Or perhaps longevity will plateau. Who knows. Regardless, as with all future forecasts, take these with a grain of salt. Especially those 20 and 30 years out.
But the size of our public debt is growing … and it’s growing at an alarming rate.
Clearly, today we can add a “years-in-the-future” possible US debt “explosion” to our growing list of things to worry about … things like ‘Climate Change,’ the possibility that AI will kill us all, and, of course, the imminent return of Freddy Krueger — who, by the way, won the award for Best Villain at the Scream Awards in 2010.
I may never sleep soundly again. 🙂
<:> Terry Liebman


